Ethereum Price Could Start 2024 With A Strong Increase If It Holds This Support

Ethereum price is correcting gains below the $2,350 zone. ETH could attempt a fresh increase unless there is a close below the $2,200 support.

  • Ethereum is correcting gains and trading below the $2,350 level.
  • The price is trading below $2,320 and the 100-hourly Simple Moving Average.
  • There is a key bearish trend line forming with resistance near $2,300 on the hourly chart of ETH/USD (data feed via Kraken).
  • The pair could start a fresh increase if there is a close above the $2,350 level.

Ethereum Price Eyes Fresh Increase

Ethereum price struggled to clear the $2,440 resistance zone and started a fresh decline. ETH declined below the $2,350 support zone to move into a short-term bearish zone, like Bitcoin.

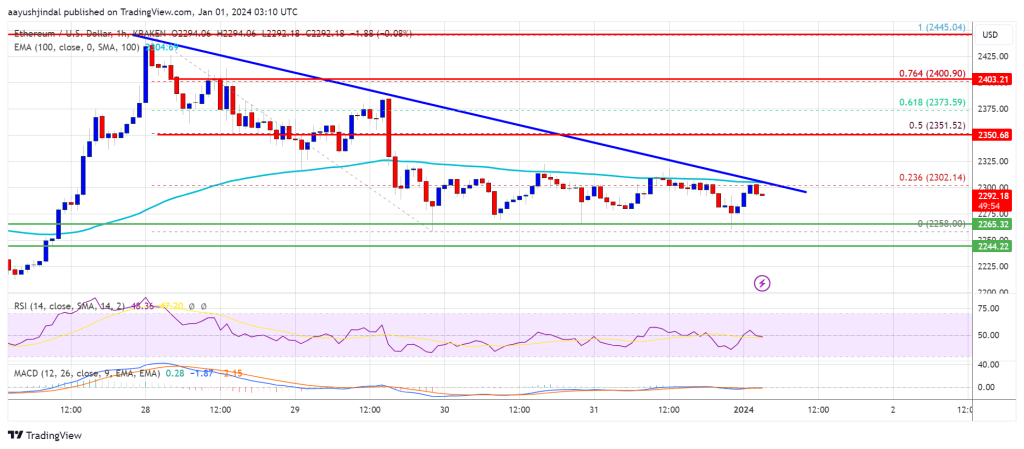
There was a close below the $2,320 level. A low was formed near $2,258 and the price is now consolidating losses. Ethereum is now trading below $2,320 and the 100-hourly Simple Moving Average. There is also a key bearish trend line forming with resistance near $2,300 on the hourly chart of ETH/USD.

On the upside, the price is facing resistance near the $2,300 level and the trend line. It is close to the 23.6% Fib retracement level of the downward move from the $2,445 swing high to the $2,258 low.

Ethereum Price

Source: ETHUSD on TradingView.com

The first major resistance is now near $2,350 or the 50% Fib retracement level of the downward move from the $2,445 swing high to the $2,258 low. A close above the $2,350 resistance could send the price toward $2,400. The next key resistance is near $2,440. A clear move above the $2,440 zone could start another increase. The next resistance sits at $2,500, above which Ethereum might rally and test the $2,550 zone.

More Losses in ETH?

If Ethereum fails to clear the $2,300 resistance, it could continue to move down. Initial support on the downside is near the $2,250 level.

The first key support could be the $2,240 zone. A downside break and a close below $2,240 might start another major decline. In the stated case, Ether could test the $2,200 support. Any more losses might send the price toward the $2,120 level.

Technical Indicators

Hourly MACDThe MACD for ETH/USD is losing momentum in the bearish zone.

Hourly RSIThe RSI for ETH/USD is now below the 50 level.

Major Support Level – $2,240

Major Resistance Level – $2,350

Record Crypto Options Volume Expires Pre-Bitcoin ETF Deadline: Analyzing BTC And ETH Reactions

The recovery of the overall crypto market this year has spurred a surge in the digital-asset derivatives market as institutional investors seek exposure to the crypto space. 

According to a recent Bloomberg report, the deadline for US regulators to approve or reject Bitcoin (BTC) exchange-traded funds (ETFs) has prompted traditional investors to turn to crypto options and futures, leading to unprecedented trading volumes.

Crypto Options Trading Hits Record High

Before the options expiry on Friday morning, crypto options trading volume reached a new all-time high, with options worth a notional value of $11 billion, as highlighted by Bloomberg. Of this total, Bitcoin contracts accounted for $7.7 billion, while Ethereum (ETH) options represented $3.5 billion.

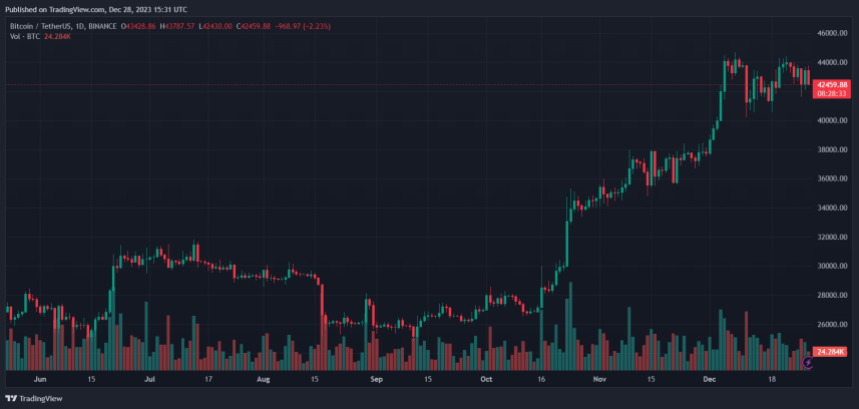
Despite the expiration of many options, the impact on the major cryptocurrencies has been limited.  With its strong support floor at $42,000, Bitcoin has maintained its position for a potential uptrend once bullish momentum returns and buying pressure increases. 

Over the past 24 hours, Bitcoin has traded within the same range as the previous day, at $42,200, experiencing only a 0.4% decline. Nevertheless, Bitcoin has yet to fully recover from its 3.4% drop over the past seven days.

Crypto

In contrast, ETH was hit by the expiration of options contracts. Ethereum, the second-largest cryptocurrency on the market, fell more than 2%. EHT dropped to $2,316 after hitting an annual high of $2,445 on Thursday.

However, while heightened trading activity may accompany the expiration of options, it is unlikely to impact spot market prices, according to Luuk Strijers significantly, Deribit’s chief commercial officer. 

Strijers notes that clients are rolling their positions to 2024 expiries, and additional activity is anticipated after the expiry. The focus of attention and trading activity will primarily be on the impending ETF decision, Bloomberg notes.

Surge From Traditional Asset Managers 

The cryptocurrency market has undergone a strong rally this year, with Bitcoin surging nearly 160% following a turbulent 2022 marked by industry scandals and price declines. 

The recovery has been fueled partly by the optimism surrounding the potential approval of spot Bitcoin ETFs, which would attract a broader range of investors to the asset class.

Ryan Kim, head of derivatives at digital-asset prime brokerage FalconX, highlights the growing participation from crossover macro accounts, referring to large traditional asset managers allocating a small percentage of their portfolios to cryptocurrencies and crypto-focused hedge funds.

In addition, according to Bloomberg, perpetual futures, a favored tool for leveraging crypto trades, are trading at a significant premium compared to spot prices, indicating rising demand for such products.

Overall, the surge in the cryptocurrency derivatives market, driven by options expiry and the pending decision on Bitcoin ETFs, reflects the growing interest of institutional investors in the crypto space. 

The record-breaking trading volumes and increased participation from traditional asset managers highlight the evolving landscape of digital assets. 

As the market awaits the regulatory verdict on Bitcoin ETFs, it remains to be seen how these developments will shape the future trajectory of the crypto market and its integration with traditional financial systems.

Crypto

Featured image from Shutterstock, chart from TradingView.com 

Ethereum Price Retreats From Highs But Technicals Suggest Upside Continuation

Ethereum price is correcting gains from the $2,440 zone. ETH is correcting gains, but the bulls might remain active near the $2,300 and $2,240 support levels.

  • Ethereum is correcting gains and trading below the $2,400 level.
  • The price is trading above $2,320 and the 100-hourly Simple Moving Average.
  • There is a bullish flag forming with resistance near $2,360 on the hourly chart of ETH/USD (data feed via Kraken).
  • The pair could start a fresh increase if there is a close above the $2,400 level.

Ethereum Price Remains Supported

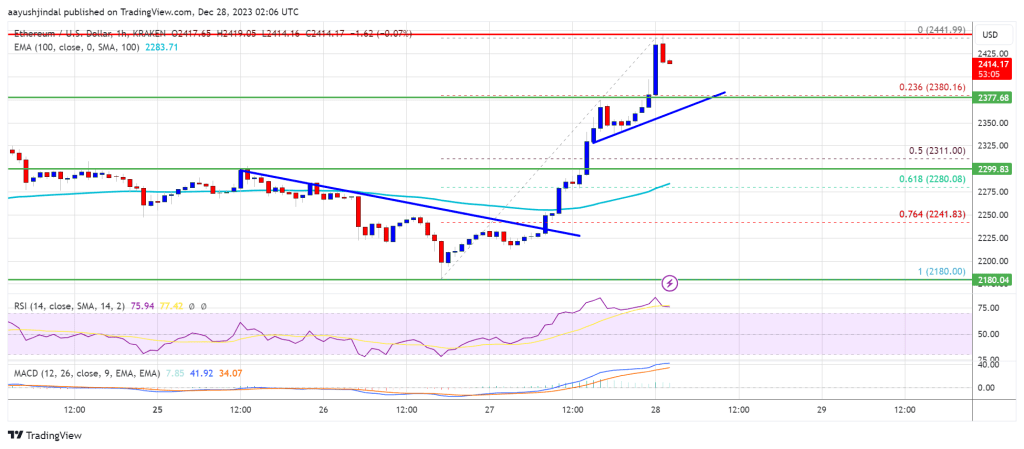
Ethereum price climbed higher above the $2,320 resistance zone. ETH even broke the $2,400 level before the bears appeared. A high was formed near $2,441 before the price started a downside correction, like Bitcoin.

There was a move below the $2,400 and $2,380 levels. The price declined and tested the 50% Fib retracement level of the upward wave from the $2,180 swing low to the $2,441 high. The bulls seem to be active near the $2,320 support zone.

Ethereum is now trading above $2,320 and the 100-hourly Simple Moving Average. On the upside, the price is facing resistance near the $2,360 level. There is also a bullish flag forming with resistance near $2,360 on the hourly chart of ETH/USD.

Ethereum Price

Source: ETHUSD on TradingView.com

The first major resistance is now near $2,400. A close above the $2,400 resistance could send the price toward $2,440. The next key resistance is near $2,500. A clear move above the $2,500 zone could start another increase. The next resistance sits at $2,620, above which Ethereum might rally and test the $2,750 zone.

More Losses in ETH?

If Ethereum fails to clear the $2,400 resistance, it could continue to move down. Initial support on the downside is near the $2,320 level and the 100 hourly SMA.

The first key support could be the $2,240 zone or the 76.4% Fib retracement level of the upward wave from the $2,180 swing low to the $2,441 high. A downside break and a close below $2,240 might start another major decline. In the stated case, Ether could test the $2,165 support. Any more losses might send the price toward the $2,120 level.

Technical Indicators

Hourly MACDThe MACD for ETH/USD is losing momentum in the bullish zone.

Hourly RSIThe RSI for ETH/USD is now near the 50 level.

Major Support Level – $2,320

Major Resistance Level – $2,400

A Crypto Christmas Special With Sheraz Ahmed: Past, Present, And Future

Another year, another Crypto Christmas special for our team at NewsBTC. In the coming week, we’ll be unpacking 2023, its downs and ups, to reveal what the next months could bring for crypto and DeFi investors.
Related Reading: A Crypto Christmas Special With Jlabs Digital: Past, Present, And Future

Like last year, we paid homage to Charles Dicke’s classic “A Christmas Carol” and gathered a group of experts to discuss the crypto market’s past, present, and future. In that way, our readers might discover clues that will allow them to transverse 2024 and its potential trends.

crypto Christmas bitcoin btc btcusdt btc price bitcoin price sheraz ahmed storm decentral house

Crypto Christmas With STORM: Bitcoin ETF Should Be Out Of Your Wishlist?

For today’s issue, our team got to chat with Sheraz Ahmed, Managing Partner at blockchain solutions provider STORM and founder of Decentral House. Ahmed has been present at some of the most important crypto events in 2023 and is constantly speaking with founders, organizations, and relevant actors within and outside the nascent sector.

Thus, Ahmed has a unique perspective on the industry, its blindspots, and possible catalyzers. During the interview, we talked about the downside of approving a Bitcoin spot Exchange Traded Fund (ETF) in the United States and why the space might be unprepared for a new bull cycle. This is what he told us.

Q: Our team has coincided with you in several crypto events this year; where do you think most of these events coincide? And what do you believe has been overlooked during 2023, a narrative, a project, something people missed as the industry enters another cycle?

Switzerland, Europe, Dubai, Singapore, and Rio (de Janeiro). I do believe that we are too early for the next cycle. The broken models of the last bull run are yet to be rebuilt. Infrastructure has improved, custody, wallets, exchanges, and stablecoins, but the business models for Dapps (Decentralized Applications) have not evolved.

I fear that we enter into another vaporware cycle and, at best have to wait 4 more years for real use cases/adoption or risk burning ourselves completely with shitcoins and scams.

Q: As Crypto enters a new cycle, what’s different about the industry when you compare it to early 2021 and 2017? Where can investors see the growth? Is it in the players joining the industry, the financial products, or in its community?

There is a bit more maturity, although that sometimes just feels like the veterans are just numb to the pain this industry can self-inflict. We do see genuine interest from large institutional players in the financial, consumer, and impact fields. But can we convert those ideas into adoption?

Investment in utility and payment tokens is an oxymoron. They are not meant to be investment products and are not regulated as such. An investor could look into an infrastructure play, although I believe that is quite saturated today at approx. $700M. My bet would be early-stage protocol ecosystem funds (equity-based), with a portion of that taken in tokens for the utility of governance, etc., that might be attached.

Q: The upcoming approval of a spot Bitcoin ETF in the US seems like the perfect indicator that crypto has made it to the mainstream, but what’s the next frontier? Where does the industry go from here?

I don’t agree. For me, it just sounds like the bankers finally believe they can make money off our industry. Now, does that mean it’ll be good for prices in the short term and more eyeballs? Yes. But be careful what you wish for, as when the heavy artillery comes in, they crush everything/everyone in their path.

In 2023, we founded Decentral House. An innovation centre focused on blockchain-based application that provide the infrastructure to spark ideas to life. I believe that by having the right tools in your arsenal, you can navigate the Web3 space to find the light at the end of the tunnel. Without the right guidance, WANGMI (We Are Not Gonna Make It). Let’s work together to create an industry of trust we can all be proud of!

Cover image from Unsplash, chart from Tradingview

PancakeSwap To Burn 300 Million CAKE, Why Is This Whale Moving Coins?

Amidst PancakeSwap’s proposal to burn 300 million CAKE and reduce the total supply from 750 million to 450 million CAKE, on-chain data indicates that a whale has been moving a significant amount of CAKE, the decentralized exchange’s governance token.

Whale Is Moving Tokens As Key PancakeSwap Voting Event Proceeds

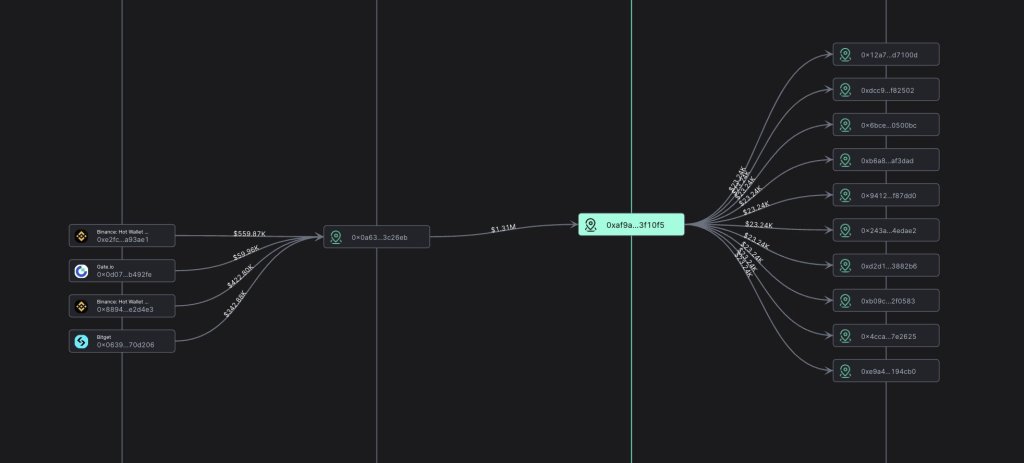
According to a report from Scopescan, a blockchain analytics platform, a whale has moved approximately 1.7 million CAKE worth $1.3 million in the past week from Binance, Gate.io, and Bitget to a series of crypto addresses. The timing of this transfer is noteworthy since it coincides with key voting that would permanently shape PancakeSwap’s tokenomics.

CAKE whale moving coins from exchanges | Source: Scopescan via X

The proposed token burn is gathering significant support, with over 90% of CAKE holders in agreement. According to the proposer, reducing the total supply to 450 million CAKE is reasonable. It would also ensure sufficient supply for future growth while achieving “ultrasound CAKE.”

Herein, the idea is to make CAKE deflationary over the long term, and this may support prices as PancakeSwap continues to play a vital role in token swapping in the broader BNB Chain ecosystem. 

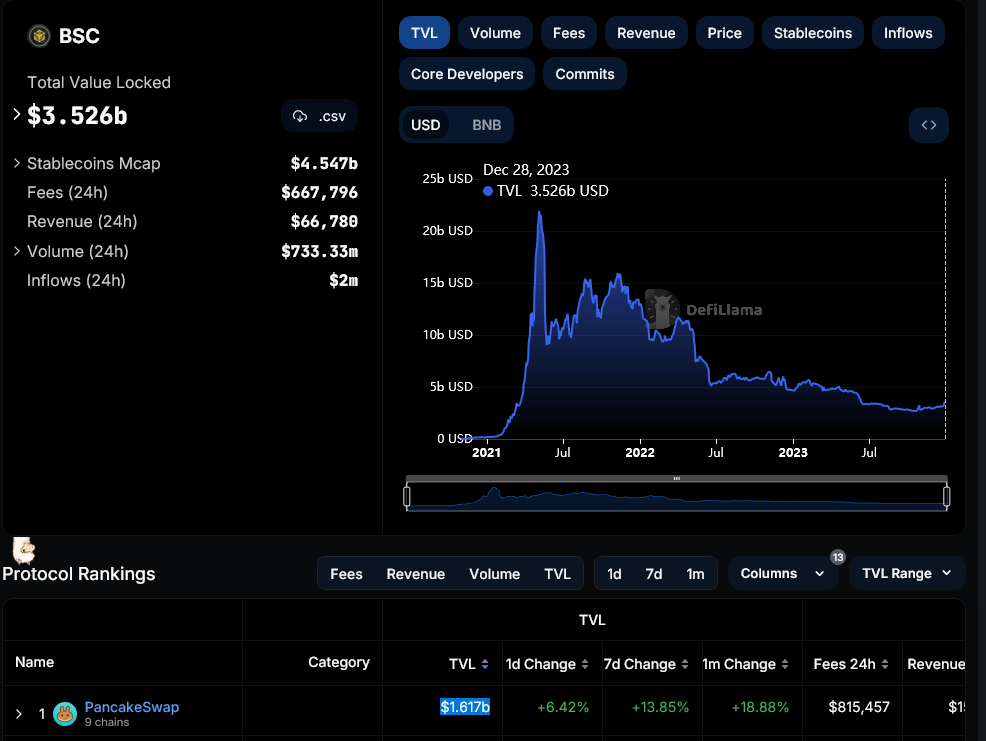
According to DeFiLlama data, PancakeSwap is the largest DEX in the BNB Chain ecosystem, with a total value locked (TVL) of $1.6 billion, commanding roughly half of the network’s TVL of around $3.5 billion. Notably, PancakeSwap has been resilient and continues to evolve, shaking off competition even after the deployment of Uniswap v3 on the BNB Chain.

In the past 24 hours, PancakeSwap has generated over $815,000 in fees, more than 7.5X that of Venus, a lending protocol, the second largest in the BNB Chain ecosystem.

PancakeSwap TVL | Source: DeFiLlama

Is CAKE Ready For $10? 

Notably, the token burn proposal also comes when PancakeSwap is undergoing significant changes, including the recent introduction of veCAKE and Voting gauges, whose voting concluded on November 22. With this proposal passing with over 99% community support, veCAKE holders can now vote on where future CAKE farm emissions will be directed.

This gives CAKE holders greater governance influence. Supporters maintain that this crucial decision makes the DEX more decentralized and community-facing.

Ahead of PancakeSwap’s plans to burn 300 million CAKE, prices have been rallying. From the weekly chart, CAKE is up by over 260% from 2023 lows, roaring as demand increases. While bullish, bulls are yet to reverse losses of this year. A critical resistance level remains at around $5. A solid, high-volume break above this line could propel CAKE to around $10 in the coming months.

PancakeSwap price trending upward on the daily chart | Source: CAKEUSDT on Binance, TradingView

Ethereum Price Surges 5% As ETH Bulls Finally Take Over, $2,550 Next?

Ethereum price is gaining pace above the $2,320 resistance zone. ETH is up over 5% and it seems like ETH is finally outperforming Bitcoin.

  • Ethereum is gaining pace and trading above the $2,300 support zone.
  • The price is trading above $2,350 and the 100-hourly Simple Moving Average.
  • There is a connecting bullish trend line forming with support at $2,380 on the hourly chart of ETH/USD (data feed via Kraken).
  • The pair could extend its rally toward the $2,500 and $2,550 resistance levels.

Ethereum Price Starts Fresh Rally

Ethereum price extended its decline below the $2,250 level. ETH even spiked below the $2,200 level before the bulls appeared. A low was formed near $2,180 and the price started a strong increase, outperforming Bitcoin.

There was a move above the $2,250 and $2,280 resistance levels. The bulls even pumped the price above the $2,350 resistance. A new multi-day high is formed near $2,441 and the price is now consolidating gains. The price is now trading above the 23.6% Fib retracement level of the upward move from the $2,180 swing low to the $2,441 high.

Ethereum is now trading above $2,350 and the 100-hourly Simple Moving Average. On the upside, the price is facing resistance near the $2,440 level.

Ethereum Price

Source: ETHUSD on TradingView.com

The first major resistance is now near $2,500. A close above the $2,500 resistance could send the price toward $2,500. The next key resistance is near $2,620. A clear move above the $2,620 zone could start another increase. The next resistance sits at $2,700, above which Ethereum might rally and test the $2,800 zone.

Downside Correction in ETH?

If Ethereum fails to clear the $2,440 resistance, it could start a fresh decline. Initial support on the downside is near the $2,380 level and the trend line.

The first key support could be the $2,320 zone or the 50% Fib retracement level of the upward move from the $2,180 swing low to the $2,441 high. A downside break and a close below $2,320 might spark more bearish moves. In the stated case, Ether could revisit the $2,200 support. Any more losses might send the price toward the $2,120 level.

Technical Indicators

Hourly MACDThe MACD for ETH/USD is gaining momentum in the bullish zone.

Hourly RSIThe RSI for ETH/USD is now above the 50 level.

Major Support Level – $2,320

Major Resistance Level – $2,440

Ethereum’s 2024 Forecast: Analyst Predicts Major Surge Sparked By This Catalyst

As the crypto industry marches into 2024, Ethereum draws significant attention from analysts and investors alike. Amidst the swirling currents of the crypto market, Ethereum stands at the cusp of what some analysts are predicting to be a ‘transformative period.’

This anticipation stems from two crucial developments: an impending network upgrade and the potential approval of Ethereum-based spot ETFs, according to renowned analyst CryptosRUs.

Catalysts For Growth: Upgrades And Spot ETF Approval

The Ethereum network is gearing up for its next major upgrade, slated for January 2024. This upgrade, known in the crypto community as the Dencun Upgrade, is expected to usher in a range of enhancements to boost network efficiency.

Key among these improvements are features designed to shrink transaction fees on the Ethereum mainnet. This move could significantly ease congestion issues that have long been a concern for users and developers.

Additionally, modifications to smart contract operations and enhancements to staking protocols are on the cards, setting the stage for an optimized Ethereum ecosystem.

According to CryptosRUs, the anticipated Dencun Upgrade is not the only factor fueling optimism for Ethereum’s growth in 2024. The analyst has further highlighted the potential impact of approving a spot exchange-traded fund (ETF) for Ethereum.

Such a development could mark a pivotal moment for Ethereum, potentially driving widespread adoption and significant price appreciation.  The analyst points out that approving an Ethereum spot ETF could mirror the influence seen in other markets, substantially boosting investor confidence and market liquidity.

Regulatory Hurdles And Ethereum Growth Trajectory

So far, the path to a spot ETF approval appears to be intertwined with regulatory processes. The US Securities and Exchange Commission (SEC) has been extending its timeline for decision-making on both Bitcoin and Ethereum spot ETFs.

With numerous applications pending, the crypto market awaits the SEC’s verdict, which is anticipated to arrive in 2024. The SEC noted in a recent filing:

The Commission finds it appropriate to designate a longer period within which to take action on the proposed rule change so that it has sufficient time to consider the proposed rule change and issues raised therein.

Meanwhile, Ethereum’s performance continues to exhibit resilience and growth. Over the past year, Ethereum’s value has increased by 88.2%, with a continued upward trajectory evident in recent trading periods. At the time of writing, ETH has experienced a 5.3% surge in the last 24 hours, trading at $2,346.

Ethereum (ETH) price chart on TradingView

Furthermore, CryptosRUs analysis also extends to ETH, which has shown price movements analogous to Solana’s (SOL) recent surge. SOL’s value has soared by over 100% in the past month, leading the analyst to draw parallels with Ethereum’s potential price trajectory.

CryptosRUs suggest that ETH may exhibit a bull flag pattern as it heads into the upcoming upgrade and possibly spots ETF approval, mirroring Solana’s recent performance.

Featured image from Unsplash, Chart from TradingView

Ethereum Price Hints At Potential Correction, Buy The Dip?

Ethereum price is correcting gains from the $2,320 resistance zone. ETH is moving lower and might even test $2,050 before the bulls take a stand.

  • Ethereum is correcting gains below the $2,250 support zone.
  • The price is trading below $2,240 and the 100-hourly Simple Moving Average.
  • There are two bearish trend lines forming with resistance near $2,230 and $2,260 on the hourly chart of ETH/USD (data feed via Kraken).
  • The pair could extend its decline and revisit the $2,050 support zone.

Ethereum Price Extends Losses

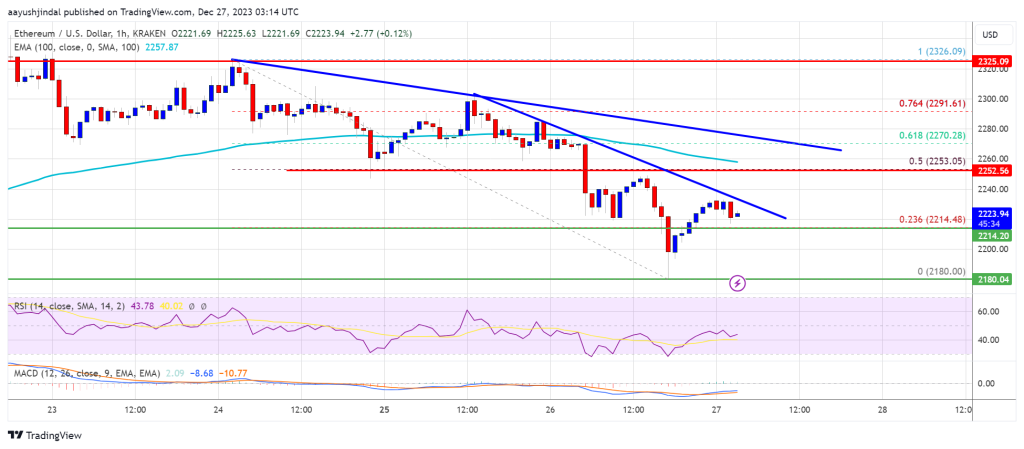
Ethereum price started a downside correction from the $2,325 level. ETH declined below the $2,300 and $2,265 levels. The bears were even able to push the pair below the $2,200 level, like Bitcoin.

A low was formed near $2,180 and the price is now attempting a fresh increase. There was a move above the $2,200 level. The price climbed above the 23.6% Fib retracement level of the downward move from the $2,326 swing high to the $2,180 low.

Ethereum is now trading below $2,240 and the 100-hourly Simple Moving Average. On the upside, the price is facing resistance near the $2,230 level. There are two bearish trend lines forming with resistance near $2,230 and $2,260 on the hourly chart of ETH/USD.

The second trend line is close to the 50% Fib retracement level of the downward move from the $2,326 swing high to the $2,180 low. A close above the $2,260 resistance could send the price toward $2,325.

Ethereum Price

Source: ETHUSD on TradingView.com

The main resistance sits at $2,350. A clear move above the $2,350 zone could start a decent increase. The next resistance sits at $2,420, above which Ethereum might rally and test the $2,500 zone.

More Downsides in ETH?

If Ethereum fails to clear the $2,260 resistance, it could start a fresh decline. Initial support on the downside is near the $2,200 level.

The first key support could be the $2,180 zone. A downside break and a close below $2,180 might spark more bearish moves. In the stated case, Ether could revisit the $2,120 support. Any more losses might send the price toward the $2,050 level.

Technical Indicators

Hourly MACDThe MACD for ETH/USD is losing momentum in the bearish zone.

Hourly RSIThe RSI for ETH/USD is now below the 50 level.

Major Support Level – $2,180

Major Resistance Level – $2,260

Forget High Gas Fee Challenges, Ethereum Remains Bullish: Time To Buy More?

Despite concerns over network congestion and high gas fees, Ethereum remains bullish in the long term, according to borovik.eth–a partner at Rollbit, who posted on X on December 26. The key factors driving the positive outlook are pointing to Ethereum’s developer ecosystem, its role in the broader blockchain ecosystem, and the launch of numerous Layer-2 solutions (L2s). 

Will Layer-2 Activity Drive ETH To New Highs?

Borovik.eth remained deviant and optimistic about ETH, even with Solana (OSL) and other layer-1 coins like Cardano (ADA) soaring in 2023. In the analyst’s view, Ethereum’s scaling challenges are manageable, believing that developers will find ways of “resolving this concern permanently over the long term.”

Based on this optimism, the Rollbit partner believes that ETH will likely recover strongly in the coming sessions considering the level of development, especially of layer-2 scaling options meant for the pioneer smart contract platform. According to Borovik.eth, the development of layer-2 off-chain options backed by massive companies, for instance, Coinbase, a crypto exchange, and venture capitalists (VCs), positions Ethereum (ETH) favorably for a bull run.

As of December 26, ETH remains in an uptrend but is cooling off after solid gains in Q4 2023. At spot rates, ETH is underperforming most layer-1 platforms like Injective Protocol (INJ) and Solana (SOL), whose prices rallied, reaching new 2023 highs. ETH prices are still trending below $2,400, a critical resistance level. If bulls overcome this line, ETH may fly towards $3,500 or better in the months ahead.

Ethereum price trending sideways on the daily chart | Source: ETHUSDT on Binance, TradingView

The spike in SOL’s valuation, especially in H2 2023, has led to a comparison with ETH. Even so, most traders are optimistic. Arthur Hayes recently stated that users should begin rotating funds from SOL to ETH, an endorsement of the second most valuable coin by market cap.

Ethereum Layer-2s Manage Over $18.8 Billion

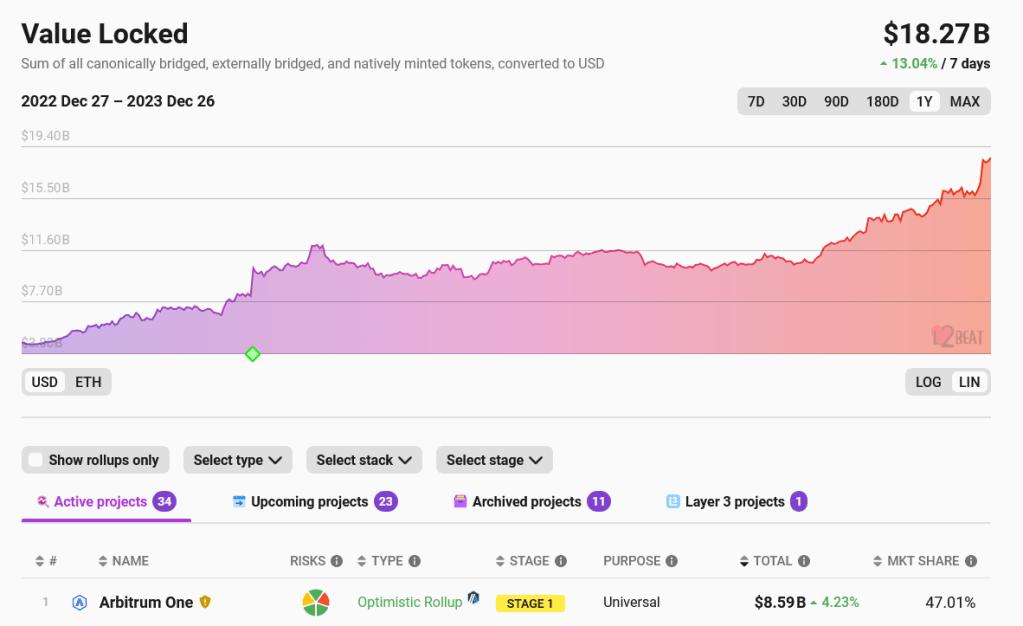
While Ethereum faces challenges around on-chain scaling, developers have been working hard to resolve this issue. The release of layer-2 off-chain options using rollups has been key in this drive. Most of these solutions, including Arbitrum and Optimism, have been critical in alleviating pressure from the mainnet, thus reducing gas fees. According to L2Beat, layer-2 protocols manage over $18 billion as total value locked (TVL). There are also 34 active projects, with 23 more being developed.

Ethereum layer-2 TVL | Source: L2Beat

Among the big companies hitching the layer-2 ride is Coinbase, where through Base, users can transact cheaply while relying on the Ethereum mainnet for security. According to Borovik.eth, over 60% of Base’s revenue is from rollup fees charged, highlighting the importance of their scaling solution and the role Ethereum plays in all this. 

Related Reading: Shiba Inu Whale Moves $45 Million In SHIB, Bullish?

The upcoming Dencun Upgrade set for integration next year will further slash layer-2 fees. Developers plan to release this update in the Goerli test network as early as mid-January 2024.

A Crypto Christmas Special With Material Indicators: Past, Present, And Future

Another year, another Crypto Christmas special for our team at NewsBTC. In the coming week, we’ll be unpacking 2023, its downs and ups, to reveal what the next months could bring for crypto and DeFi investors.

Like last year, we paid homage to Charles Dicke’s classic “A Christmas Carol” and gathered a group of experts to discuss the crypto market’s past, present, and future. In that way, our readers might discover clues that will allow them to transverse 2024 and its potential trends.

Crypto Christmas: A Deep Look Into The Bull Market And A Secret Pattern

Once again, the crypto analytics firm Material Indicators joined us to discuss the current market structure.
This year, we spoke with Keith Alan, one of the co-founders and analysts at the firm. Alan gave us his perspective on the bull market or what looks like the beginning of a bullish trend.

Material Indicators is well known for their reliance on hard data, and for sharing views that often questioned the general beliefs in the crypto market. This time was no difference as Alan pointed to the evidence favoring both sides, bulls and bears. This is what he told us.
crypto christmas bitcoin etc btcusdt

Q: In light of the prolonged bearish trends observed in 2022 and 2023, how do these periods compare to previous downturns in severity and impact? With Bitcoin now crossing the $40,000 threshold, does this signify a conclusive end to the bear market, or are there potential market twists investors should brace for?

MI:

Nobody could argue that 2022 was anything but a bear market. After Bitcoin reached an ATH in November of 2021 we saw the bear market develop in classic fashion by losing support at key technical levels. While the bear was playing out in somewhat predictable fashion, the market was caught off guard by the events that led to the FTX crash in November 2022. Because the contagion from FTX had a devastating ripple effect that was felt by the largest institutions with crypto exposure as well as banks, I actually expected prices to fall even lower. 

At the time, fear and fighting among institutional players like Galaxy, Gemini and Grayscale (under DCG) who were among SBF’s largest institutional victims added to the concern that price would grind down towards the lower teens, yet somewhat remarkably and perhaps not so coincidentally on January 1, 2023 Bitcoin started to rally. What was first considered weekend whale games evolved long past the weekend, and in fact, through Q1/2023 I identified an entity on FireCharts which I nicknamed “Notorious B.I.D.” that was double stacking large blocks of bid liquidity to push price higher. There was a pattern to the behavior that made it somewhat predictable and tradable. Those moves were well documented in my X feed during that period of time. Once price reached $25k that entity disappeared. Even without the help of that manipulation pushing price up, and despite the fact that the macroeconomic situation was horrible, the geopolitical situation went from bad to worse and the US political situation evolved from a dysfunctional sh*t show to a full blown circus, the market continued to rally. 

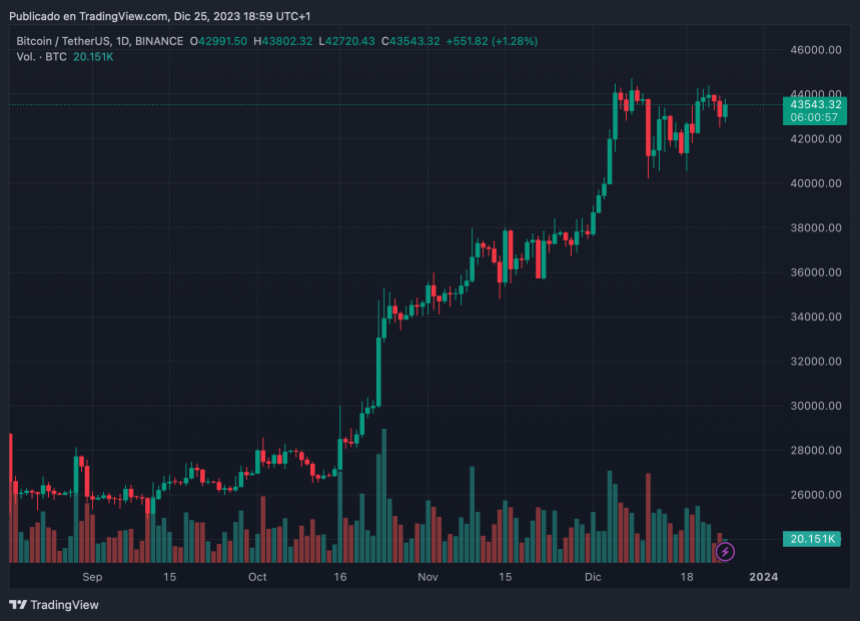
Now, nearly 12 months and > 150% from the day the rally began, the debate between bulls and bears over whether this is a confirmed bull market or a sequence of bear market distribution rallies literally continues today. While it’s understandable that someone could look at 150% and immediately assume bull market, it does require a deeper understanding of what distribution and accumulation look like. From my view, that still isn’t as clear as one would expect. Historically, the Purple Class of Whales with orders in the $100k – $1M range have had the most influence over BTC price direction. The order flow data I’ve been monitoring on Binance shows that through most of the year they (along with larger MegaWhales) have been buying dips and distributing significantly more than they bought on those dips on the uptrends that followed.

Only recently have we seen an uptick that could be an indication that the trend is shifting. Parallel to that, some on-chain data providers are showing an increase in the number of wallets holding BTC which is also an indication that we could be transitioning from a distribution phase to an accumulation phase and I’m looking for more clear evidence of that. One of the things I look for to get a sense of that is bid liquidity. I believe that “Liquidity = Sentiment,” and it’s no secret that order books have been thin on both sides of price through most of the year, however in the last 3 weeks or so, we’ve started seeing more institutional sized bid ladders coming into the order book and that fact supports a bullish thesis, as long as they don’t dump through the next pump.
With all of the above in mind, there are most certainly turns and twists that investors should look out for. Sure we are starting to see some improvements on the U.S. inflation and unemployment numbers, but something in those reports doesn’t jive with reality. For most middle and lower income Americans, credit card debt is climbing to new highs, rents have soared, home ownership is unattainable, grocery prices are high and a Metallica “Standing Room Only” Field ticket is $575.  So in my mind, we still have a percolating macroeconomic problem and the geopolitical and U.S. political issues seem to get worse by the day.

crypto christmas

Aside from that, the RSI has been over cooked for an extended period of time and we just had 8 consecutive green weekly candles. Both of those factors have historically led to corrections. I could give you the “History doesn’t have to repeat itself…” spiel or I can show you what historically happens after moves like this and let you decide. 

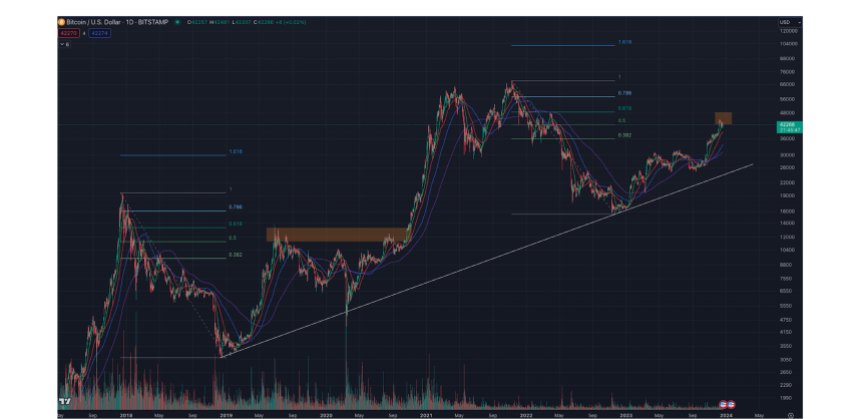
Another potential twist to consider is that the current PA has a striking resemblance to the first leg of the 2019 rally that turned out to be a Fib retracement, that ultimately got rejected from the top of the Golden Pocket at .618 Fib. That led to a 53% correction before the Covid Crash took it down more than 70% from the .618 Fib.
crypto christmas

At this stage, I’d be surprised to see a downside move that deep without the aid of a Black Swan, but we are currently having some interaction with the Golden Pocket that seems familiar. While it is reasonable to expect some resistance entering and exiting the Golden Pocket, there is one very weird twist to what we are seeing and that is a strange pattern I’ve noticed occurring on or around December 17th. Every year since 2017 there has been a move on December 17th that had Macro implications. The only exception to that is last year when it happened on December 20th. On each occasion the price action led to a macro breakout or breakdown. It’s too soon to tell if this move will validate the pattern on the day of writing (Dec 19th), but on the 17th we saw BTC get rejected from the lower end of the Golden Pocket and also lose the 21-Day moving average. Price has been flirting with both of those levels ever since so we’ll have to wait to see how it plays out over time. Aside from those things I’m watching the upcoming ETF window very closely. I think that the market is numb to SEC delays on these decisions, but there is so much anticipation that this time we’ll see an approval, that a flat out rejection has the potential to be the catalyst that triggers a correction. 

Regardless of where you side on whether we are or are not in a confirmed bull market, we’re seeing a lot of evidence that if we are not in it, we’re close to it. If you’re a long term investor and you haven’t already started building a position, it’s a good time to identify some targets to start scaling into one. This of course depends on your time horizon and risk appetite, but if you have a long term outlook and 6 figure targets for BTC it’s still early enough to get in, but it’s also a good idea to save some dry powder for a correction because in my opinion, it’s not a matter of if it will come, but when.

Q: Right now, we are seeing Bitcoin reach new highs. Do you think we are in the early days of a full bull run? What has changed in the market that enabled the current price action; is it the Bitcoin spot ETF or the US Fed hinting at a loser policy or the upcoming Halving? What is the big narrative that will go on in 2024?
MI:

Despite the ongoing debate between bulls and bears over whether or not we’ve been in a bull market, I can say that despite the uptrend, there has been no clear confirmation that we’ve been in a bull market through most of the year. However, the fact that we’ve recently started to see more institutional sized bid ladders coming into the order book along with the on-chain data that indicates more wallets holding for longer and the recent buying after the R/S flip at $40k are indications that we may be on the verge of a breakout.

There’s no doubt in my mind that a lot of the momentum we’ve been seeing is related to the next ETF decision window opening January 5-10 and the April 2024 Halving. The FED’s recent decision to pause rate hikes and hint at a pivot to cuts in 2024 certainly added fuel to that momentum that pushed price above $40k. In typical crypto form, we also had some help in late October through early December when I noticed some familiar patterns in the order book. I can’t confirm with absolute certainty if it was the Notorious B.I.D. spoofer we saw in Q1 returned, but it was the same game I identified through Q1 being executed and there is no question that it helped push price up through the $35k – $40k range before it disappeared.

(…) As much as I’d like to see a correction come before we get there (the Bitcoin spot ETF decision), the market doesn’t care what I want. I would expect it to come before the Halving. Whether it comes before or after the ETF decision window closes remains to be seen. In the meantime, I’ll continue to watch order book and order flow data and trade what’s in front of me.

Q: Last year, we spoke about the most resilient sectors during the Crypto Winter. Which sectors and coins will likely benefit from a new Bull Run? We are seeing the Solana ecosystem bloom along with the NFT market; what trends could benefit in the coming months?

MI:

The vast majority of my focus is on Bitcoin and to be honest, after seeing so many ponzi’s in the space, it’s the only digital asset I truly trust. There are certainly some great opportunities with certain alts, but with that comes increased risk. As for sectors, it’s no secret that AI and Gaming have been hot. According to some research I’ve been reviewing Memes, DePin and GambleFi are dominant narratives right now.

The fact that Memes are more dominant than something that’s actually physical like DePin speaks to the immaturity of this market. Perhaps a better way of stating that is, “We are still early.” That said, if I’ve learned anything in crypto there is an opportunity cost associated with having high standards and principles for projects you invest in. As ridiculous as that may sound, the biggest upside potential seems to come from some of the most meaningless projects because they have large communities of “Crypto Bros” pumping them and thin liquidity makes them easy to pump. Just know that they also come with a huge risk and like every other ponzi, you don’t want to be the last guy holding the bag.

I personally tend to avoid memes for all the reasons I mentioned above, but I do trade DOGE on occasion because it’s been a relatively easy scalp lately. Elon Musk playing kingmaker with that coin doesn’t make me like it any more or less (okay maybe less), but the results have been predictable.  The fact he has obtained a money transfer license for X (Twitter) and that he has a DOGE logo on his X profile has me considering taking a flier on DOGE, but that’s not something I’m recommending to anyone who isn’t willing to lose that money. The fact he has SpaceX launching a DOGE sponsored satellite next month should at the very least bring a short term pump.

Of the leading narratives mentioned, Memes may be the most dominant, but DePin is the most interesting to me, because it’s associated with something very real and very hot right now. For those who may not be familiar, DePin stands for Decentralized Physical Infrastructure Networks which are blockchain protocols that build, maintain and operate infrastructure for the AI industry. (Do Your Own Research).

The fact that you mentioned Solana is proof that nothing changes sentiment like price. Solana has been through the ringer since falling from it’s ATH in November 2021 and the FTX crash of 2022 delivered another 80% correction that took it to single digit levels. There is no denying that it has been on an epic run recently. It’s somewhat puzzling to me how that is happening at the exact same time FTX liquidators have started the long process of distributing over $1B worth of $SOL back into the market.

Rather than speculate on what may be behind that, I’ll say that it is apparent that they have a very strong community and despite the network issues they’ve had in the past, they seem to be growing in popularity in staking pools. Then again, nothing influences sentiment like price, so I expect we’ll see a number of coins filter their way in and out of the leading narratives through the year. I’m just hoping more of them do so for legitimate reasons rather than fake news or P&D groups. IMO, until we see the projects with real teams, real use cases, real adoption and real revenue establishing themselves as the best projects to invest in for their fundamentals, “We’re still early.”

Keith Alan is President at Keith Alan Productions, Inc., Co-Founder at Blacknox, LLC and Material Indicators, LLC. Nothing written should be taken as financial advice. For more insight and analysis follow @KAProductions and @MI_Algos. Find premium tools for traders at Material Indicators.

Cover image from Unsplash, chart from Tradingview
Ethereum: Balancing Act At $2,300 – Scaling The Heights Or Facing A Looming Drop?

The past few weeks have been a rollercoaster ride for Ethereum. Buoyed by a waning Bitcoin dominance and an influx of traders seeking greener pastures, Ethereum’s price surged towards critical resistance levels near $2,500.

Yet, a palpable anxiety lingers in the air, fueled by questions about Ethereum’s long-term scalability and the increasing chorus of bearish whispers. Can the second-largest crypto navigate this tightrope walk and reclaim its DeFi crown, or will it take a tumble from grace?

Ethereum Rises: Growth, Innovations, And Challenges

Beneath the surface of rising price charts lies a complex story of intertwined strengths and weaknesses. Ethereum’s impressive 87% year-on-year market cap surge, catapulting it from $140 billion to a hefty $267 billion, paints a picture of robust growth.

The Merge upgrade, a landmark event streamlining Ethereum’s blockchain, and the burgeoning DeFi ecosystem pulsating with innovative applications are key contributors to this ascent.

However, lurking beneath this facade is a critical bottleneck: Ethereum’s Layer 1 scalability limitations. The network’s notorious high transaction fees and sluggish throughput have become thorns in the side of DeFi expansion, frustrating both users and developers yearning for a smoother experience.

As of writing, on this 26th of December, Ethereum’s price hovers around $2,233, painting the daily and weekly charts red with a dip of roughly 1.5%, data from Coingecko shows. This recent descent adds further intrigue to the complex dance Ethereum is performing near the critical $2,500 resistance level.

This delicate dance between bullish aspiration and bearish pressure underscores the fragile equilibrium in the market. On one hand, the optimism surrounding Ethereum’s future potential continues to draw in traders.

On the other hand, the specter of high transaction fees and scalability woes, alongside whispers of a potential bear market, keeps selling pressure simmering just below the surface.

Ethereum At $2,300: Bulls’ Battle, Bears’ Threats

For Ethereum bulls, the $2,300 level is a crucial battleground. If they can muster enough buy-side force to sustain a climb above this mark, it could pave the way for a surge towards the coveted $2,500 resistance level. This breakthrough would be a significant psychological victory, injecting fresh confidence into the market and potentially triggering a new upward trend phase.

However, the bears are not out for the count. Their sights are set on breaching the $2,200 support level, which would solidify their grip and potentially trigger a more substantial decline. Should this scenario unfold, the $2,000 mark could come into play, with further losses possible if selling pressure remains unchecked.

Adding to the intrigue is the factor of exchange supply. A recent increase in Ethereum tokens on exchanges indicates more readily available ETH for sellers, potentially amplifying downward pressure. This highlights the delicate balance between market sentiment and technical factors in determining Ethereum’s future trajectory.

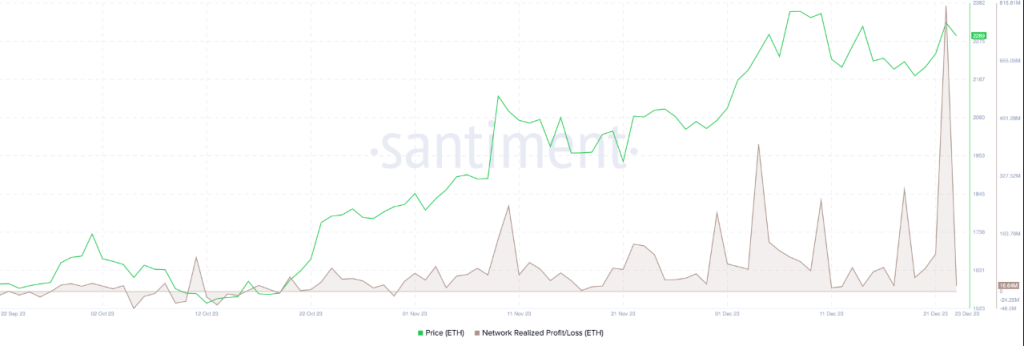
Meanwhile, the ETH traders’ profit-taking is evident in the Network Realized Profit/Loss between October 31 and December 23. A significant amount of profit-taking may cause the price of ETH to decline.

Ethereum’s Critical Crossroads Ahead

Looking ahead, Ethereum’s path hinges on its ability to navigate this complex landscape. Addressing its scalability issues through Layer 2 solutions and potential future upgrades will be crucial for maintaining and expanding its DeFi dominance.

Rekindling developer and user confidence by reducing transaction fees and improving network throughput is also paramount. Only by tackling these internal challenges and adapting to the ever-evolving crypto sphere can Ethereum truly reclaim its throne as the king of DeFi.

The next few weeks are likely to be pivotal for Ethereum. Will it scale the $2,500 height and cement its position as a leader in the crypto revolution? Or will internal limitations and external pressures force it to face a precipitous drop?

Featured image from Shutterstock

Ethereum Price Relatively Muted But Approaches Crucial Breakout

Ethereum price is consolidating gains below the $2,350 resistance zone. ETH could revisit the $2,200 support before it starts a fresh increase.

  • Ethereum is still holding gains above the $2,250 support zone.
  • The price is trading below $2,280 and the 100-hourly Simple Moving Average.
  • There is a connecting bearish trend line forming with resistance near $2,290 on the hourly chart of ETH/USD (data feed via Kraken).
  • The pair could extend its decline and revisit the $2,200 support zone.

Ethereum Price Remains In A Range

Ethereum price started a downside correction from the $2,350 level. ETH declined below the $2,320 and $2,300 levels. It even spiked below the $2,250 level.

A low was formed near $2,247 and the price is now attempting a fresh increase, like Bitcoin. There was a move above the $2,265 level. The price climbed above the 23.6% Fib retracement level of the downward move from the $2,327 swing high to the $2,247 low.

Ethereum is now trading below $2,280 and the 100-hourly Simple Moving Average. On the upside, the price is facing resistance near the $2,290 level. There is also a connecting bearish trend line forming with resistance near $2,290 on the hourly chart of ETH/USD.

The trend line is close to the 50% Fib retracement level of the downward move from the $2,327 swing high to the $2,247 low. A close above the $2,290 resistance could send the price toward $2,320.

Ethereum Price

Source: ETHUSD on TradingView.com

The main resistance sits at $2,350. A clear move above the $2,350 zone could start a major increase. The next resistance sits at $2,420, above which Ethereum might rally and test the $2,550 zone.

More Losses in ETH?

If Ethereum fails to clear the $2,290 resistance, it could start a fresh decline. Initial support on the downside is near the $2,250 level.

The first key support could be the $2,220 zone. A downside break and a close below $2,220 might spark more bearish moves. In the stated case, Ether could revisit the $2,120 support. Any more losses might send the price toward the $2,040 level.

Technical Indicators

Hourly MACDThe MACD for ETH/USD is losing momentum in the bullish zone.

Hourly RSIThe RSI for ETH/USD is now below the 50 level.

Major Support Level – $2,220

Major Resistance Level – $2,290

A Crypto Christmas Special With Jlabs Digital: Past, Present, And Future

Another year, another Crypto Christmas special for our team at NewsBTC. In the coming week, we’ll be unpacking 2023, its downs and ups, to reveal what the next months could bring for crypto and DeFi investors.

Like last year, we paid homage to Charles Dicke’s classic “A Christmas Carol” and gathered a group of experts to discuss the crypto market’s past, present, and future. In that way, our readers might discover clues that will allow them to transverse 2024 and its potential trends.

Crypto Christmas: What’s Behind The Bitcoin Rally, And Which Coin Has The Most Potential?

This year, we kicked off this special with JLabs Digital, formerly Jarvis Labs. One of the most prominent crypto analytics firm in the nascent sector. Their insight into the market dynamics has been popular due to their use of solid data and easy-to-follow style.
Since 2022, the team at JLabs Digital has been expanding as they bring in new analysts, educational tools, and new ways to share their insights. Last year, we spoke to one of its founders, Ben Lilly, who was betting on crypto becoming “better” and more mature due to the lessons left by the fall of FTX and others.
JJ walked us through the differences between this rally and previous years, the most undervalued coin in the sector, the potential twists in the market, and more.

crypto christmas bitcoin etc btcusdt

Q: In light of the prolonged bearish trends observed in 2022 and 2023, how do these periods compare to previous downturns in severity and impact? With Bitcoin now crossing the $40,000 threshold, does this signify a conclusive end to the bear market, or are there potential market twists investors should brace for?

JJ:

So with Bitcoin now crossing over the $40,000 threshold, does this signify a conclusive end to the bear market (…) I’m leaning towards the twist portion of that. I think most of this rally was really driven by disbelief and people shorting it to each pump, especially as we neared $30K, there was just a huge washout of shorts that had ated over the past year between options and derivatives. So that forced buying is really what set us up over $40,000 in my opinion. So now to sustain this, there’s going to have to be continued spot buying to see the price above, say $48,000 to $52,000.
I think it’s possible we get up to that range, but I don’t think we’re just going to get to that range and keep ripping. I think sooner or later we’re going to come back down and retest that $30,000 mark. So that’s an eye investors and traders should have their eye on into 2024. I do think you’ll inevitably get that large leverage washout as is very typical in Bitcoin.
Q: Right now, we are seeing Bitcoin reach new highs. Do you think we are in the early days of a full bull run? What has changed in the market that enabled the current price action; is it the Bitcoin spot ETF or the US Fed hinting at a loser policy or the upcoming Halving? What is the big narrative that will go on in 2024?
JJ:
I do think we’re entering a new bull market, but that said, there’s always going to be twists and turns and leverage liquidations. Keep that level in mind. $28K to $32K, think will be as good an entry as any if we get that opportunity in 2024.
Anytime we see those big breakouts we saw in October, it’s just so typical Bitcoin to come back and retrace it. But what it first wants to do is engineer liquidity. So you have to realize the people that paint these charts are very sophisticated and they want to make you enter at less than optimal prices and sell less than optimal prices. So how they do that, they kind of coax you into buying at $40K. (They make you think) It’s never going to go back down again. And then next thing you know you’re holding onto those buys and it’s at $28,000 and you’re being forced to sell.
I think this (rally) is much different. Basically if you look at 2021, we had (Microstrategy’s Michael) Sailor and Tesla buying (BTC), but outside of that, as we know, it was a lot of leverage to (investors) such as Three Arrows Capital, Grayscale, the Digital Currency Group that was overlooking it. All these people were getting access to massive amounts of leverage due to how cheap it was to borrow the dollars at the time, due to the interest rates being zero, they were using that to leverage themselves and basically pump Bitcoin artificially. And then we all saw that washout last year and as opposed to what we see now, this is actual institutional buying.
So there’s been no doubt that I’m sure BlackRock, Fidelity, et cetera, they’re not buying now, they were buying below $20,000, they were buying throughout the $20,000 range. They’re not buying above $35,000 to $40,4K. So we do see a bit more strength at the bottom of the market, which is going to form a better base for 2024.
But that said, there’s always going to be those ups and downs, but I think long-term, the fact that we saw that capitulation from kind of the leverage deigns to institutional players who know how to organize and manage these trades more efficiently, I think it’s very bullish for Bitcoin and definitely regime shift.
I think it’s kind of forming. I mean as of right now, the future’s kind of unpredictable, but the things I see, we have this ETF coming. Do I think it’s going to be like the moment it’s approved, Bitcoin’s just going to take off? No, there’s a lot of complications with that. Like the Grayscale BTC trust, I think they hold over 600,000 BTC that’s going to have to get distributed. I’m not sure that there’s enough demand as of yet to just soak up all that supply that’ll be coming onto the market. But as we go down the line a few months later, these ETFs are rolling. BlackRock has their team of thousands of advisors out there selling this because they’re incentivized to. And at the same time we have “The Halving” where supply cuts down on the amount of emissions miners able to readily sell as supply.
So you’ll have this massive influx. It’s very hard to be overstated the amount of new demand that will be coming online because of the ETF. At the same time we have “The Halving” event which is going to cut down on the amount of supply available for sale. I think that’s kind of forming a perfect storm in of itself. And then you look at the dollar, the DXY index, this is something I hit on a lot in my articles and the videos that we do on YouTube, and you see it’s (the DXY) been on a downtrend throughout 2023. It looks like it’s getting worse into 2024.
We just had the Fed signaling that they’re thinking about rate cuts, which is usually as good a sign as any that those rate cuts will be happening. So the dollar will be weakening. At the same time we have this massive new demand for Bitcoin. At the same time the supply of Bitcoin’s dropping down. So you can see that all the stars are aligning for new all time highs, a hundred thousand plus targets. But it’s going to be a tricky road there.
Like I said, I think we’re going to inevitably go back down to that $28 to $30K range, and then probably in the second half of the year we’ll really see it defy expectations to the upside.
Q: Last year, we spoke about the most resilient sectors during the Crypto Winter. Which sectors and coins will likely benefit from a new Bull Run? We are seeing the Solana ecosystem bloom along with the NFT market; what trends could benefit in the coming months?

JJ:
It’s hard to say. As of right now, the narratives that’ll take hold, there’s going to be some crazy pumps on things and there’s going to be wild narratives like we saw with DeFi in 2021, what those are right now, we could guess, but there’s nothing definitive in my mind that it seems like, I think a lot of it’s being priced in now, actually. You see kind of these wild altcoin pumps over the past month. I don’t know how sustainable that is over the near term, but I think one thing people are overlooking is if this BTC ETF gets approved, we’ve kind of set the legal precedent that what the SEC did in approving the Bitcoin ETF, the futures ETF, but not approving the spot was illegal.

They’ve already approved Ethereum futures ETFs and now there’s a bunch of spot Ethereum ETFs open for application. So I think it’s inevitable that those will get approved and I think Ethereum is wildly underpriced. Not to say we won’t get pullbacks from here, but those are pullbacks you should be looking to buy because I think an Ethereum spot ETF is almost a hundred percent likely in the second half of 2024. And I think we’ll see some coins that were probably overpriced compared to Ethereum. If you factor that in, and I think we’ll see Ethereum and its use cases really start to take life in 2024. You see a flight to value at some point there, rather than the wild speculation that happens on other alts.

Cover image from Unsplash, chart from Tradingview
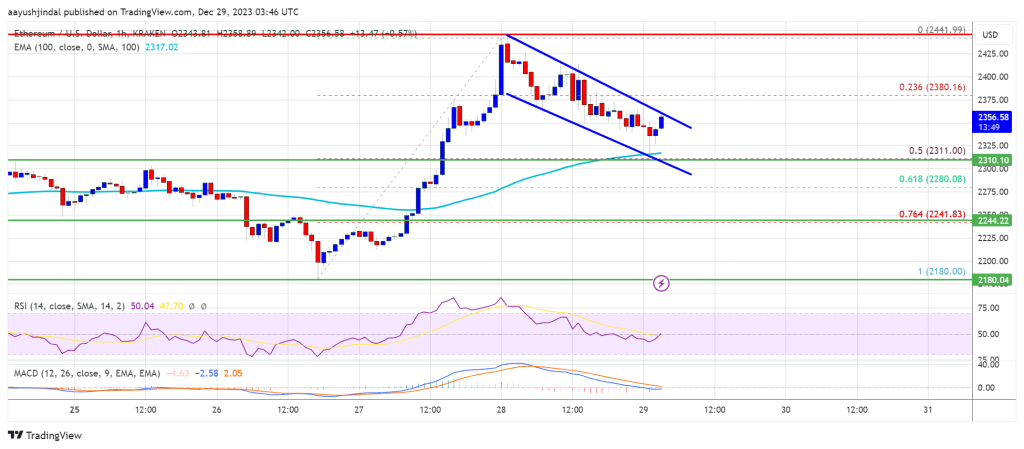
Ethereum Price Dips Again – Is This Bulls Trap or Technical Correction?

Ethereum price is correcting gains from the $2,350 resistance zone. ETH could start a fresh increase if it stays above the $2,200 support zone.

  • Ethereum started a downside correction from the $2,350 resistance zone.
  • The price is trading near $2,275 and the 100-hourly Simple Moving Average.
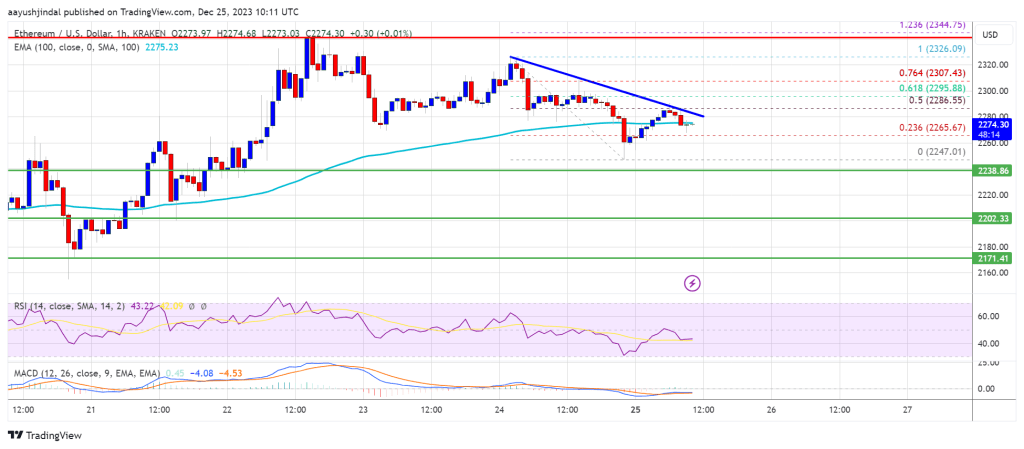
  • There is a key bearish trend line forming with resistance near $2,285 on the hourly chart of ETH/USD (data feed via Kraken).
  • The pair could attempt a fresh increase unless there is a close below $2,200.

Ethereum Price Remains Supported

Ethereum price failed again to gain pace for a move above the $2,350 level. ETH formed a short-term near $2,350 and recently started a downside correction, like Bitcoin.

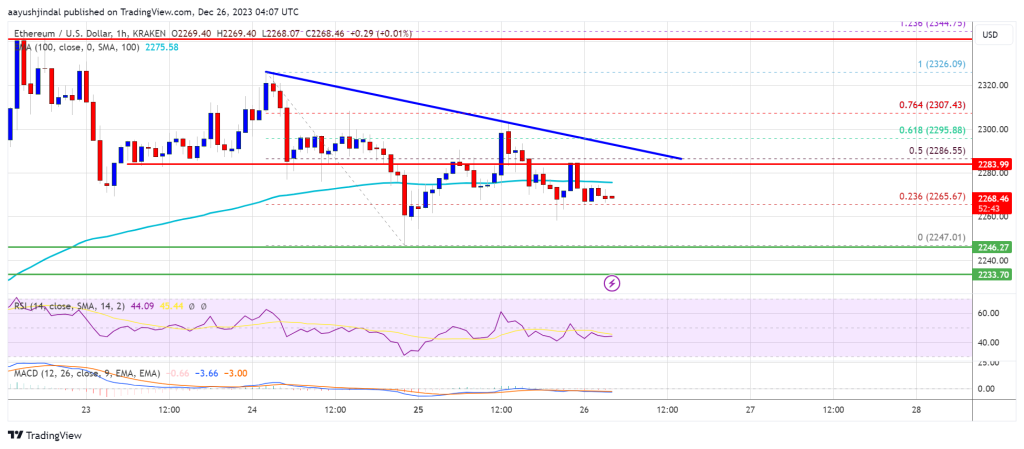
There was a move below the $2,320 and $2,300 levels. The price even spiked below $2,250. A low was formed near $2,247 and the price is now correcting higher. There was a move above the $2,265 level. The price climbed above the 23.6% Fib retracement level of the downward move from the $2,326 swing high to the $2,247 low.

Ethereum is now near $2,275 and the 100-hourly Simple Moving Average. On the upside, the price is facing resistance near the $2,285 level. There is also a key bearish trend line forming with resistance near $2,285 on the hourly chart of ETH/USD.

The trend line is close to the 50% Fib retracement level of the downward move from the $2,326 swing high to the $2,247 low. A close above the $2,285 resistance could send the price toward $2,350.

Ethereum Price

Source: ETHUSD on TradingView.com

A clear move above the $2,350 zone could start a major increase. The next resistance sits at $2,420. Any more gains could start a wave toward the $2,500 level, above which Ethereum might rally and test the $2,550 zone.

More Losses in ETH?

If Ethereum fails to clear the $2,285 resistance, it could continue to move down. Initial support on the downside is near the $2,220 level.

The first key support could be the $2,200 zone. A downside break and a close below $2,200 might send the price further lower. In the stated case, Ether could revisit the $2,170 support. Any more losses might send the price toward the $2,120 level in the coming sessions.

Technical Indicators

Hourly MACDThe MACD for ETH/USD is losing momentum in the bullish zone.

Hourly RSIThe RSI for ETH/USD is now below the 50 level.

Major Support Level – $2,200

Major Resistance Level – $2,285

Ethereum (ETH) Lags In Market Cap Growth Despite Positive Year – Details

According to a report from crypto analytics firm IntoTheBlock, Ethereum has recorded an 85% increase in its market cap over the last year, moving from around $149.18 billion to its current value of $275.98 billion. However, in comparison with other major assets, ETH performance still leaves more to desire, especially considering the many positive developments experienced by the asset in 2023.

Ethereum Underperforms

Ethereum (ETH) has been one of the major headliners in the crypto space in 2023. The second-largest cryptocurrency and the most prominent altcoin has continued to retain investor interest marked due to several factors. 

One of these factors is the Shanghai/Capella upgrade in April which has so far produced a significant increase in ETH staking activity as investors are now allowed to freely withdraw their assets from the Ethereum network.

Furthermore, Ethereum has also recorded an increase in institutional adoption amidst the launch of Ether Futures ETF in the US and a growing competition among several asset managers to gain approval for the first-ever spot Ether ETF. Nevertheless, these developments could only boost the altcoin market shares by 85%, which while impressive, is overshadowed by the performance of other cryptocurrencies. 

For context, Bitcoin, the market leader, recorded a 163% gain in market cap value, while other top coins, such as ADA and AVAX, also experienced gains to the tune of 145% and 341%, respectively. 

Trending meme token Bonk (BONK) produced the largest market cap increase of 1,574%, followed by Optimism (OP) with 916% and Solana (SOL) with 744%. Other notable mentions include Celestia (TIA) and Chainlink (LINK), with 459% and 199%, respectively. 

ETH Price Prediction 

At the time of writing, Ethereum trades around $2,292.13 with a 0.04% gain on the last day. Looking at the token’s daily chart, ETH is currently headed for the $2,400 resistance zone, which has proven effective in recent weeks.

Interestingly, price prediction site Coincodex reports that investor sentiment surrounding Ethereum is strongly bullish, with a Fear & Greed Index of 71. This indicates that many investors currently consider altcoin to be a favorable investment. 

However, if the $2400 resistance zone holds strong again, ETH could experience a price dip, finding support around the $2120 price region. And in the presence of overwhelming selling pressure, Ethereum could fall as low as $1,921.

Ethereum

Ethereum Price To Reach $5,000, BitMex Founder Predicts

BitMex founder Arthur Hayes has revealed that he is diverting his interest toward Ethereum (ETH) while disclosing a bold prediction for the crypto asset.

Arthur Hayes Doubling Down On Ethereum

Arthur Hayes recently took to X (formerly Twitter) to share his optimism and prediction about the future of Ethereum, and the post has since caused quite a stir in the entire cryptocurrency community.

Renowned for his perceptive market analysis, Hayes claimed to have had a revelation on ETH during one of his meditations, and this prompted him to significantly alter his cryptocurrency holdings. He sarcastically asserted in the X post to have gotten the direction from the Lord. 

Following this supposed heavenly direction, Hayes allegedly sold his Solana holdings and increased his stake in Ethereum. In addition, he has predicted a spike that would take the price of the cryptocurrency asset to an astounding $5,000.

He further conveyed his love and appreciation for Vitalik Buterin, the co-founder of Ethereum. Hayes called Vitalik an Archangel while doing so.

Hayes’ evaluation of the market dynamics might have played a role in his choice to divert from Solana to Ethereum. In another X post, Arthur Hayes shared a chart of Ethereum to back up his predictions. The crypto exchange founder has urged the crypto community to “get down” on the digital asset.

The BitMex founder’s projections come after his previous call, in which he predicted that Solana’s price would hit $100. Hayes’ prediction has appeared to be almost accurate, as the digital asset’s price has recently reached a peak of $99.

Since mid-December SOL has been demonstrating a rally, increasing by an astounding 350%. Despite the fact that Solana is displaying an upward trajectory, Hayes seems to think that Ethereum still has the potential to outperform SOL.

Glassnode Co-Founders Give Next Target For The Crypto Asset

Jan Happel and Yann Allemann, cofounders of Glassnode and collectively known on X as Negentropic, have highlighted the next target for Ethereum. According to the cofounders, the next target for ETH is $2,500 and has urged the community to keep an eye on this level.

Negentropic asserted that the asset reaching the $2,500 target will be triggered by market enthusiasm. Another target identified by the founders is $2,700, which ETH will attain by continuous ambitious push.

Ethereum

The co-founders also highlighted a support level at $2,100, which was once a resistance level but now a key zone. However, Negentropic pointed out that the level has now turned out to be critical for short-term rebounds. In addition, they asserted that if ETH ends up breaching the support level, it might activate the 50-Day EMA.

As of the time of writing, Ethereum is trading at $2,307, indicating a 1.30% increase in the past 24 hours. Its trading volume has increased by 19% to $16,690,793,321, its market capitalization has increased by 1.31% to $277,454,559,883.

Ethereum

Ethereum Price Reaches Key Juncture – Can Bulls Pump ETH To $2,500?

Ethereum price is still struggling to clear the $2,265 resistance while Bitcoin extended gains. ETH could rally if there is a close above $2,265 and then $2,320.

  • Ethereum is still struggling to gain pace for a move above the $2,265 resistance zone.
  • The price is trading above $2,220 and the 100-hourly Simple Moving Average.
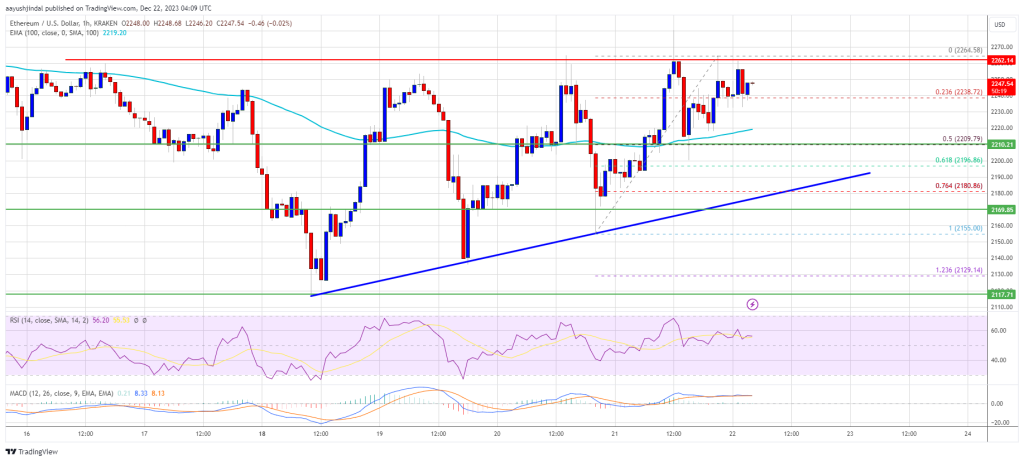
  • There is a key bullish trend line forming with support near $2,180 on the hourly chart of ETH/USD (data feed via Kraken).
  • The pair could start a strong increase if there is a close above $2,265 and $2,320.

Ethereum Price Aims Higher

Ethereum price managed to stay above the $2,200 support zone. The bulls protected a major downside break and pushed the price above the $2,220 level.

There was a push above the $2,250 level, but the bears are still active near the $2,265 resistance zone. A high was formed near $2,264 and the price is now consolidating gains near the 23.6% Fib retracement level of the recent increase from the $2,155 swing low to the $2,264 high.

Ethereum is now trading above $2,220 and the 100-hourly Simple Moving Average. There is also a key bullish trend line forming with support near $2,180 on the hourly chart of ETH/USD.

On the upside, the price is facing resistance near the $2,265 level. A close above the $2,265 barrier could start a decent increase. The next key resistance is near the $2,320 level. A clear move above the $2,320 zone could send the price toward the $2,400 level.

Ethereum Price

Source: ETHUSD on TradingView.com

The next resistance sits at $2,420. Any more gains could start a wave toward the $2,500 level, above which Ethereum might rally and test the $2,550 zone.

Another Rejection in ETH?

If Ethereum fails to clear the $2,265 resistance, it could start another decline. Initial support on the downside is near the $2,220 level and the 100 hourly SMA.

The first key support could be the $2,180 zone and the trend line. A downside break and a close below $2,180 might send the price further lower. In the stated case, Ether could revisit the $2,120 support. Any more losses might send the price toward the $2,000 level in the coming sessions.

Technical Indicators

Hourly MACDThe MACD for ETH/USD is losing momentum in the bullish zone.

Hourly RSIThe RSI for ETH/USD is now above the 50 level.

Major Support Level – $2,180

Major Resistance Level – $2,265

Is Ethereum (ETH) Ready For A Monster Move In January 2024?

In a recent post on X, Sassal, an independent Ethereum educator, is doubling down on Ethereum (ETH). The angel investor said that based on current market sentiment, there are signals that the “death of ETH” narrative is losing steam.

This is a reason, in Sassal’s view, to buy even more ETH ahead of the expected bull run.

Ethereum Bulls Confident, ETH Resistance At $2,400

With the bullish stance, the independent Ethereum educator appears to be convinced that Ethereum’s fundamentals are strong. More importantly, the analyst is confident that the network is well-positioned to capitalize on the growing demand for protocols, including those offering decentralized finance (defi) and non-fungible token minting services. 

Thus far, Ethereum, despite the relatively sluggish performance compared to meme coins like BONK or PEPE, remains the second most valuable network only behind Bitcoin.

From the candlestick arrangement in the daily chart, the coin is within a bullish formation. 

The coin rallied by nearly 60%, topping at December 2023 at around $2,400 before pulling back to spot rates. Even with the cool-off, buyers still have the upper hand. 

Ethereum price trending upward on the daily chart | Source: ETHUSDT on Binance, TradingView

When writing on December 12, ETH prices found support at the dynamic reaction line, the 20-day moving average. It is also trading above the $2,100 support line, marking July 2023 highs. Accordingly, it means the bullish breakout formation of early December 2023 is valid.

This move could anchor optimistic buyers targeting $3,000 and even 2021 highs of around $5,000 in the days ahead.

Network Is Upgrading: Will This Drive Prices Even Higher In January 2024?

The likelihood of trend continuation in 2024 also stems from plans by the platform’s developers to enhance performance and scalability. With Ethereum 2.0 on, developers have been working on layer-2 scaling options like Arbitrum and Optimism to relieve the mainnet.

However, going forward, on-chain scaling solutions like Sharding, where the network will be fragmented into units called “shards” that are interconnected, will be rolled out. 

Echoing Sassal’s sentiment, another commentator on the X post noted that December and January have historically been “monster months” for Ethereum in previous bull markets.

This suggests that even if Ethereum prices have not rallied by triple digits like some meme coins or even outperformed Solana (SOL), the coin could be poised for a significant price rally in the coming months.

Still, how ETH prices will evolve in the upcoming sessions remains to be seen. As it is, $2,500 remains to be a key reaction point that if broken could trigger more demand.

Neon EVM Hits Record-High 730 TPS On Mainnet

In the rapidly evolving landscape of blockchain technology, Neon EVM, a smart contract on Solana (SOL) has emerged as a frontrunner by introducing a landmark parallel processing architecture on its mainnet. 

This approach has enabled Neon EVM to achieve an increase in performance, scalability, and efficiency, according to a press release share with NewsBTC.

Neon EVM Dominates Transaction Processing 

Neon EVM, the first parallel Ethereum Virtual Machine (EVM) on mainnet, has achieved a record-breaking 730 Transactions Per Second (TPS) on its mainnet. Notably, this is the first time such high tps has been achieved on an EVM mainnet. 

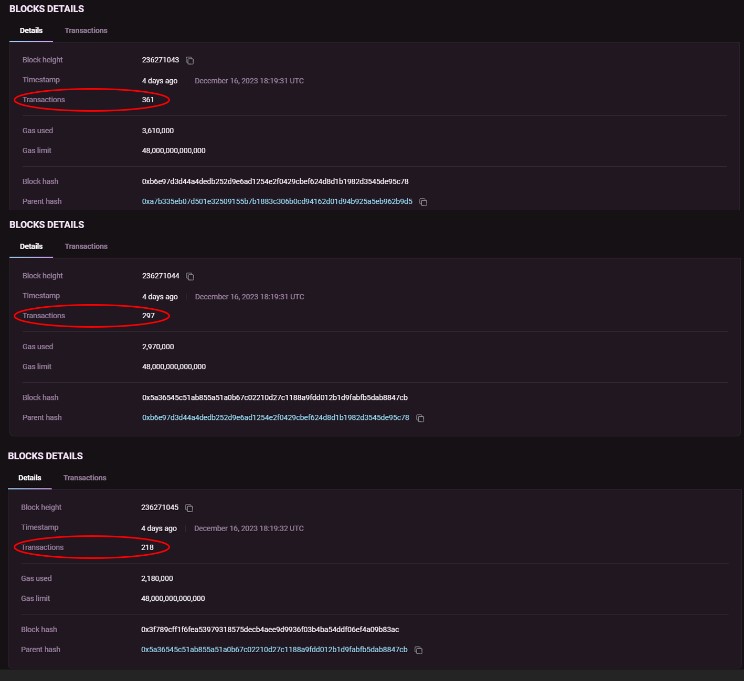
The milestone was reached on December 16, 2023, when Neon EVM’s mainnet showcased its transaction processing capabilities. While many blockchains demonstrate high tps on testnets, Neon EVM’s has standout by improving its scalability. 

Neon EVM

Neon EVM, which went live on the mainnet in July 2023, operates as a fully Ethereum-compatible environment on the Solana blockchain. Since its launch, Neon EVM has garnered investor interest, resulting in multiple listings on platforms such as ByBit, Crypto.com, and Gate.io. 

Given these developments, the utility token NEON has experienced remarkable growth, with its value surging from $0.67 to $1.45 in just three days, representing a 116% increase.

Neon EVM’s success comes when there is growing interest in high-speed, parallelized processing blockchains. Currently, Neon EVM stands as the only parallel processing EVM live on the mainnet, showcasing its tps capabilities compared to other blockchain networks.

Outshining Ethereum’s Transaction Speed

The fundamental difference between Neon EVM and blockchains like Bitcoin and Ethereum lies in their transaction processing approach. While Bitcoin and Ethereum process transactions sequentially, Neon EVM allows for simultaneous processing of multiple transactions, facilitating increased throughput and reducing the likelihood of congestion during periods of high demand.

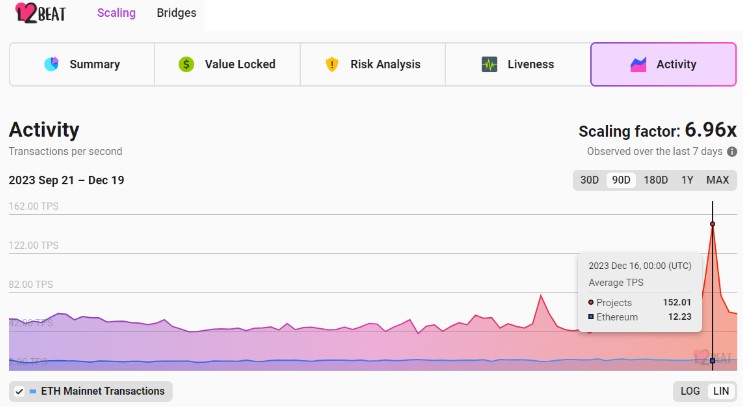
In a notable comparison, Neon EVM’s parallel processing architecture outperformed the combined tps of the entire Ethereum ecosystem on December 16, as reported by L2Beat

Neon EVM

The project’s commitment to Ethereum compatibility on the Solana blockchain and its high-speed transactions and low-cost benefits positions Neon EVM as an interesting project as a new Bull Cycle emerges.

Layer 2 Scaling Solutions On The Rise

Polygon, the layer 2 scaling solution that operates alongside the Ethereum blockchain, has also demonstrated its transaction processing speed capabilities. 

In a recent post on X (formerly Twitter), Sandeep Nailwal, the founder of Polygon, shared notable statistics highlighting the network’s performance. According to Nailwal’s post, Polygon’s Proof of Stake (PoS) chain seamlessly handled over 16 million transactions in a single day, showcasing its scalability and efficiency. 

During the peak period, the Polygon PoS chain achieved a throughput of 255 tps. This figure is approximately 2-3 times higher than the combined throughput of the entire Ethereum ecosystem. 

Moreover, the validators on the Polygon network generated approximately 1 million in transaction fees in a single day, reflecting the network’s high level of activity. However, it is worth noting that gas fees experienced a spike during this period, which is a broader issue impacting the entire Ethereum ecosystem.

In terms of rewards for validators, the block rewards on the Polygon network amounted to over 155,000 MATIC tokens. This translates to substantial revenue for validators, totaling around 1.2 million in a single day. These rewards incentivize validators and contribute to the overall security and stability of the PoS chain.

The spike in transactions in both of these Layer-2 networks showcase the growing importance of scalability solutions. In the coming months, hundred of new users could onboard the crypto market via either of these solutions hinting at a potential benefit for their underlying tokens.

Neon EVM

Featured image from Shutterstock, chart from TradingView.com