Data from L2Beat shows that layer 2s are seeing greater adoption than ever before as users continue to desire lower gas fees.
Cryptocurrency Financial News
Data from L2Beat shows that layer 2s are seeing greater adoption than ever before as users continue to desire lower gas fees.
An analyst has explained how a pattern forming in the 3-day Ethereum chart could signal that a decline toward $1,700 may be coming.
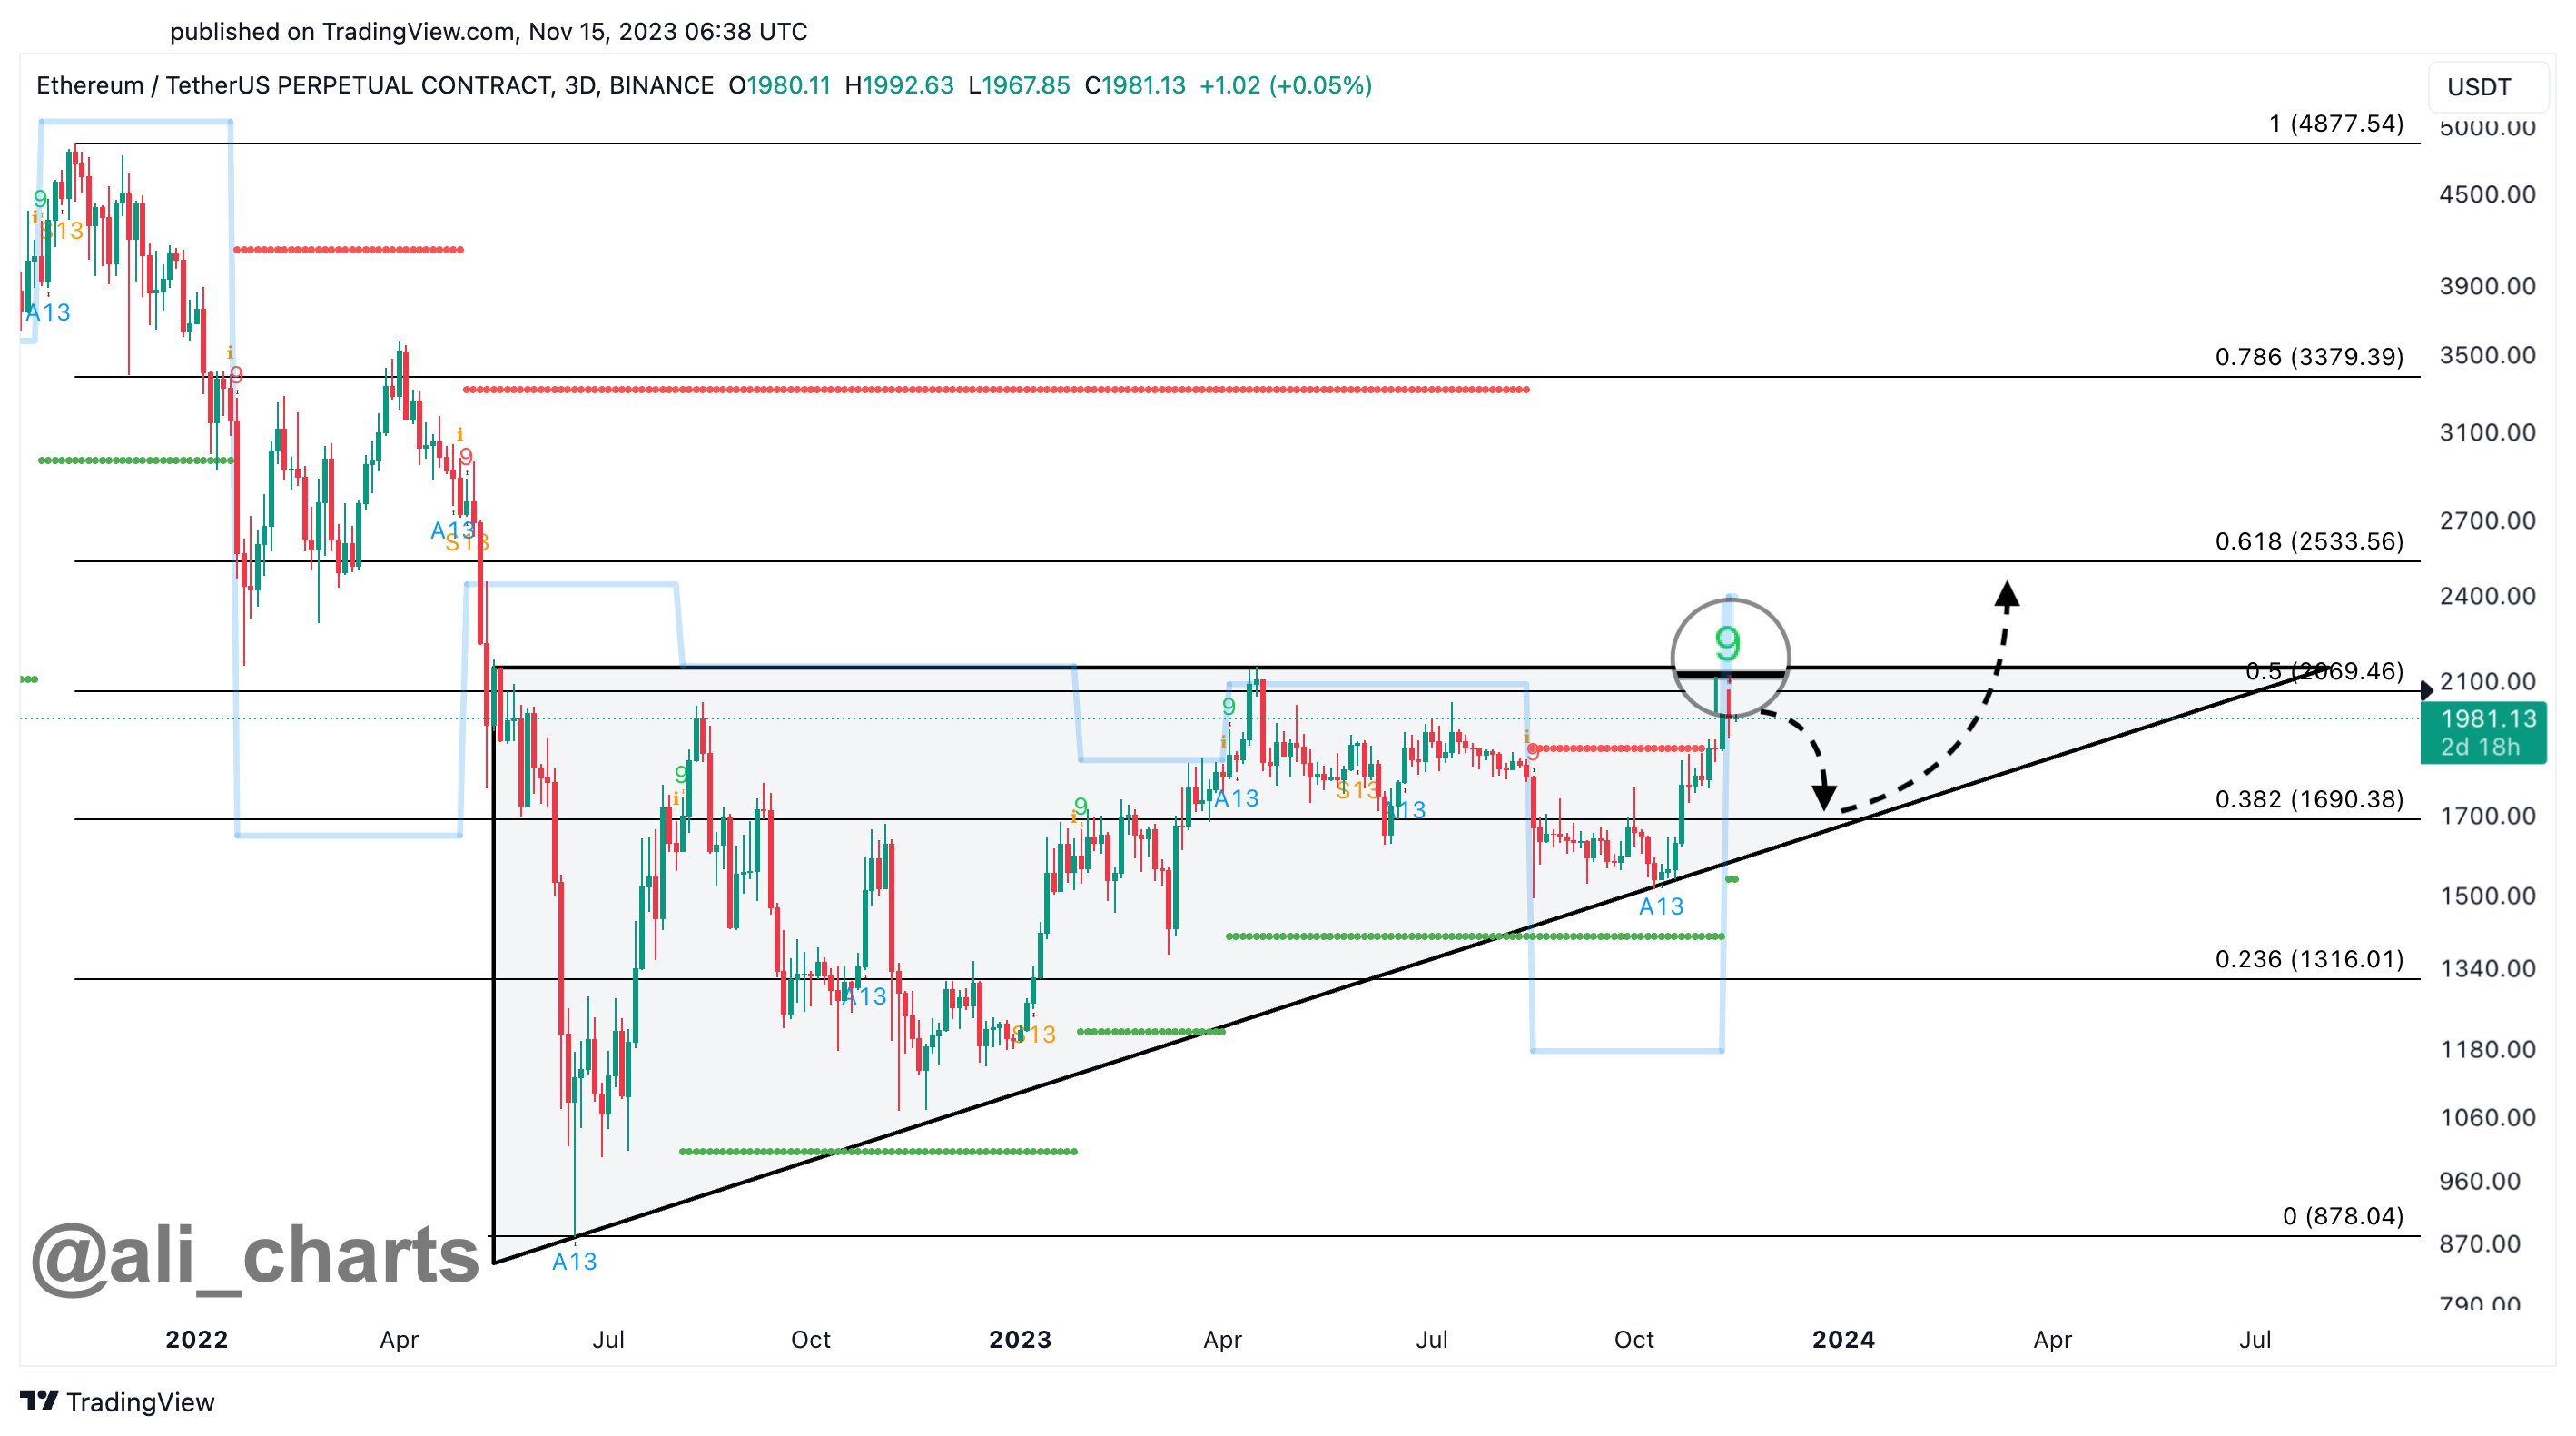
In a new post on X, analyst Ali talked about a sell signal that has taken shape in the ETH 3-day chart. The relevant technical indicator here is the “Tom Demark (TD) Sequential,” which is used to spot reversals in the price of any asset.
The metric is made up of two phases; a setup phase and a countdown phase. In the former, candles of the same polarity are counted up to nine following a reversal in the price. Once the ninth candle is hit, the indicator signals a probable top or bottom for the asset (depending on whether the trend until now was towards up or down).
Once the setup is completed, the 13-candle-long countdown phase begins. At the end of these 13 candles, a potential reversal once again takes place for the asset.
Ethereum has registered a sharp rally recently, but according to the analyst, the cryptocurrency has now finished with the setup phase of the indicator, implying that the asset could be heading towards a period of downtrend.
The below chart shows this pattern in the 3-day price of the coin:
In the same chart, the analyst has drawn an ascending triangle pattern for Ethereum. “Ascending triangles” are made up of two lines: one parallel to the x-axis drawn through the highs in the price, while the other is made by connecting higher lows.
Generally, the price feels resistance at the upper line and support at the lower one. A break out of either of these lines suggests a continuation of the trend: bullish in the case of a surge above the former, while bearish in the case of the latter.
From the graph, it’s visible that Ethereum has recently been retesting the $2,000 to $2,150 zone, which happens to align with the resistance level of this ascending triangle.
Thus, it’s interesting that the ETH TD Sequential setup phase has finished just as the coin has encountered this line that it has been rejected from in the past.
“A pullback from this resistance level could lead to a dip toward the triangle’s hypotenuse at $1,700, setting the stage for a potential uptrend continuation,” explains Ali.
The analyst also notes, however, that the $2,150 level could be one to keep an eye on as if the asset can see a 3-day candlestick close above this level in the coming days, the bearish outlook could be nullified.
Ethereum had risen above $2,100 recently, but the coin has seen some pullback in the past day, a potential sign that the sell signal may already be in effect.
Intent-centric programs are quietly transforming how we operate on blockchains, but they bring risks as well as benefits.
The price of Ethereum (ETH) exhibited superior performance compared to Bitcoin (BTC) in the previous week, mostly because of the registration of Blackrock’s Spot ETF, which instilled optimism that ETH will surpass its previous peak in 2023 and exceed $2,500.
In a groundbreaking twist since the Ethereum (ETH) Shanghai upgrade earlier this year, the value of Ether has triumphantly surpassed the $2,000 milestone, propelled by the recent surge in Bitcoin (BTC) towards the $38,000 mark.
At the time of writing, ETH was trading at $2,054, up 7% in the last seven days, data from CoinMarketCap shows.

Despite the lingering uncertainty, cryptocurrency aficionados exude optimism, envisioning forthcoming profits as certain investors, driven by impatience, eagerly await the unfolding market dynamics.
Cryptocurrency on-chain data analysis firm Lookonchain unveils a spectacle of whale activity amidst the surge in Ethereum prices. The report highlights notable transactions, with one whale raking in a staggering $154 million profit, while another faces a substantial loss of $183 million.
Bullish or Bearish on $ETH?
Did SmartMoneys and Whales buy or sell $ETH over the past week?
1/
Here is a thread. pic.twitter.com/8yvCO0UI9H
— Lookonchain (@lookonchain) November 14, 2023
Within the thread, Lookonchain zoomed its lens on the whale using the “0xee47” address, showcasing a remarkable uptick in their Ethereum holdings by 3,200 ETH, equivalent to an impressive $6.7 million. The buildup signifies a significant advancement subsequent to the whale’s debut venture into ETH buys on July 5, 2022.
Currently, their portfolio consists of a significant amount of 183,740 ETH, which is estimated to be worth nearly $388 million. This indicates an unrealized profit of approximately $155 million.
Last week, the price of Ethereum experienced a significant increase, surpassing the $2,000 mark. This spike was attributed to the confirmation by BlackRock, a prominent investment management company, regarding their intentions to introduce an Ethereum Spot Exchange-Traded Fund (ETF).
This confirmation was made through a filing with the NASDAQ. According to on-chain data, a group of financially astute institutional investors engaged in significant purchases of Ether over the weekend, amounting to millions of dollars. This activity is likely a response to a positive news event that has generated optimism in the market.

The latest on-chain data supported the positive outlook for ETH. In particular whale transactions valued over a million dollars surged to their highest levels in seven months, as shown in the chart above.
Also, it was clear that the number of exchange names had grown. This supported earlier claims that whales were moving their hoards to make money.
(This site’s content should not be construed as investment advice. Investing involves risk. When you invest, your capital is subject to risk).
Featured image from Rhys A. via Flickr
The Kinto network, built with the Optimism’s OP Stack, features native know-your-customer (KYC) checks and investor accreditation mechanism to help onboard regulated financial institutions.
Ethereum price started a downside correction and traded below $2,000. ETH must stay above $1,920 to start a fresh increase in the near term.
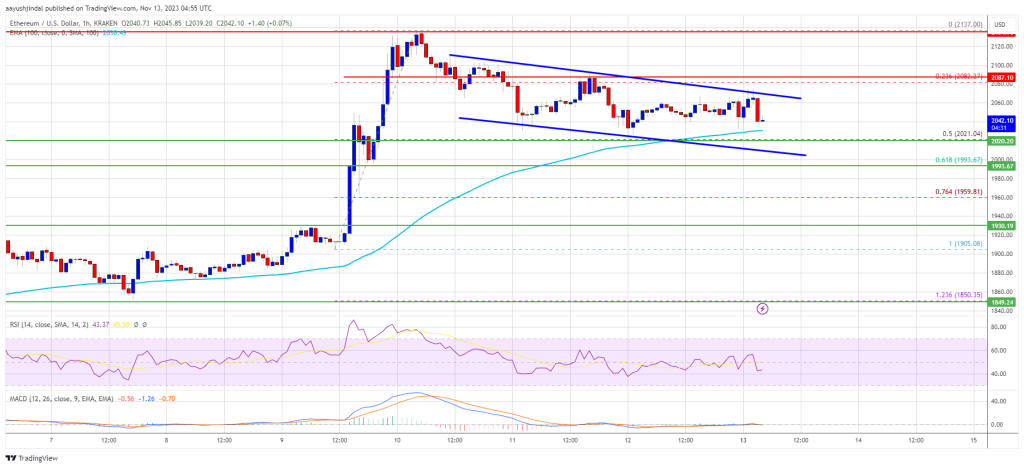
After struggling to clear the $2,120 resistance, Ethereum price started a downside correction like Bitcoin. ETH traded below the $2,050 and $2,000 support levels.
However, the bulls were active above the $1,920 support zone. A low was formed near $1,933 and the price is now consolidating losses. It is trading near the 23.6% Fib retracement level of the recent drop from the $2,118 swing high to the $1,933 low.
Ethereum is now trading below $2,000 and the 100-hourly Simple Moving Average. Immediate resistance is near the $2,000 zone. There is also a key bearish trend line forming with resistance near $2,000 on the hourly chart of ETH/USD.
The next major resistance sits at $2,025 or the 100-hourly Simple Moving Average or the 50% Fib retracement level of the recent drop from the $2,118 swing high to the $1,933 low. A close above the trend line and $2,025 could start a decent increase.
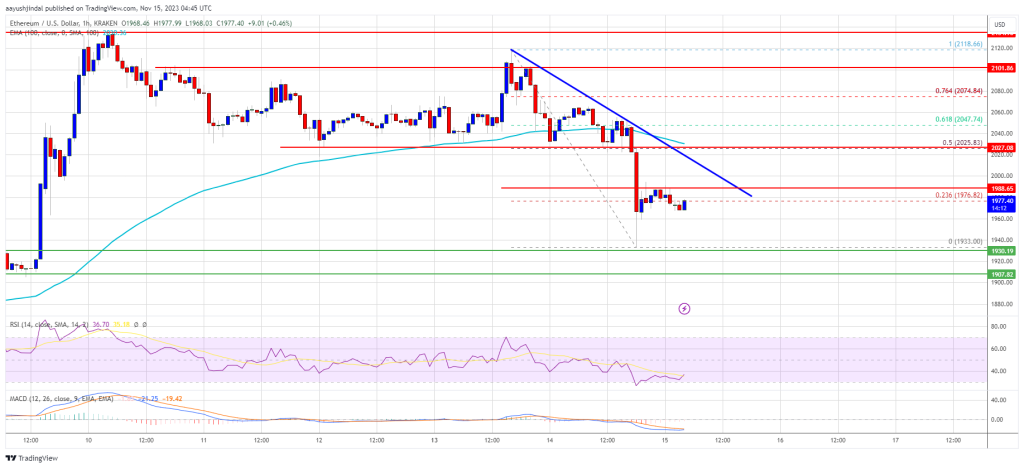
Source: ETHUSD on TradingView.com
The next key resistance is near $2,075, above which the price could aim for a move toward the $2,120 barrier. Any more gains could start a wave toward the $2,250 level.
If Ethereum fails to clear the $2,000 resistance and the trend line, it could start a fresh decline. Initial support on the downside is near the $1,950 level.
The next key support is $1,920. A downside break below the $1,920 support might start a sharp decline. In the stated case, Ether could drop toward the $1,850 support zone in the near term. Any more losses might call for a drop toward the $1,800 level.
Technical Indicators
Hourly MACD – The MACD for ETH/USD is losing momentum in the bearish zone.
Hourly RSI – The RSI for ETH/USD is now below the 50 level.
Major Support Level – $1,920
Major Resistance Level – $2,025

The “X1” network will be part of the Polygon ecosystem and use zero-knowledge proofs to bridge assets from Ethereum.
OMG, the native token of the OMG Network, surged 16% to a six-month high of $0.77 after Ethereum creator Vitalik Buterin published a blog post on how Plasma, the technology the network is based on, has the potential to reduce transaction fees and improve security.
Decentralized exchange dYdX will be the a user of CCTP, as the project expands beyond Arbitrum, Base, Ethereum and Optimism.
BlackRock and NASDAQ have outlined why the SEC needs to approve the investment company’s new spot Ethereum exchange-traded fund (ETF) filing. According to the filing with the SEC, approval of a Spot ETH ETP would represent a major win for the protection of U.S. investors in the crypto asset space.
If approved, the iShares Ethereum Trust would allow regular investors to trade Ether, the world’s second-largest cryptocurrency by market cap, as easily as stocks can be traded.
BlackRock, the world’s largest asset manager, recently applied to the SEC to launch an Ethereum exchange-traded fund (ETF) linked to the spot price of Ethereum. BlackRock wasn’t the first investment company to make this type of application, as hedge fund Ark Invest already filed for a Spot Ethereum ETF in September. However, the news of BlackRock’s filing sent Ethereum surging more than 11% in less than 24 hours. As a result, ETH broke over the strong $2,000 resistance level for the first time in seven months.
BlackRock’s Spot ETF is called the “iShares Ethereum Trust” and is sponsored by Ishares Delaware Trust Sponsor LLC, a subsidiary of Blackrock Inc. Coinbase, the largest crypto exchange in the US, acts as the custodian for the Trust’s ether holdings, which are to be traded on the NASDAQ exchange.
In its SEC filing, NASDAQ asked for a proposed rule change in order for it to list and trade shares of the ETF. According to the filing, US investors, for the most part, have lacked a US-regulated way to gain exposure to Ethereum investments. It also argues that most of the current methods are risky and subject to high trading fees and volatile discounts.
For example, an investor who purchased the largest OTC ETH Fund in January 2021 and held the position at the end of 2022 would have had a 30% loss due to the change in the premium/discount, even if the price of ETH did not change. However, a spot ETH ETP like the proposed iShares Ethereum Trust ETF would better protect investors against the risk of losses through fraud and high premiums.
“To this point, approval of a Spot ETH ETP would represent a major win for the protection of U.S. investors in the cryptoasset space,” the filing said.
Despite spot crypto ETFs being available in other countries, including Germany, France, and Canada, the SEC has been hesitant to greenlight a crypto ETF in the US, and 12 Bitcoin spot ETFs are currently waiting for approval.
A US Spot Ethereum ETF would significantly boost interest and confidence in Ethereum and ultimately drive the asset to new highs. The hype leading up to the approval may also push the asset to a new yearly high.
ETH is up by more than 60% this year and has outperformed BTC in the past few days. It is currently trading at $2,060 and analysts believe a bullish cross over $2,150 would signal the end of the bear market for ETH.
Ethereum price is struggling to gain strength above $2,100. ETH is consolidating above $2,000 and might start a fresh surge if it clears $2,100.
After forming a base, Ethereum price made another attempt to clear the $2,100 resistance. However, ETH failed to gain bullish momentum and trimmed all gains, like Bitcoin.
There was a move below the $2,050 level and the price spiked below the 100-hourly Simple Moving Average. However, the bulls were active above the $2,030 level. A low is formed near $2,031 and the price is now moving higher.
Ethereum is now trading above $2,040 and the 100-hourly Simple Moving Average. On the upside, the price is facing resistance near the $2,075 level or the 50% Fib retracement level of the recent decline from the $2,118 swing high to the $2,031 low.
The next major resistance sits at $2,100. There is also a connecting bearish trend line forming with resistance near $2,090 on the hourly chart of ETH/USD.
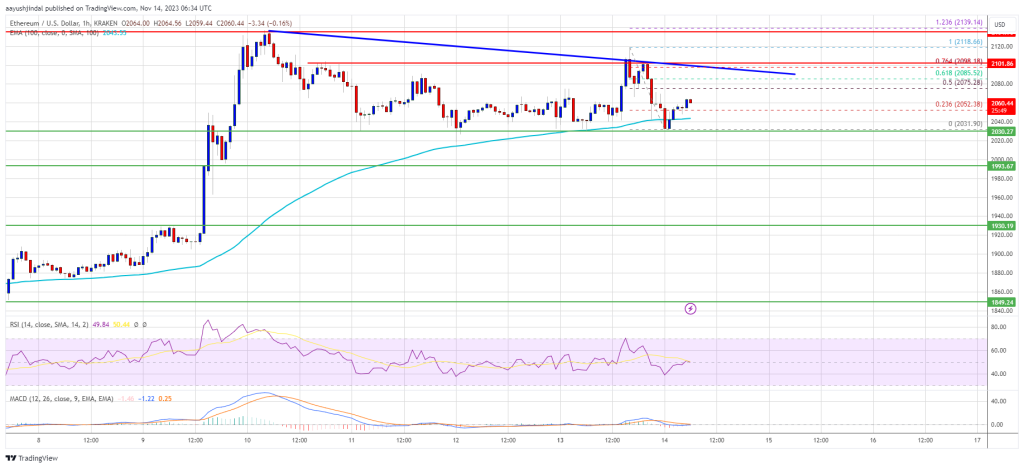
Source: ETHUSD on TradingView.com
A close above the trend line and $2,100 could send the price further higher toward the $2,150 zone. The next key resistance is near $2,220, above which the price could aim for a move toward the $2,300 level. Any more gains could start a wave toward the $2,450 level.
If Ethereum fails to clear the $2,100 resistance, it could start a fresh decline. Initial support on the downside is near the $2,030 level and the 100-hourly Simple Moving Average.
The next key support is $2,000. A downside break below the $2,000 support might start a sharp decline. In the stated case, Ether could drop toward the $1,930 support zone in the near term. Any more losses might call for a drop toward the $1,850 level.
Technical Indicators
Hourly MACD – The MACD for ETH/USD is losing momentum in the bearish zone.
Hourly RSI – The RSI for ETH/USD is now below the 50 level.
Major Support Level – $2,000
Major Resistance Level – $2,100
Ethereum (ETH), the second-largest cryptocurrency, has seen a significant price increase over the past month. The recent bullish rush in the crypto market, coupled with BlackRock’s involvement, has pushed ETH to its year-to-date high of $2,139.
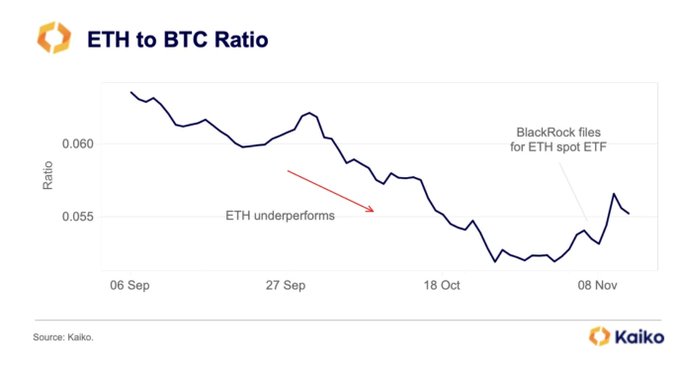
According to market data provider Kaiko, ETH has outperformed BTC and many altcoins in recent weeks, signaling a shift in market dynamics.
Kaiko’s report highlights how ETH struggled to gain momentum over the past year, despite successful upgrades such as The Merge in April.
However, the sentiment around ETH changed dramatically when BlackRock filed for a spot ETH exchange-traded fund (ETF), leading to a reversal in the ETH to Bitcoin (BTC) ratio.
The impact on the market was substantial, with ETH prices surging above $2,000 for the first time since April. Additionally, daily spot trade volumes reached $7 billion, the highest level since the collapse of FTX.
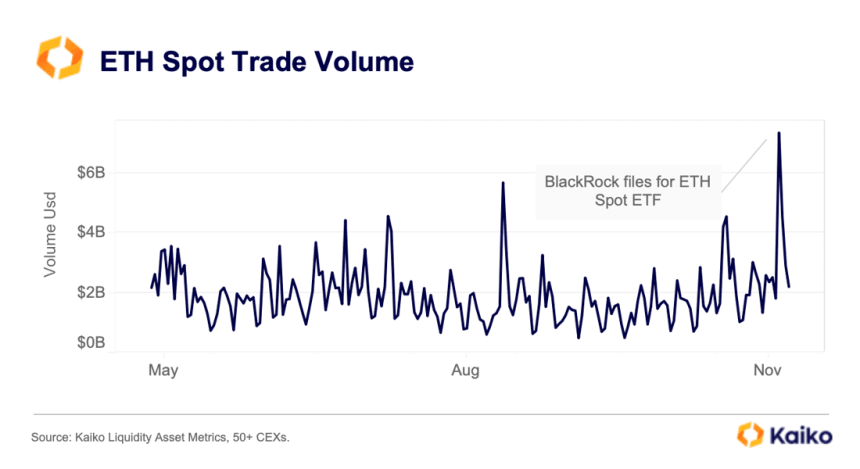
The ETH ETF narrative provided further impetus to the ongoing rally, amplified by improved global risk sentiment and declining US Treasury yields.
The dominance of altcoin + ETH volume relative to BTC has risen to 60%, marking its highest level in over a year. During bull rallies, altcoin volume typically increases relative to BTC.
This surge in demand has also led to rising leverage, as reflected in the recovery of ETH open interest to early August levels. Notably, BTC open interest has declined over the past month due to liquidations on Binance, resulting in the Chicago Mercantile Exchange (CME) outpacing Binance as the largest BTC futures market.
Furthermore, ETH funding rates, a gauge of sentiment and bullish demand, have reached their highest levels in over a year, indicating a significant shift in sentiment. In November, both BTC and ETH 30-day volatility rose to 40% and 50% respectively, following a multi-year low of around 15% during the summer months.
Renowned crypto expert Michael Van de Poppe believes that ETH is on the cusp of a significant breakthrough. According to Van de Poppe, if Ethereum manages to surpass the crucial $2,150 resistance level, it could signify the end of the bear market.
Drawing a parallel with Bitcoin’s critical $30,000 barrier, Van de Poppe suggests that breaching this level could pave the way for a substantial rally, potentially propelling Ethereum towards the price range of $3,100 to $3,600.
However, Ethereum has yet to touch the $2,150 resistance line, as it faces a pre-existing obstacle in the form of its yearly high of $2,139. This pivotal level has halted the cryptocurrency’s bullish momentum, acting as a formidable resistance.
As a result, Ethereum has been consolidating within a narrow range between $2,050 and $2,100 for the past three days.
The forthcoming days will reveal whether Ethereum can overcome its immediate resistance levels and establish a consolidated position above them. Alternatively, it may face a fate similar to Bitcoin, which failed to surpass the $31,000 level for over seven months before reaching its current trading price of $36,000.
Featured image from Shutterstock, chart from TradingView.com
Ethereum prices are firm at spot rates, still trading above the $2,000 level, and multiple other factors point to possible trend continuation.
According to Kaiko’s data on November 12, not only is the ETH-BTC ratio shifting and reversing after extended periods of lower lows, but also there is a notable uptick in trading volume with funding rates in crypto derivative platforms shifting from negative to positive, suggesting increasing demand.
As of writing on November 13, Ethereum is relatively firm and changing hands at around the $2,090 level. Despite the expected contraction in trading volume over the past couple of days following the rally on November 9, the uptrend remains in place.
So far, the immediate support level technical analysts are watching remain at $2,000, marking July 2023 highs. Conversely, the $2,100 zone, marking the April high, is a critical liquidation level that optimistic bulls must break for a buy trend continuation pattern.
As it is, traders are optimistic. However, whether the uptrend will continue depends primarily on trader sentiment and if existing fundamental factors might spark more demand, lifting ETH to new 2023 highs. Thus far, even though the general ETH support base remains upbeat, the coin, unlike Bitcoin (BTC), is struggling to break key resistance levels recorded in H1 2023, which is a concern.
On the positive side, looking at the ETHBTC candlestick arrangement in the daily chart, the sharp reversal of ETH fortunes on November 9 could anchor the next leg up, signaling a new shift in a trend that favors Ethereum buyers. Looking at the ETHBTC formation, Bitcoin bulls have had the upper hand in 2023.
Related Reading: XRP Price Path To $1: Exploring Two Potential Outcomes From The $0.66 Resistance Level
To quantify, BTC is up 33% versus ETH, with the climactic sell-off of October 23 pushing BTC to the highest point against the second most valuable coin in 2023. However, the sharp recovery on November 9 and the subsequent failure of BTC bulls to reverse losses suggest that ETH has the upper hand.
Thus far, ETHBTC prices are trending inside the November 9 bullish engulfing bar at the back of light trading volumes, a net positive for bullish ETH holders.
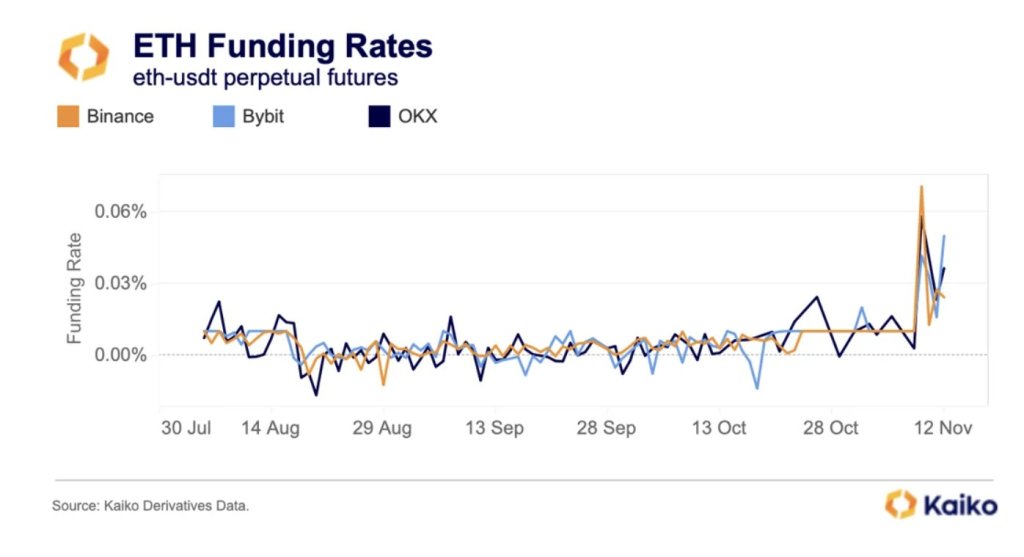
Following this surge, Kaiko notes that the funding rate of the ETHUSDT pair is positive, signaling increasing demand in the crypto derivatives scene. When funding rates turn positive from negative, it means “long” traders are paying “short” traders to keep their positions open. This development indicates that more traders are long ETH, expecting prices to rise in the sessions ahead.
All Aave v2 markets are now operational, the team behind the non-custodial liquidity protocol announced in a November 13 post on X. This a day after v3 markets were unfrozen following the approval from the community.
Aave is a platform where users can supply liquidity in exchange for rewards while borrowers are free to take loans while paying interest in a trustless environment.
In the post, Aave said the security of the decentralized finance (DeFi) protocol remains a “priority and is non-negotiable for the community.”
On November 4, Aave said they received a report “of an issue on a certain feature.” After being validated, the protocol decided to take a step and pause the operation of their v2 markets on Ethereum. At the same time, some v2 markets on Avalanche were frozen. Even so, the v2 markets on Polygon were unaffected.
Aave also froze operations on Aave v3 on Polygon, Arbitrum, and OP Mainnet. However, v3 markets on Ethereum, Base, and Metis were unaffected.
While Aave v2 and v3 markets were frozen, the protocol clarified that users supplying or borrowing affected assets could still withdraw and repay their positions but couldn’t supply or borrow more. With those markets unfrozen, they can now continue as it was before.
The resumption of services, looking at the AAVE candlestick arrangements in the daily chart, has not impacted prices. However, the token is trading at around 2023 highs and remains within a bullish formation as optimistic traders expect the uptrend to continue.
Despite the uptrend, bulls have failed to break above the $110 resistance level. As it is, this reaction level marks August 2022 highs and has not been breached in the past 15 months.
The token has more than doubled at spot rates, rising from $50, a critical support level marking January and June 2023 lows. For trend continuation, there must be a solid breakout above $110 and the $60 range from where prices have been moving horizontally in a multi-month accumulation.
Still, it is unclear how the token will react in the days ahead and whether there will be more upside momentum as liquidity increases as activity resumes on Aave v2 markets.
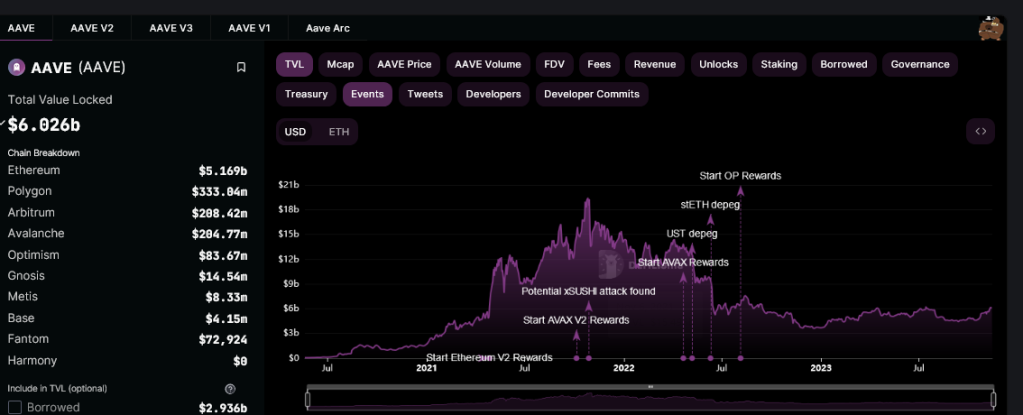
According to DeFiLlama data, Aave is one of the largest DeFi protocols, with over $6 billion in total value locked (TVL). Most of these assets are locked in Ethereum, where over $5.1 billion of tokens are under management.

Despite an 11.3% correction in just two days, SOL maintains a robust position with healthy derivatives markets and on-chain metrics.

Bitcoin opened the week with a shallow correction, but altcoin traders seem unaffected by the slight BTC price pullback.
Wyatt, who previously served as president at Polygon Labs and had a stint at YouTube, joins as chief growth officer, where he will be in charge of helping developers build across Optimism’s ecosystem of blockchains.

Bitcoin and altcoins are beneficiaries of major inflows this year, while the question of a BTC supply squeeze remains.
In his latest essay, Arthur Hayes, the co-founder of BitMEX, has laid out his investment playbook in the current global economic landscape, focusing on the potential of Bitcoin, cryptocurrencies, big tech, and traditional financial markets.
Hayes begins with a blunt critique of traditional investment strategies, particularly the purchase of long-term bonds in the current economic climate. He explicitly states, “The dumbest thing one can do is purchase long-term bonds with a buy-and-hold mentality.”
Hayes explains this viewpoint by highlighting the risks associated with these bonds, especially when liquidity conditions shift, saying, “You will experience a market-to-market gain today, but…the market will start to discount the impact of further Reverse Repo [RRP] balance decreases and long-end bond yields will creep higher, which means prices fall.”
Moving on to smarter investment approaches, Hayes acknowledges leveraging short-term debt, as exemplified by Stan Druckenmiller. Hayes notes that Stan Druckenmiller went mega-long 2-year treasuries. He remarked, “Great trade, brah! Not everyone has the stomach for the best expressions of this trade (hint: it’s crypto). Therefore, if all you can trade are manipulated TradFi assets like government bonds and stocks, then this isn’t a bad option.”
Hayes also argues that a trade “that’s a bit better than the medium-smart trade (but still not the smartest) is to go long on big tech.” Hayes focuses on AI-related companies. He identifies AI as a pivotal future technology, arguing, “Everyone knows that everyone knows that AI is the future. This means anything AI-related will pump, because everyone is buying it too. Tech stocks are long-duration assets and will benefit from cash being trash once more.”
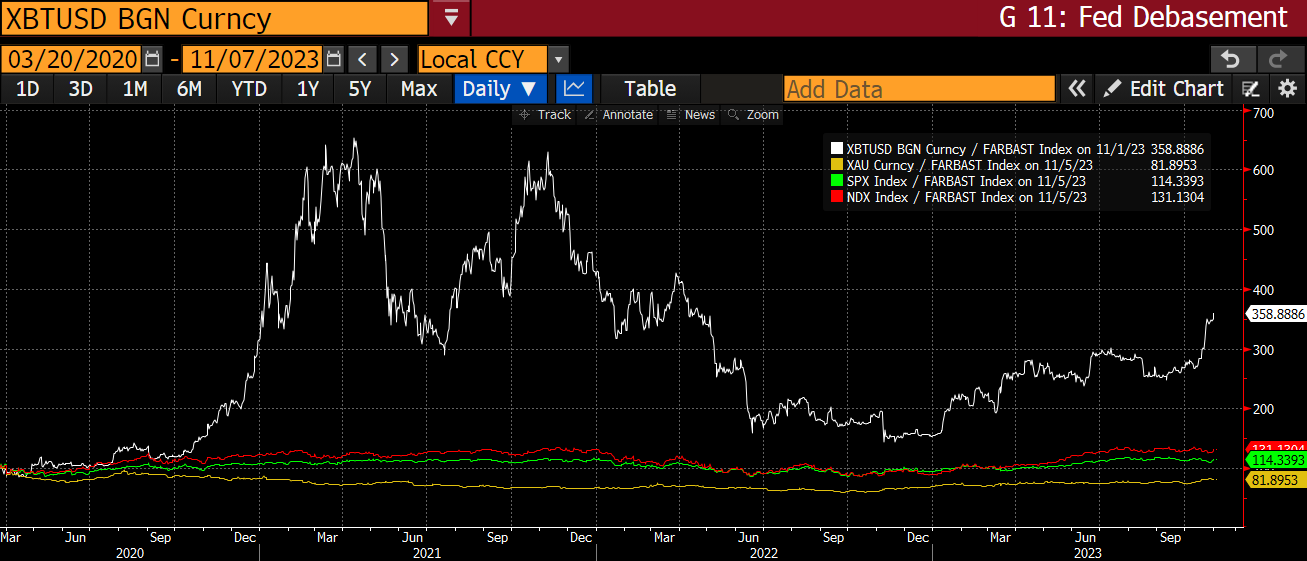
However, the smartest trade is to go long crypto, which has significantly outperformed other assets relative to the increase in central bank balance sheets. Hayes presented the chart below, comparing the performance of Bitcoin, Nasdaq 100, S&P 500, and Gold against the Fed’s balance sheet since March 2020, highlighting Bitcoin’s exceptional growth.
Hayes identifies Bitcoin as the primary investment target, describing it as “money and only money.” Following Bitcoin, he points to Ether as the commodity powering the Ethereum network. “Ether is the commodity that powers the Ethereum network, which is the best internet computer.”
He categorizes other cryptocurrencies, stating, “Bitcoin and Ether are crypto’s reserve assets. Everything else is a shitcoin.” He further elaborates on alternative layer-one blockchains like Solana, calling them “all overhyped, me-too, pieces of shit that won’t overtake Ethereum in terms of active developers, dApp activity, or Total Value Locked.”
Hayes also discusses decentralized applications (dApps) and their tokens. He finds this sector exciting for its high-return potential, though he acknowledges the risks: “Finally, all manner of dApps and their respective tokens will pump. This is the most fun, because down here is where you get the 10,000x returns. Of course, you’re also more likely to get rugged, but where there is no risk there is no return. I love shitcoins, so don’t ever call me a maxi!”
Regarding his investment strategy in the context of current economic fluctuations, Hayes explains his focus on the net of RRP minus Treasury General Account (TGA) to gauge market liquidity, which informs his decisions on T-bill sales and Bitcoin purchases. He emphasizes the importance of adaptability, stating, “I will stay nimble and flexible. The best-laid plans of mice and men have a tendency to falter.”
Hayes also delves into geopolitical considerations, specifically the potential impact of the Hamas v. Israel conflict on oil prices and monetary policy. He notes Bitcoin’s resilience in such scenarios: “Bitcoin has proven to outperform bonds during times of war. […] The long-term US Treasury bond ETF has fallen 12% vs. Bitcoin pumping 52% since the onset of the Ukraine / Russia war.”
While he concedes that Bitcoin could fall in an initial move when Iran is drawn into the Hamas v. Israel war, it would be a “buy the dip” situation according to Hayes.
In a candid conclusion, Hayes comments on the historical context of geopolitical conflicts, expressing skepticism about the prospects for global peace: “Of course, if those in charge of Pax Americana committed themselves to peace and global harmony… nah, I’m not even going to finish that thought. These mofos have been practicing war since 1776, with no signs of letting up.”
According to Hayes, however, all roads lead to Bitcoin: “[It] will reassert itself as a real-time scorecard on the health of the war-time fiat financial system.”
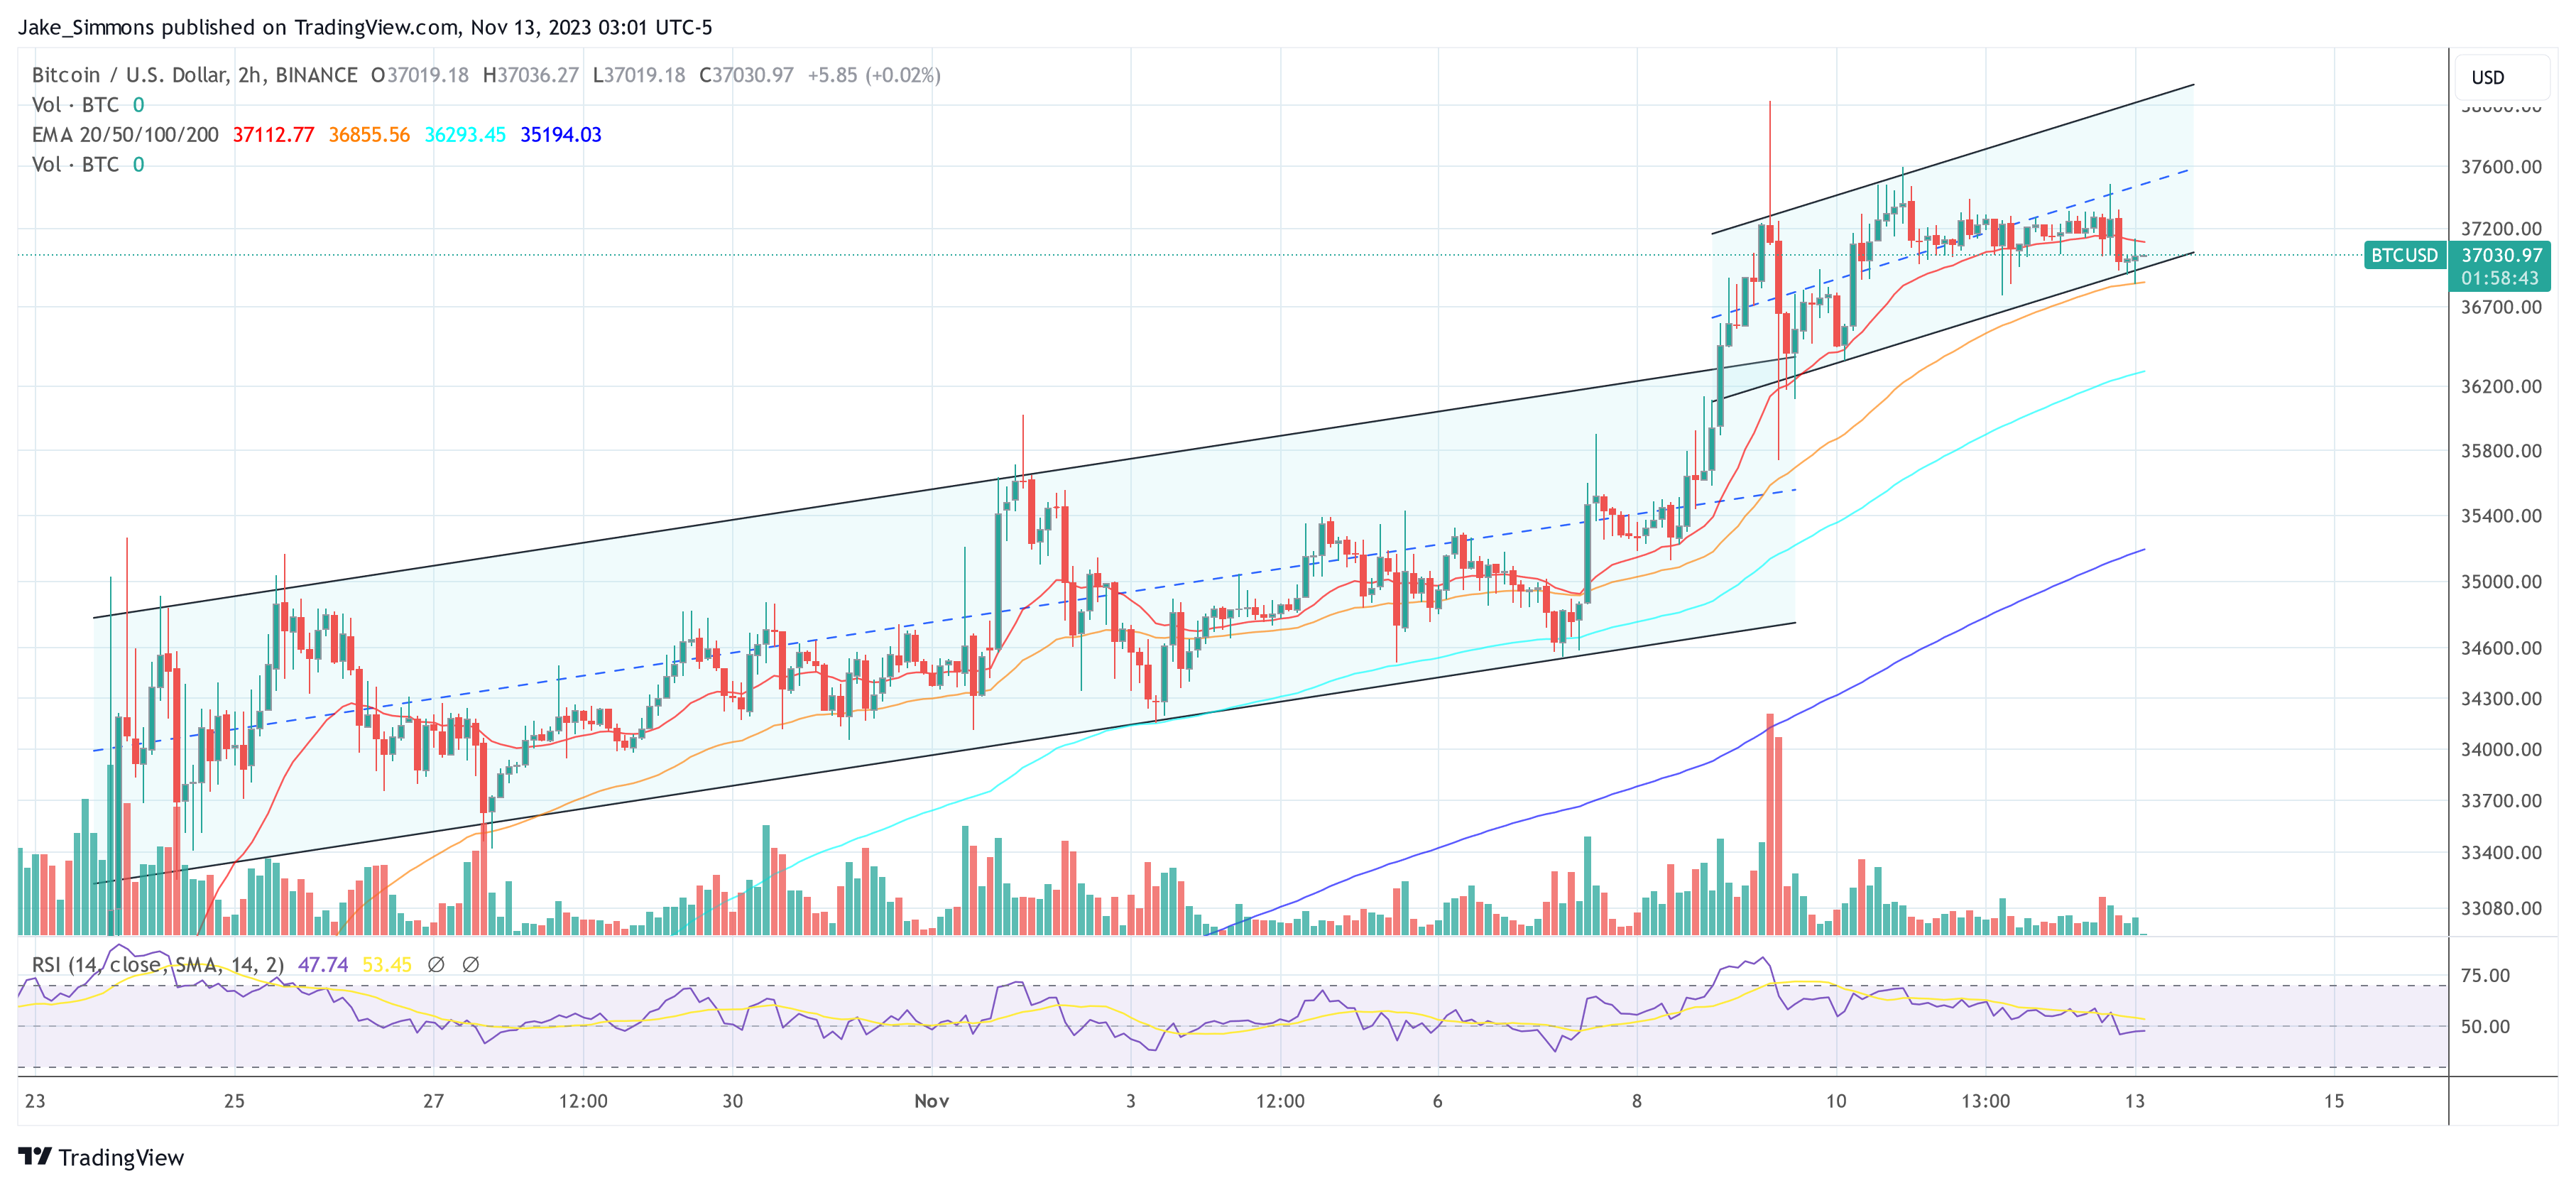
At press time, BTC traded at $37,030.
Ethereum price rallied steadily and surpassed the $2,000 resistance. ETH is consolidating above $2,000 and might start a fresh increase toward $2,120.
This past week, we saw a strong increase in Ethereum above the $2,000 level. ETH outperformed Bitcoin and cleared many hurdles near the $2,050 level.
It traded to a new multi-week high at $2,137 before there was a downside correction. The price declined below the $2,080 level. There was a move below the 23.6% Fib retracement level of the upward move from the $1,906 swing low to the $2,137 high.
Ethereum is still trading above $2,020 and the 100-hourly Simple Moving Average. There is also a key declining channel forming with support near $2,000 on the hourly chart of ETH/USD.
Source: ETHUSD on TradingView.com
On the upside, the price is facing resistance near the $2,060 level and the channel region. The next major resistance sits at $2,085, above which the price could accelerate higher. In the stated case, the price could rally toward the $2,120 resistance. The next key resistance is near $2,150, above which the price could aim for a move toward the $2,200 level.
If Ethereum fails to clear the $2,085 resistance, it could continue to move down. Initial support on the downside is near the $2,025 level and the 100-hourly Simple Moving Average. It is close to the 50% Fib retracement level of the upward move from the $1,906 swing low to the $2,137 high.
The next key support is $2,000 and the channel zone. A downside break below the $2,000 support might spark bearish moves. In the stated case, Ether could drop toward the $1,930 support zone in the near term. Any more losses might call for a drop toward the $1,850 level.
Technical Indicators
Hourly MACD – The MACD for ETH/USD is losing momentum in the bearish zone.
Hourly RSI – The RSI for ETH/USD is now below the 50 level.
Major Support Level – $2,000
Major Resistance Level – $2,085