The amount of assets under management remains muted compared to the billions of dollars attracted by U.S. spot Bitcoin ETFs in January.
Cryptocurrency Financial News
The amount of assets under management remains muted compared to the billions of dollars attracted by U.S. spot Bitcoin ETFs in January.

The chair of the U.S. House Financial Service Committee alluded to claims in Consensys’s recent lawsuit against the SEC, suggesting an investigation into Ether as a security.

Fund issuers and industry experts hope Hong Kong’s new crypto ETFs will open the doors for mainland Chinese investment in the future.
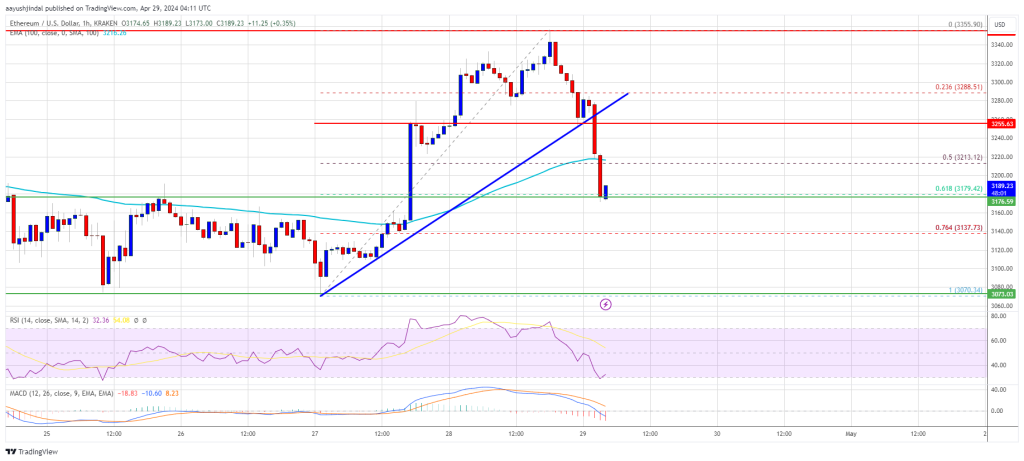
Ethereum price struggled to recover above $3,350 and corrected gains. ETH is consolidating near $3,200 and facing many hurdles.
Ethereum price failed to settle above the $3,250 level and started another decline, like Bitcoin. ETH traded below the $3,200 level and even spiked below $3,120. A low was formed at $3,113 and the price is now consolidating.
There was a minor increase above the $3,200 level. The price broke the 23.6% Fib retracement level of the recent decline from the $3,355 swing high to the $3,113 low. However, the bears were active near the $3,240 and $3,250 levels.
The 50% Fib retracement level of the recent decline from the $3,355 swing high to the $3,113 low acted as a hurdle. There was a fresh decline below the $3,200 level. Ethereum is now trading below $3,200 and the 100-hourly Simple Moving Average.
There is also a short-term rising channel forming with support at $3,170 on the hourly chart of ETH/USD. Immediate resistance is near the $3,200 level and the 100-hourly Simple Moving Average.
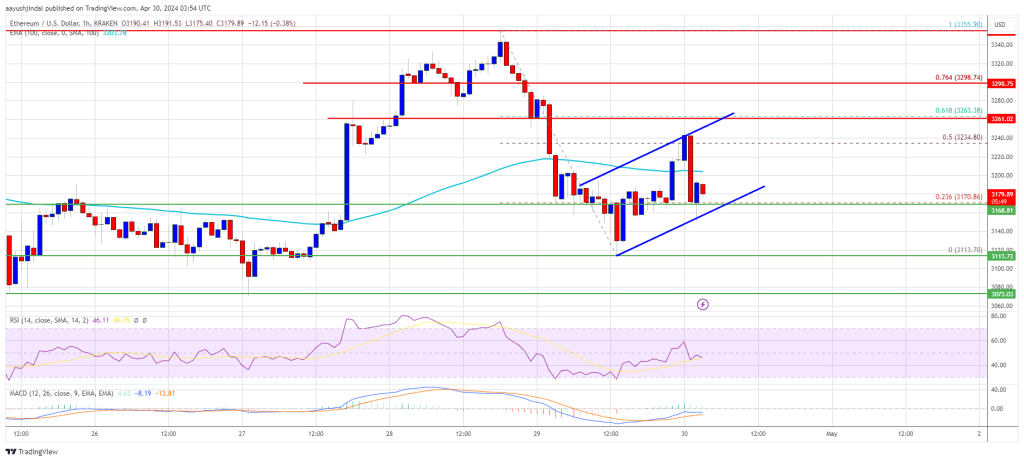
Source: ETHUSD on TradingView.com
The first major resistance is near the $3,240 level. The next key resistance sits at $3,300, above which the price might gain traction and rise toward the $3,350 level. A close above the $3,350 resistance could send the price toward the $3,450 resistance. If there is a move above the $3,450 resistance, Ethereum could even test the $3,550 resistance. Any more gains could send Ether toward the $3,620 resistance zone.
If Ethereum fails to clear the $3,250 resistance, it could continue to move down. Initial support on the downside is near the $3,170 level and the channel zone. The first major support is near the $3,120 zone.
The main support is near the $3,070 level. A clear move below the $3,070 support might push the price toward $3,030. Any more losses might send the price toward the $2,880 level in the near term.
Technical Indicators
Hourly MACD – The MACD for ETH/USD is gaining momentum in the bearish zone.
Hourly RSI – The RSI for ETH/USD is now below the 50 level.
Major Support Level – $3,170
Major Resistance Level – $3,250
EigenLayer, a decentralized restaking protocol built on Ethereum (ETH), has made significant announcements, paving the way for new developments within the crypto ecosystem.
The protocol unveiled its native token, EIGEN, which the newly formed Eigen Foundation will distribute. Alongside this, EigenLayer introduced a major plan for an airdrop and released a comprehensive new Whitepaper.
According to the protocol’s announcement, the introduction of the EIGEN token brings forth a complementary mechanism designed to address “intersubjective” faults, which cannot be resolved through ETH restaking alone.
By expanding ETH restaking, EigenLayer positions ETH as the Universal Objective Work Token, while the universality of EIGEN makes it the Universal Intersubjective Work Token. EIGEN’s universality is reportedly aimed at allowing it to fork and slash for intersubjective errors committed by EIGEN stakers in any AVS (Automated Verification System) within the protocol.
To ensure widespread adoption of EIGEN across applications, EigenLayer has designed an application-independent mechanism to maintain the system’s cryptoeconomic security.
In EigenLayer, EIGEN staking and ETH restaking play complementary roles. EIGEN addresses safety properties through objective slashing, and ETH restaking ensures liveness and censorship-resistance properties dependent on stake decentralization.
The launch of EIGEN also introduces intersubjective staking, marking a significant milestone for the protocol and the Ethereum ecosystem. However, due to its newly introduced design, the concept requires widespread adoption and discussion among ecosystem participants.
At launch, the Eigen token will have a total supply of 1.67 billion tokens, with the Foundation allocating 45% of the tokens to the community. This allocation is further divided into staked drops, community initiatives, and ecosystem development.
Investors will reportedly receive almost 30% of the tokens, while early contributors will receive over 25%. Both these groups are subject to a three-year lockup period for their allocations.
A complete lock will be in place during the first year, followed by a gradual release of their total holdings at a rate of 4% per month over the subsequent two years.
While the initial implementation of intersubjective staking at launch mirrors only a limited extent of the full protocol, several parameters still need to be determined for its full actuation.
To address this, EIGEN is being launched in a meta-setup phase, serving as a call to action for researchers, experts, and the broader community to engage in public discourse.
As EigenLayer announced, this collaborative effort aims to help define the necessary parameters to make the protocol and its interaction with the rest of the Ethereum ecosystem as effective as possible.
Featured image from Shutterstock, chart from TradingView.com

Hong Kong already has a clear definition of Ethereum and it is not a security, said OSL Digital Securities head Wayne Huang.
Recently, a seasoned crypto investor, Daan Crypto Trades, offered a fresh perspective on evaluating altcoin market sentiment.
Daan believes the ETH/BTC ratio is a superior indicator of altcoin market sentiment over the SOL/BTC ratio, showing data that suggests the potential for an upcoming altcoin season.
Daan Crypto Trades has challenged the emerging view that SOL/BTC might be a better gauge for altcoin strength, arguing instead for the enduring relevance of ETH/BTC. According to Daan, while Solana’s performance has been notable, it hasn’t significantly impacted Bitcoin’s dominance, which remains strong.
This observation suggests that SOL/BTC may not accurately reflect broader alternative coins market trends. On the other hand, ETH/BTC has historically mirrored shifts in altcoin market sentiment more closely, making it a more reliable metric.
This distinction is crucial for investors seeking to understand the real-time health and potential shifts within the broader altcoin market.
Seeing a lot of people claim $SOL/BTC is a better proxy for general alt strength than ETH/BTC.$SOL performed extremely well and the general alt market underperformed BTC as BTC.D grinded higher.
Therefore, I would not say SOL/BTC is a good gauge for overall altcoin strength at… https://t.co/8KpdnACoOt
— Daan Crypto Trades (@DaanCrypto) April 28, 2024
Daan’s analysis points out that significant movements in the ETH/BTC ratio have often preceded dynamic phases in the altcoin market, commonly referred to as ‘altcoin seasons.’ These periods are characterized by rapid price increases across altcoins, often outpacing Bitcoin.
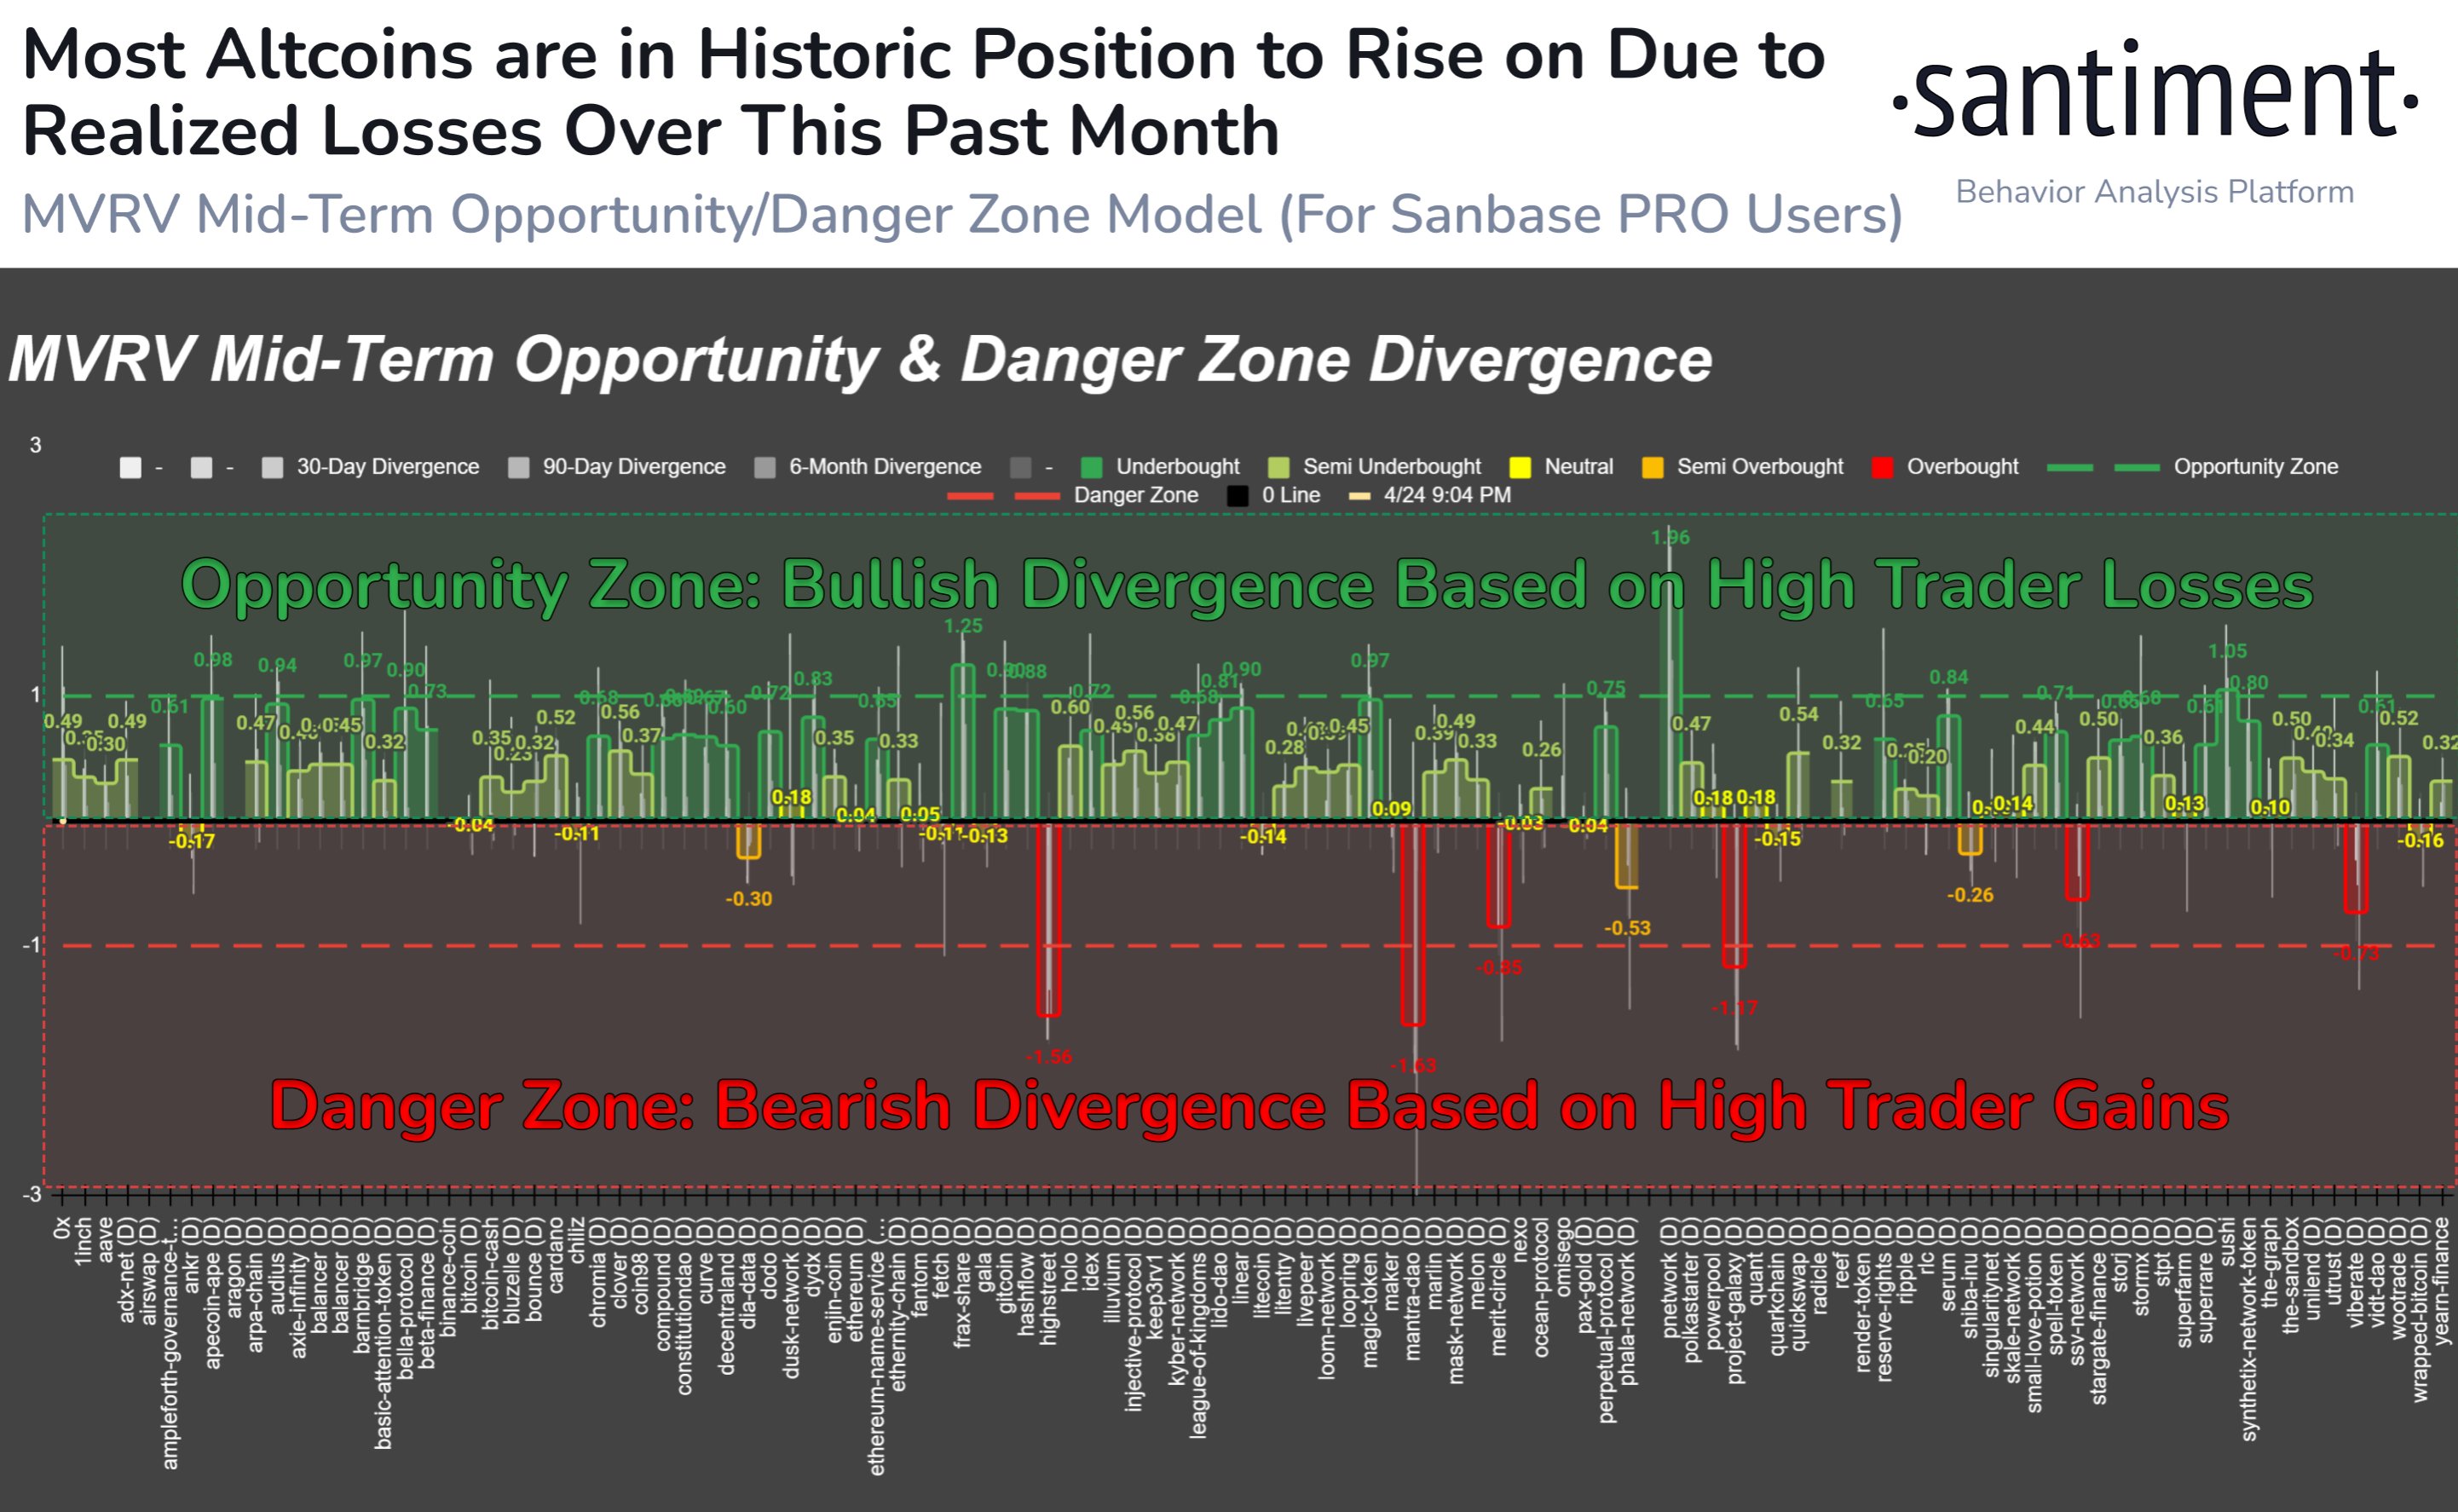
Current market analysis by Daan and on-chain data from Santiment underline a brewing sentiment that could lead to another alternative coins season. Santiment’s report highlights an unusual accumulation pattern across altcoins, with their Market Value to Realized Value (MVRV) ratios suggesting many are undervalued.
Over 85% of altcoins analyzed are currently positioned in what Santiment describes as the historical “opportunity zone.” This zone indicates that the assets are trading below their realized value, presenting potential buying opportunities for savvy investors.
According to our model, the mid-term gains and losses by average wallets indicate heavy realized losses across most #altcoins. Over 85% of assets we track are in a historic opportunity zone when calculating the market value to realized value (MVRV) of wallets’ collective… pic.twitter.com/NogkCSH5PG
— Santiment (@santimentfeed) April 25, 2024
Further reinforcing this sentiment, the Bitcoin dominance index (BTC.D), which tracks Bitcoin’s market cap relative to the entire crypto market, has slightly declined. BTC.D has dropped from 57.10% as of the middle of this month to roughly 54.69% as of today.
This decline could suggest that capital is beginning to flow more substantially into altcoins. Notably, the combination of favorable MVRV ratios and shifting dominance lends credence to Daan’s assertion that an alternative coins season may be on the horizon, ready to unleash notable gains similar to past cycles.
Featured image from Unsplash, Chart from TradingView
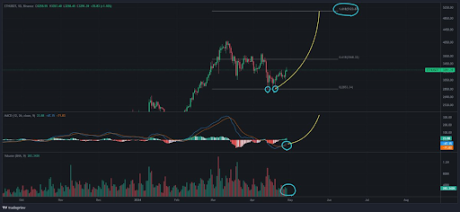
The second-largest crypto token by market cap, Ethereum (ETH), finally showed some form of life as it rose to $3,300 over the weekend. This move is believed to be the beginning of a trend reversal for the crypto token, which has several bullish signals on its chart.
Crypto analyst Derek revealed in an X (formerly Twitter) post that the signals on Ethereum’s Moving Average Convergence/Divergence (MACD) indicator “seem to have ended the decline and changed upward direction.” He also highlighted the Ethereum Dominance chart, which has confirmed three bottoms and gave a strong rebound.
The analyst explained that “leading a rebound after confirming the bottom three times means that further decline is unnecessary, and there is a high possibility that there is no intention to do so.” Interestingly, the analyst drew attention to the fact that Ethereum has experienced this price rebound without volume.
This phenomenon occurs when individual investors are more active than institutional ones who are more cautious during this period. This instantly brings recent buys by Ethereum whales like Justin Sun into the picture, as they have contributed significantly to Ethereum’s recent resurgence.
NewsBTC recently reported that a wallet believed to belong to the TRON founder recently bought $405 million worth of Ethereum. This wallet and another suspected to belong to Sun have accumulated $891 million worth of ETH since February 12. Meanwhile, NewsBTC also reported about another whale, who, despite losing $4.5 million worth of longing ETH, opened another long worth over $17 million.
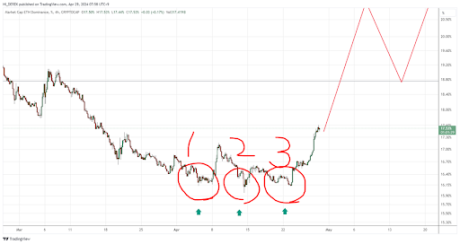
Crypto analyst Trader Tardigrade recently revealed that Ethereum experienced a decent breakout to a descending trendline on the daily chart of its Bitcoin pair. He added that Ethereum’s Relative Strength Index (RSI) also shows an associated breakout from a symmetrical triangle.
The crypto analyst claimed that the value of the RSI is also now above 50, which is considered bullish for a crypto token. Based on these signals, Trader Tardigrade stated it is “time for Ethereum.” He also suggested that other altcoins will moon once Ethereum begins its parabolic move to the upside.
Derek also predicted this, stating that the “rise of Ethereum will drive the explosive rise of altcoins that have been oppressed.” While sharing his bullish sentiment towards Ethereum, crypto analyst Crypto Prof echoed a similar sentiment, remarking that altcoins will “run even more” as Ethereum trades significantly higher in the coming months.
Before now, Crypto expert Michaël van de Poppe predicted that the narrative would shift toward Ethereum post-halving and that the crypto token and other altcoins would bounce in their Bitcoin pair once the hype around the halving was over.
At the time of writing, Ethereum is trading at around $3,170, down over 1% in the last 24 hours, according to data from CoinMarketCap.

The EIGEN token will be used to form consensus around data that is off-chain but easily verifiable, such as whether someone won a bet or adequately stored data.

Bitcoin and altcoins are falling toward strong support levels, which appear likely to hold in the short term.
Ethereum, the world’s second-largest cryptocurrency by market capitalization, has seen a dramatic drop in transaction fees, according to a recent analysis by Santiment, a prominent crypto analytics platform.
The report indicates that the average Ethereum transaction fee has plunged to a mere $1.12, marking the lowest daily average cost since October 18th, 2023.
This significant decrease in transaction fees has sparked discussions among crypto enthusiasts and analysts alike. Santiment’s analysis suggests a strong correlation between transaction fees and the overall sentiment within the cryptocurrency market.
The analysis highlights that periods of exuberance, often characterized by the “to the moon” narrative and a belief in exponential price gains, tend to coincide with higher transaction fees. Conversely, during market downturns dominated by pessimism, transaction fees typically fall.
#Ethereum‘s average fee level has dipped to just $1.12 per network transaction, the lowest average cost in a day since October 18th.
Traders historically move between sentimental cycles of feeling that #crypto is going “To the Moon” or feeling that “It Is Dead”, which can… pic.twitter.com/8b8rLMLyIf
— Santiment (@santimentfeed) April 28, 2024
Transaction fees serve as a fascinating window into the collective mood of the crypto market, analysts say. By tracking these fees, they can glean valuable insights into investor confidence and underlying demand dynamics.
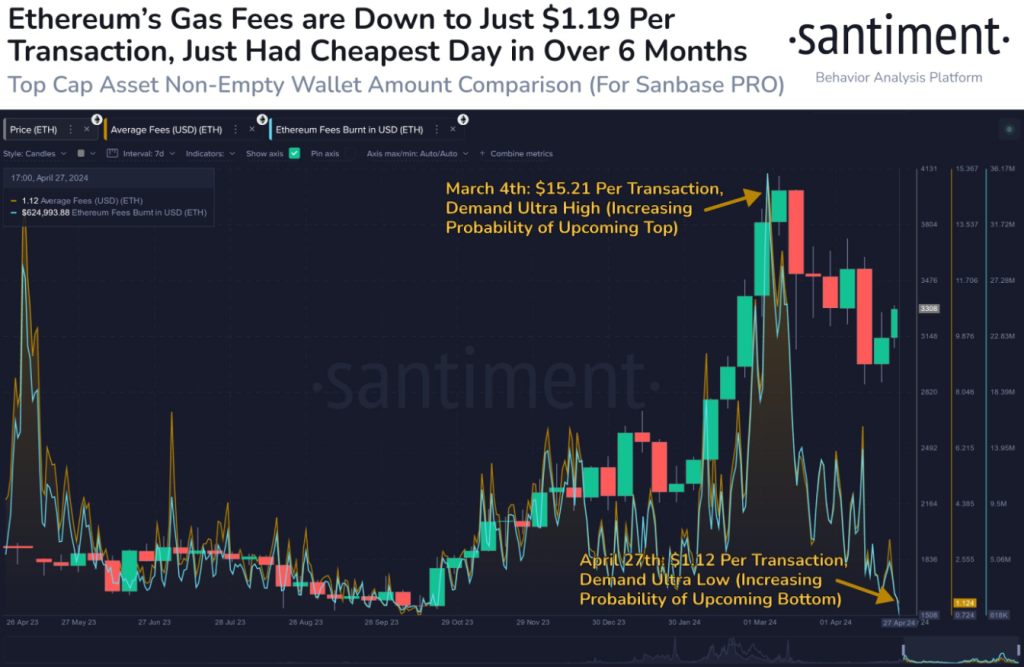
The current low transaction fees present something of a conundrum for investors. On the one hand, they could indicate a decline in network activity, potentially reflecting a bearish market sentiment.
However, Santiment’s analysis offers a more optimistic perspective. The report proposes that the lower fees, coupled with the recent easing of network difficulty, could pave the way for a smoother recovery for Ethereum and other altcoins (alternative cryptocurrencies).
While the low fees might signal lower demand, they could also signify a welcome reduction in network congestion, analysts say. This, in turn, could potentially act as a catalyst for Ethereum’s price recovery, although it’s important to note that this might signal a faster turnaround than many anticipate.
Investor Takeaway: Data Is King In The Cryptoverse
The ever-changing landscape of the cryptocurrency market can be daunting for even seasoned investors. Santiment’s data-driven approach, with its emphasis on transaction fees as a sentiment indicator, offers valuable insights for navigating this volatile space.
The Road Ahead For Ethereum
While the analysis offers a compelling interpretation of the current situation, it’s crucial to remember that the cryptocurrency market is complex and influenced by a multitude of factors. The long-term impact of these low transaction fees remains to be seen.
Featured image from Pexels, chart from TradingView

In April 2023, Gensler refused to answer repeated questions on whether the SEC believed Ether to be a security.
Ethereum price rallied above the $3,300 level. ETH tested the $3,350 resistance and recently started a sharp decline below $3,300.
Ethereum price started a strong increase above the $3,200 level. ETH outperformed Bitcoin and even cleared the $3,300 resistance. However, the bears were active near the $3,350 level.
A high was formed at $3,355 and the price started a fresh decline. There was a sharp move below the $3,300 level. The price declined below the 50% Fib retracement level of the upward move from the $3,070 swing low to the $3,355 high.
There was also a break below a key bullish trend line with support at $3,250 on the hourly chart of ETH/USD. Ethereum is now trading below $3,220 and the 100-hourly Simple Moving Average.
However, the bulls are active near the $3,165 support and the 61.8% Fib retracement level of the upward move from the $3,070 swing low to the $3,355 high. Immediate resistance is near the $3,210 level and the 100-hourly Simple Moving Average.
Source: ETHUSD on TradingView.com
The first major resistance is near the $3,250 level. The next key resistance sits at $3,350, above which the price might gain traction and rise toward the $3,465 level. A close above the $3,465 resistance could send the price toward the $3,550 resistance. If there is a move above the $3,550 resistance, Ethereum could even test the $3,680 resistance. Any more gains could send Ether toward the $3,750 resistance zone.
If Ethereum fails to clear the $3,210 resistance, it could continue to move down. Initial support on the downside is near the $3,180 level. The first major support is near the $3,165 zone.
The main support is near the $3,070 level. A clear move below the $3,070 support might set the pace for more losses and send the price toward $3,030. Any more losses might send the price toward the $2,880 level in the near term.
Technical Indicators
Hourly MACD – The MACD for ETH/USD is gaining momentum in the bearish zone.
Hourly RSI – The RSI for ETH/USD is now below the 50 level.
Major Support Level – $3,165
Major Resistance Level – $3,210
In a controversial report, Forbes unveiled a list of 20 “crypto billion-dollar zombies,” Layer 1 (L1) tokens, which the news outlet defines as crypto assets with substantial valuations but “limited utility beyond speculative trading.”
These cryptocurrencies and projects include Ripple, XRP, Ethereum Classic (ETC), Tezos (XTZ), Algorand (ALGO), and Cardano (ADA), among others.
Ripple Labs, the company behind XRP, was highlighted as a prominent crypto zombie. Despite XRP’s active trading volume of around $2 billion daily, Forbes asserts that the token’s primary purpose remains “speculative” and “lacking meaningful utility.”
However, Ripple Labs and XRP are not alone in this regard. Forbes reveals that 50 blockchains, excluding Bitcoin (BTC) and Ethereum (ETH), currently trade at values surpassing $1 billion, with at least 20 of them classified as “functional zombies.” Collectively, these 20 blockchains hold a market value of $116 billion, despite having “limited user bases.”
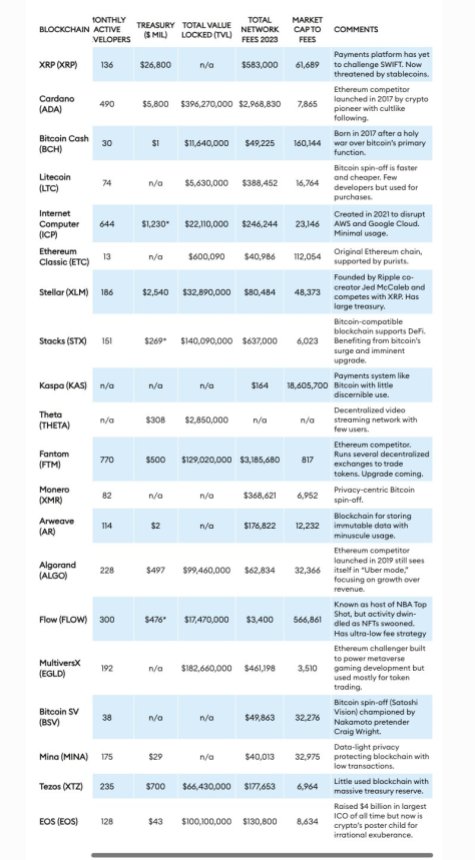
According to Forbes, an example of a “functional zombie” is Ethereum Classic, which maintains the distinction of being the original Ethereum chain.
While ETC has a market value of $4.6 billion, its fee generation in 2023 was less than $41,000, raising questions about the blockchain’s viability for the news organization.
Another crypto project in Forbes’ report is Tezos, which raised $230 million through an initial coin offering (ICO) in 2017.
Tezos’ XTZ token currently holds a market capitalization of $1.2 billion. However, the blockchain’s fee earnings were meager, with $5,640 in February 2024 and a total of $177,653 for all of 2023.
Algorand, once hailed as an “Ethereum killer” due to its capability of processing 7,500 transactions per second, faces similar challenges.
Despite a market cap of $2 billion and a treasury holding of $500 million, Algorand earned $63,000 in blockchain transaction fees throughout 2023. For Forbes, this casts doubt on its actual adoption and utility.
The zombie blockchains are categorized into two groups by Forbes: spin-offs and direct competitors to established blockchains like Bitcoin and Ethereum.
Spin-off zombies include Bitcoin Cash (BCH), Litecoin (LTC), Monero (XMR), Bitcoin SV (BSV), and Ethereum Classic.
These blockchains, collectively valued at $23 billion, reportedly emerged from “disagreements” among programmers regarding the governance and direction of the original chains.
Forbes notes that when such conflicts arise, hard forks occur, resulting in new networks that share the same transaction history as their predecessors. The agency claims that their market value “often exceeds” their real-world usage.
Overall, The report highlights a growing disparity between the valuations of certain projects in the cryptocurrency industry and their actual utility and usage. Consequently, Forbes refers to these projects as “zombies.”
Featured image from Shutterstock, chart from TradingView.com

Bitcoin and altcoins could be en route to retest their recent strong support levels as bears try to extend the correction.
Ethereum withdraws from centralized exchanges have ramped up over the last week, suggesting a direction for investor sentiment during this time. Given the sheer volume of ETH withdrawn from these exchanges, it is prudent to try to understand what this could mean for the crypto’s price.
Amid the uncertainty that has plagued the crypto market, Ethereum investors are making moves to secure their positions for better price prospects. Pseudonymous crypto technical analyst Titan of Crypto took to X (formerly Twitter) to share what Ethereum investors are doing about their holdings right.
Related Reading: Bitcoin Bears Risk Losing $7.2 Billion If BTC Price Reaches This Level
The post revealed that these investors have been withdrawing large amounts of ETH from centralized exchanges. In the one week period that was tracked, the report found that a total of 260,000 ETH were withdrawn from exchanges, which was worth almost $800 million at the time.
Crypto exchanges witnessed an outflow of over 260,000 #ETH equivalent to more than $781 million within the past 7 days.
It’s time for #Ethereum shine.
pic.twitter.com/jT1aocjvbI
— Titan of Crypto (@Washigorira) April 24, 2024
Now, exchange deposits and withdrawals are important for any cryptocurrency because it can often tell how investors are looking at that coin and what they are doing with their holdings. In the case of large deposits to centralized exchanges, it can be very bearish for the price because investors often deposit their coins in order to sell them as exchanges provide deep liquidity.
In contrast, withdrawals from exchanges suggest that investors are not looking to sell their ETH. Rather, they are accumulating the coins to wait for better prices before selling. Naturally, this is bullish for the Ethereum price as a diminished selling pressure gives room for the price to recover.
In this case, the withdrawals are bullish or the Ethereum price, as investors continue to accumulate. It also signals that investors are expecting a price breakout, and as the withdrawals ramp up, demand could surpass supply, leading to a surge in price.
Ethereum, while currently seeing some positive activity from investors, has still not turned completely bullish. For one, there has been a significant decline in its daily trading volume. According to data from Coinmarketcap, Ethereum’s trading volume is down approximately 20% in the last day.
This decline in volume suggests a declining interest from investors to actually trade the coin. As such, its price may be negatively affected as attention begins to shift elsewhere, with investors looking for better prospects.
Nevertheless, the cryptocurrency still looks bullish for the long term. Ethereum continues to closely mirror the price performance of Bitcoin, which is expected to go on a bull run following the successful completion of its fourth halving event.
For now, Ethereum continues to struggle to hold above $3,100 with small gains of 0.18% in the last day. Over the last month, it has suffered multiple crashes, registering a 12.36% loss in the last 30 days.

Yao Qian, the first director of CBDC development at China’s central bank, is reportedly under investigation for suspected law violations.
The on-chain analytics firm Santiment has revealed that over 85% of all altcoins in the sector are currently in the historical “opportunity zone.”
In a new post on X, Santiment discussed how the altcoin market looks based on their MVRV ratio model. The “Market Value to Realized Value (MVRV) ratio” is a popular on-chain indicator that compares the market cap of Bitcoin against its realized cap.
The market cap here is the usual total valuation of the asset’s circulating supply based on the current spot price. At the same time, the latter is an on-chain capitalization model that calculates the asset’s value by assuming the “true” value of any coin in circulation is the last price at which it is transferred on the blockchain.
Given that the last transaction of any coin would have likely been the last time it changed hands, the price at its time would act as its current cost basis. As such, the realized cap essentially sums up the cost basis of every token in the circulating supply.
Therefore, one way to view the model is as a measure of the total amount of capital the investors have put into the asset. In contrast, the market cap measures the value holders are carrying.
Since the MVRV ratio compares these two models, its value can tell whether Bitcoin investors hold more or less than their total initial investment.
Historically, when investors have been in high profits, tops have become probable to form, as the risk of profit-taking can spike in such periods. On the other hand, a dominance of losses could lead to bottom formations as selling pressure runs out in the market.
Based on these facts, Santiment has defined an “opportunity” and “danger” zone model for altcoins. The chart below shows how the market currently looks from the perspective of this MVRV model.
Under this model, when the MVRV divergence for any asset on some timeframe is higher than 1, the coin is considered to be inside the bullish opportunity zone. Similarly, if it is less than -1, it suggests it’s in the bearish danger zone.
The chart shows that MVRV divergence for a large part of the market is in the opportunity zone right now. As the analytics firm explains,
Over 85% of assets we track are in a historic opportunity zone when calculating the market value to realized value (MVRV) of wallets’ collective returns over 1-month, 3-month, and 6-month cycles.
Thus, if the model is to go by, now may be the time to go around altcoin shopping.
Ethereum, the largest among the altcoins, has observed a 3% surge over the past week, which has taken its price to $3,150.
Ethereum price is attempting a recovery wave above the $3,125 zone. ETH must clear the $3,200 resistance to continue higher in the near term.
Ethereum price struggled to recover and extended losses below the $3,100 level. ETH traded as low as $3,074 and is currently attempting another recovery wave, like Bitcoin.
There was a minor increase above the $3,125 resistance. The price climbed above the 23.6% Fib retracement level of the recent drop from the $3,292 swing high to the $3,074 low. However, the bears are active near the $3,200 resistance zone.
Ethereum is now trading below $3,180 and the 100-hourly Simple Moving Average. There is also a key rising channel forming with support at $3,140 on the hourly chart of ETH/USD. Immediate resistance is near the $3,180 level and the 100-hourly Simple Moving Average.
The first major resistance is near the $3,200 level or the 61.8% Fib retracement level of the recent drop from the $3,292 swing high to the $3,074 low.
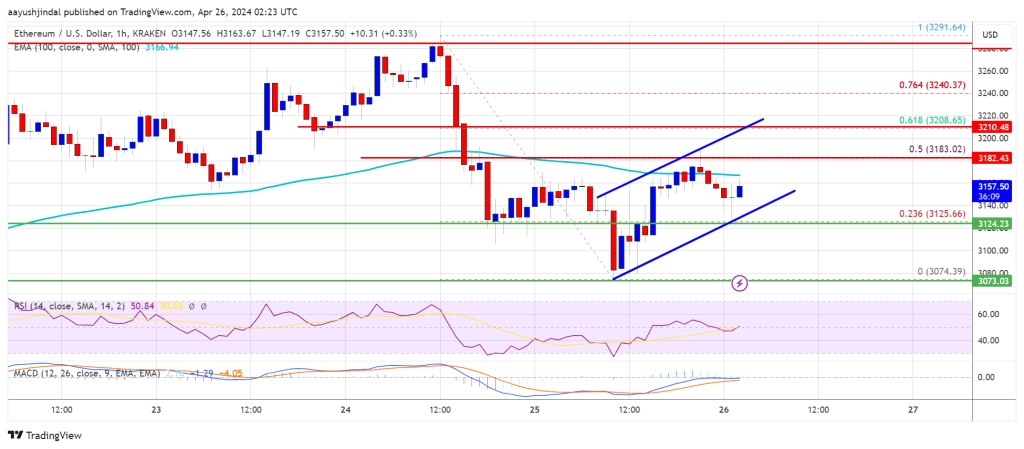
Source: ETHUSD on TradingView.com
The next key resistance sits at $3,240, above which the price might gain traction and rise toward the $3,280 level. A close above the $3,280 resistance could send the price toward the $3,350 resistance. If there is a move above the $3,350 resistance, Ethereum could even test the $3,500 resistance. Any more gains could send Ether toward the $3,550 resistance zone.
If Ethereum fails to clear the $3,180 resistance, it could continue to move down. Initial support on the downside is near the $3,125 level. The first major support is near the $3,075 zone.
The main support is near the $3,030 level. A clear move below the $3,030 support might set the pace for more losses and send the price toward $2,880. Any more losses might send the price toward the $2,750 level in the near term.
Technical Indicators
Hourly MACD – The MACD for ETH/USD is losing momentum in the bearish zone.
Hourly RSI – The RSI for ETH/USD is now below the 50 level.
Major Support Level – $3,125
Major Resistance Level – $3,200