Ethereum price is moving higher above the $1,880 resistance against the US Dollar. ETH could surge toward $2,000 or $2,050 if it clears the $1,920 resistance.
- Ethereum is moving higher toward the $2,000 resistance.
- The price is trading above $1,880 and the 100-hourly Simple Moving Average.
- There is a major bullish trend line forming with support near $1,885 on the hourly chart of ETH/USD (data feed via Kraken).
- The pair could gain bullish momentum if it clears the $1,920 resistance zone.
Ethereum Price Aims Higher
Ethereum’s price formed a base above the $1,800 support zone. ETH started a steady increase and cleared the $1,880 resistance zone, similar to Bitcoin at $28,800.
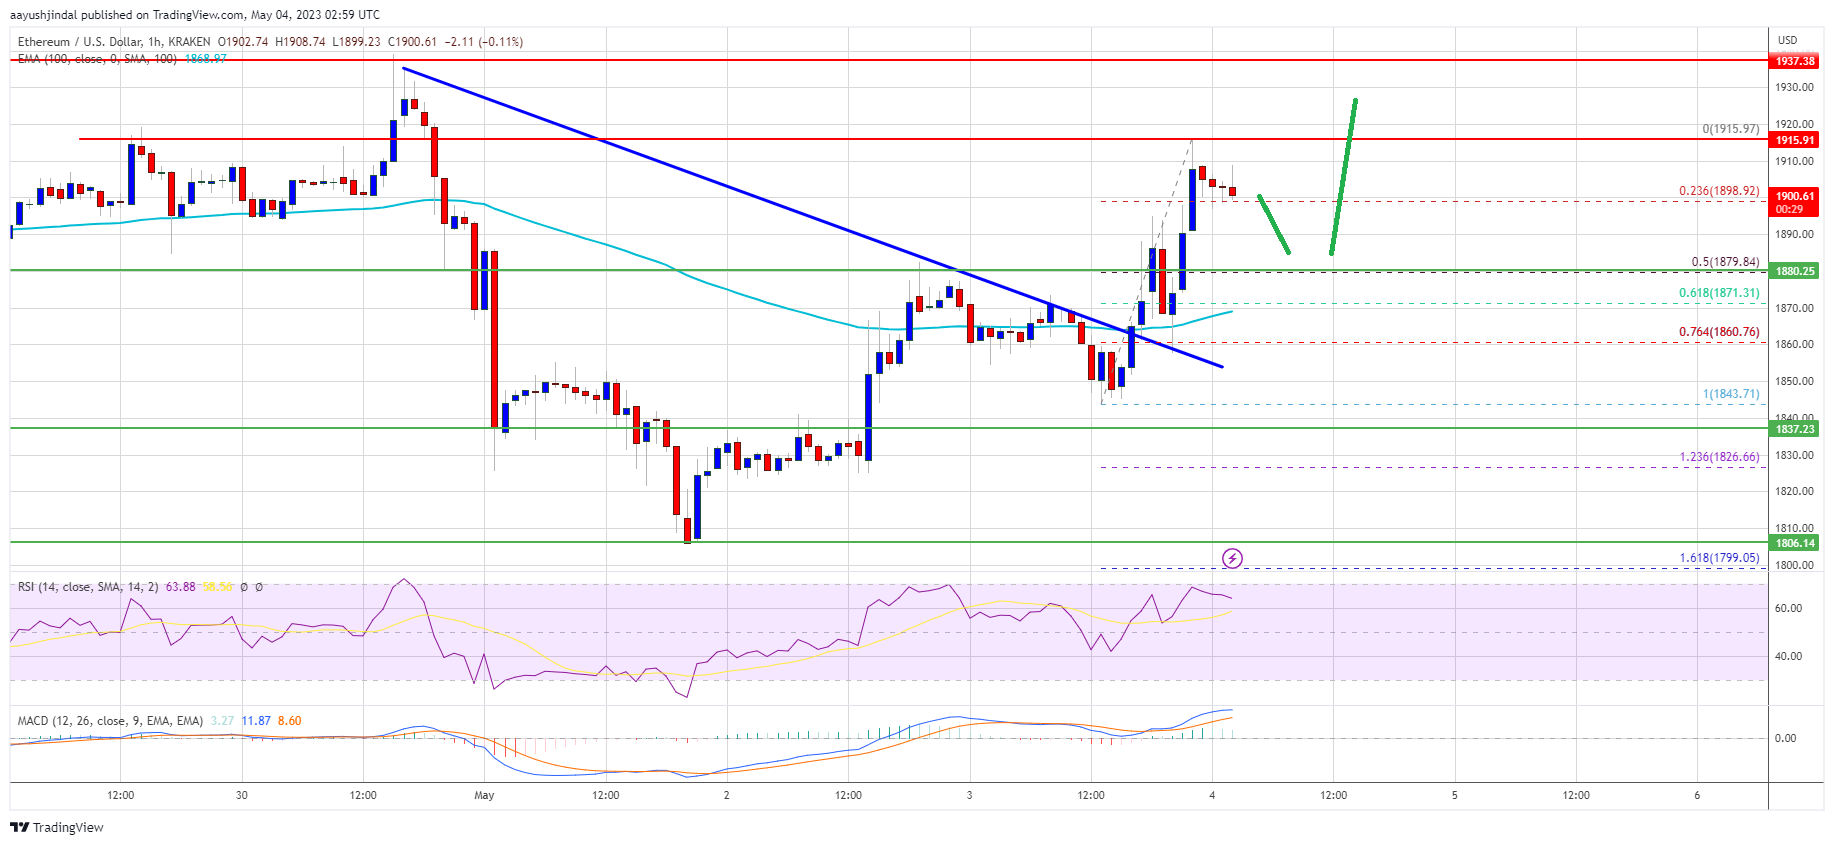
The price even climbed above $1,900 but faced sellers near $1,920. There was a downside correction but the bulls were active near $1,870. A low is formed near $1,867 and the price is now rising. There was a break above the 50% Fib retracement level of the recent decline from the $1,917 high to the $1,867 low.
Ether is now trading above $1,880 and the 100-hourly Simple Moving Average. There is also a major bullish trend line forming with support near $1,885 on the hourly chart of ETH/USD.
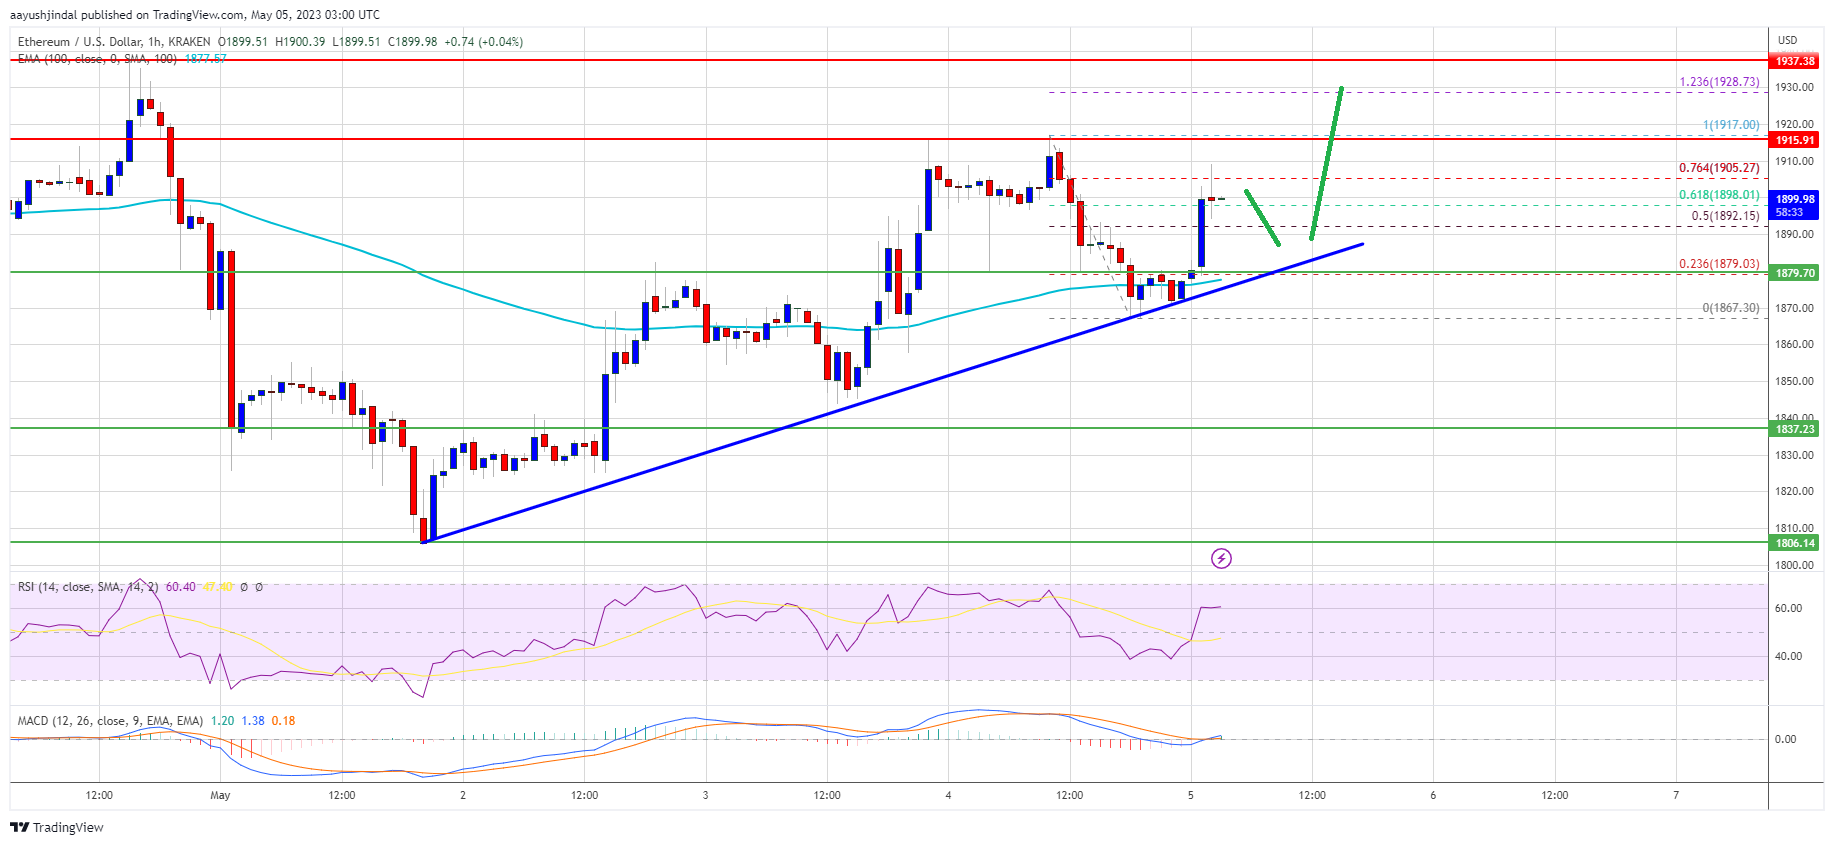
Source: ETHUSD on TradingView.com
Immediate resistance is near the $1,905 level. It is close to the 76.4% Fib retracement level of the recent decline from the $1,917 high to the $1,867 low. The next major resistance seems to be forming near $1,920. A close above the $1,920 resistance zone could send Ethereum toward the $1,940 resistance. Any more gains could send Ether toward the $2,000 resistance. In the stated case, the price may even rise toward the $2,120 resistance.
Are Dips Supported in ETH?
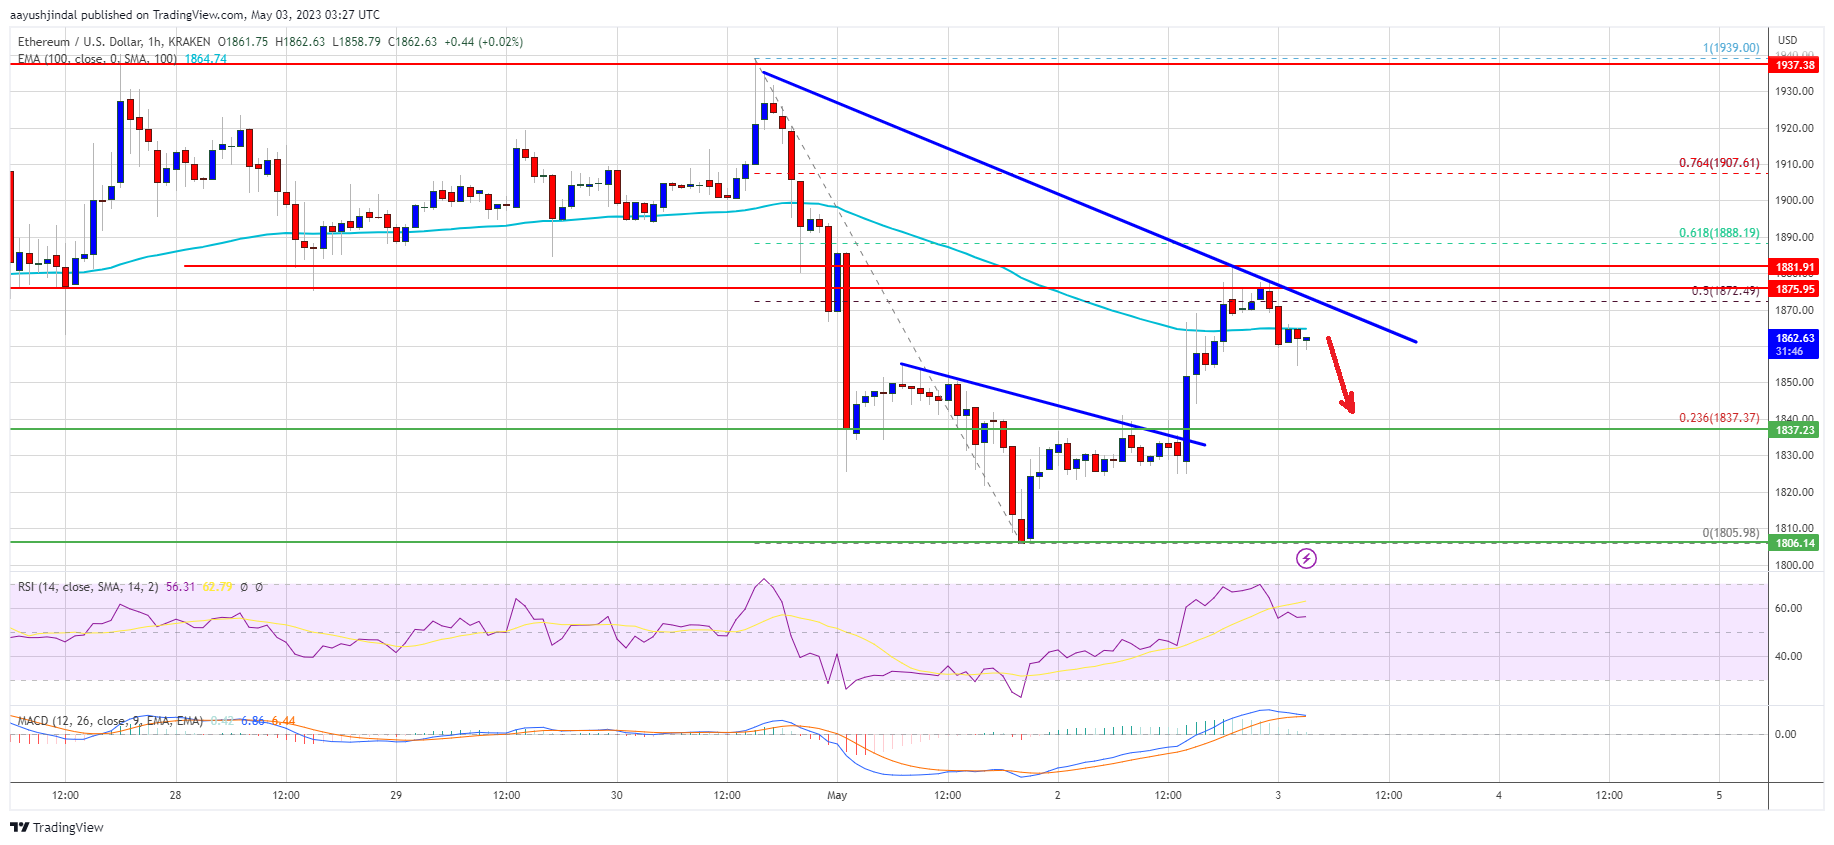
If Ethereum fails to clear the $1,920 resistance, it could start a downside correction. Initial support on the downside is near the $1,885 level and the trend line.
The next major support is near the $1,880 zone or the 100 hourly SMA, below which ether price might drop toward the $1,840 support zone. Any more losses may perhaps take the price toward the $1,805 level in the near term.
Technical Indicators
Hourly MACD – The MACD for ETH/USD is now gaining momentum in the bullish zone.
Hourly RSI – The RSI for ETH/USD is above the 50 level.
Major Support Level – $1,880
Major Resistance Level – $1,920