
Rothschild Investment Corp has bought more Bitcoin and Ethereum exposure via Grayscale despite the ongoing crypto market retreat.
Cryptocurrency Financial News
Rothschild Investment Corp has bought more Bitcoin and Ethereum exposure via Grayscale despite the ongoing crypto market retreat.

On-chain data shows two dramatic declines in the Bitcoin reserves held by a Canadian Bitcoin fund but there’s a catch.

The RSI is seeing higher lows after rebounding from its oversold areas as Bitcoin price is forming lower lows.

Bitcoin bears could take a $31-million lead if BTC falls below $33,000 by Friday’s options expiry, but at the moment, both sides are balanced.

The investment bank reported owning a significant stake in GBTC as of April 30, according to a recent filing with the SEC.

The biggest single unlocking day will flush sellers from the market in July, opening up both volatility and bullish potential.

A recent market outlook published by Glassnode shows institutions are returning to the Bitcoin market after May 19 crash.
Bitcoin price is still below $40,000, after just weeks ago trading at over $64,000 per coin. The selloff shocked market participants of all sizes, prompting fears that the bull market is now over and a bear phase is next.
A trader who predicted this recent collapse months in advance using high timeframe technical analysis, now fears that a bear market could follow. But it all comes down to the pivotal June monthly close. Here’s why.
When it comes to technical analysis, the highest timeframes offer the most dominant signals. This means that regardless of what’s going on on daily or shorter timeframes, if the weekly, monthly, or higher say the trend is up, that’s the direction the market heads.
Reversals have to begin on the smallest timeframes, however, it is within the high timeframe charts where the earliest warning signs are visible. This is no different for Bitcoin, Ethereum, or any financial asset or cryptocurrency.
Related Reading | Two Paths Of A Bitcoin Bull Run, And If A Bear Phase Is Next
The problem is, on a rarely used high timeframe segment on the Bitcoin price chart, the top cryptocurrency is exhibiting an extremely bearish structure.
A sharp-eyed trader has spotted a hidden bearish divergence on the RSI across the five-month timeframe. Three-months, six-months, or a year are more commonly used, but that doesn’t discount the effectiveness of the segment.

Bear markets have always started off with a wick like the above | Source: BLX on TradingView.com
This is the same trader that spotted the first ever bearish divergence on the Bitcoin quarterly chart. The signal confirmed and the top cryptocurrency dropped by more than 50% in its worst monthly candle on record.
Bulls can undo the damage done and prevent an evening star pattern from forming on the monthly if they can close May above $45,000. However, it is the June close that would also finalize the five-month candle above.
Related Reading | The Level Bitcoin Bulls Must Reclaim To Defend The Worst Monthly Selloff Ever
The candle currently has the largest upside wick into resistance in the history of the chart, showing that bears were ready and waiting. Each wick left on the five-month timeframe, was followed by a bear market.
Is this time different, or is a bear market coming to crypto before Bitcoin ever gets to six figures like the market expects? And could that expectation cause the bear market to be the worst on record as investors finally give up on the dream?
Anything is possible, but bulls have a little over a month to take Bitcoin to such highs, or else the RSI could turn down and this bearish signal could confirm.
Featured image from Deposit Photos, Charts from TradingView.com

The Grayscale Bitcoin Trust continues to trade at a discount compared to BTC, a situation that presents a unique challenge to Grayscale and investors.

Digital Currency Group has purchased a total of $194 million worth of GBTC shares so far.

Both Bitcoin’s daily volume and the amount held by large addresses roughly match 10% of gold’s.
After spending the entire month of March at a loss, the downtrend in Grayscale Bitcoin Trust premium has extended. At the time of publication, the premium stands at -11.45%, near its all-time low at -14%.

In contrast, the Canadian Purpose Bitcoin ETF had a nearly month-long streak at record inflow levels begging April. Comparing the data, GBTC at a discount, and the growth in the BTC ETF, there is a trend in investors favoring the latter.
Also the Canada Bitcoin ETF’s lifetime inflow streak has now reached 25 DAYS, an unprecedented feat in ETF history. This is my new $JETS. pic.twitter.com/HjB5qmcP9r
— Eric Balchunas (@EricBalchunas) April 2, 2021
Unlike other financial products, GBTC shares cannot be freely traded. They must go through a 6-month “lock-up” period. Although they give exposure to the price of BTC, stakeholders’ strategy to profit is based on the premium, as analyst Ben Lilly points out:
30% return is pretty impressive, and natural economic pressures should bring this premium down to 0%. Yet, for some reason we just haven’t seen that happen yet. That’s because of the way it operates and no other option being available.
If after 6 months, the GBTC premium is high, it can be sold for a large percentage of profits. Otherwise, losses can be just as steep.
Grayscale investors have started to express discontent. Investment firm Marlton issued a press release on April 6, to call for Grayscale to take “immediate action to address GBTC’s significant discount to net asset value” (NAV).
Marlton’s data indicates that GBTC’s premium discount represents an estimated $3.1 billion in losses to stockholders. The firm has called for a modification to the stock trading mechanism that would allow them to sell or buy shares at specific prices and at a specific time.
As Ben Lilly points out, the advent of new options to gain Bitcoin exposure in Canada appears to be hurting GBTC. Researcher Jan Wuestenfeld supports this thesis:
(GBTC) trading at a discount since the beginning of march and their Bitcoin holdings have been stagnating. It looks like with new alternatives coming to the market investors might turn to other products to get exposure to Bitcoin.
The above indicates a clear demand from institutions looking to acquire exposition to Bitcoin. In parallel, the Security and Exchange Commission (SEC) is under a lot of pressure to approve a Bitcoin ETF. The Commission has received over 6 petitions to approve a Bitcoin ETF in the U.S. in under 4 months.
The discount in the GBTC suggests that investors are favoring products with better trading mechanisms. The performance of Canada’s BTC ETF could create even more pressure for the U.S. regulator.
Senior Commodity Analyst for Bloomberg, Mike McGlone, sees a major inflection point in terms of adoption. New Bitcoin-based financial products could create a new “rising tide” from institutions and individuals investors trying not to “miss out on the potential for Bitcoin”. McGlone claimed:
(…) we see rising potential for 2021 to mark a migration milestone into traditional investment portfolios. Publicly traded cryptocurrency funds’ assets, dominated by Bitcoin, have surged to almost $60 billion as of March 25 from less than $10 billion in October. Growth has been driven by both rising inflows and skyrocketing prices for the funds’ underlying holdings. A U.S. Bitcoin ETF, on the back of recent launches in Canada, would likely accelerate expansion.
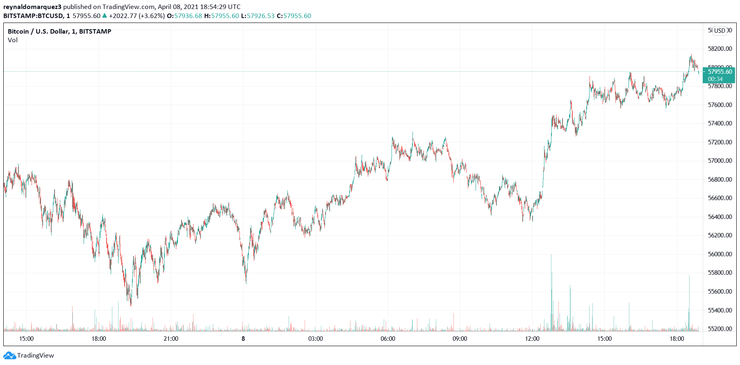
BTC is trading at $57,948 and is showing moderate gains in the 24-hour chart at 3.5%. On the 7 day chart, BTC is still moving sideways.

The company is renewing its push for a U.S. ETF but offered no specific guarantees or promises.

Demand for Bitcoin remains solid and is fuelling a “supply shock” that shows no sign of abating, even at $50,000 and higher.

Competition among institutional Bitcoin services continues to heat up as fees are slashed in time for a fresh herd of investors entering.
The fund charges a 1.75% management fee and offers custody from Fidelity Digital Asset Services.
The fund noted that it would not expose more than 15% of its $2.25 billion in assets to bitcoin.
An ETF could draw institutional money from the Grayscale Bitcoin Trust, a support for the price of the cryptocurrency, the report said.
The Guggenheim Macro Opportunities Fund will now be able to invest up to 10% of its net asset value in the Grayscale Bitcoin Trust.


