Bitcoin Hash Ribbons Trigger Buy Signal, Has Miner Capitulation Concluded?

The collapse of FTX triggered a historic event for the Bitcoin market. In late November, the hash ribbons indicator signaled the beginning of a second wave of Bitcoin miner capitulation within one cycle. As NewsBTC reported, the hash rate dropped dramatically while some of the largest miners reported bankruptcy and dumped their BTC holdings on the market.

However, this poor state of the Bitcoin mining industry and the associated pressure on the Bitcoin price may have come to an end. As the net position change of miners already indicated since the beginning of January, the selling pressure has decreased significantly.

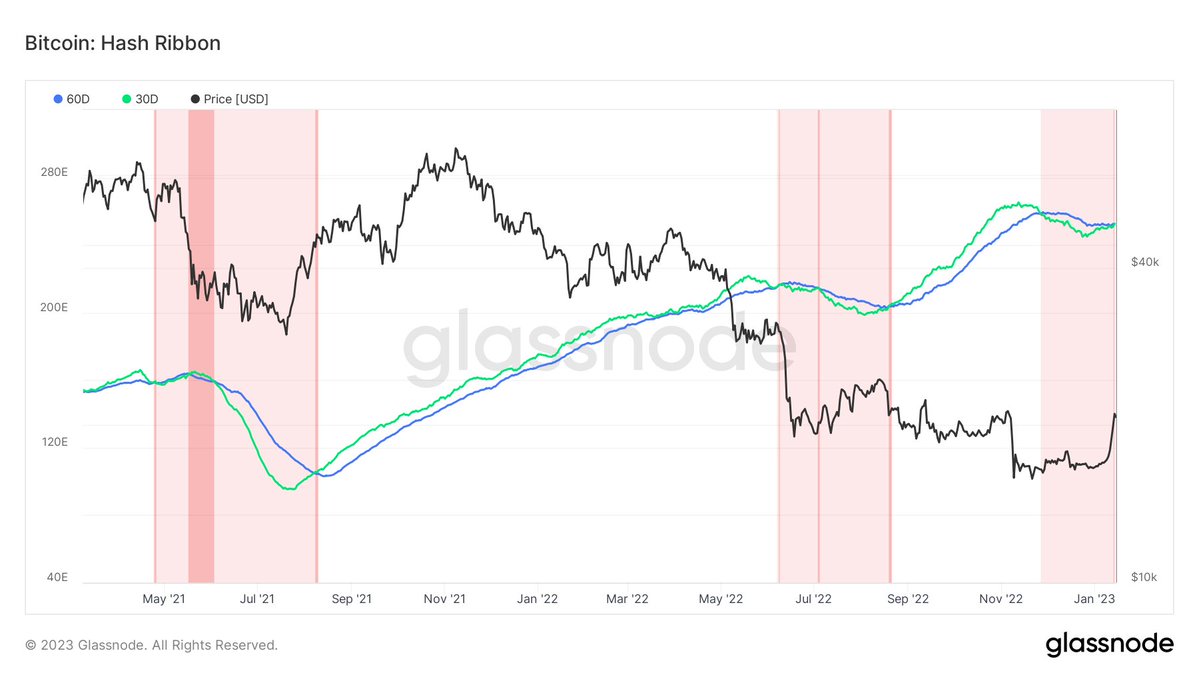
For the first time in over four months, miners had been hodling BTC instead of dumping the majority of their coins. The termination of the strong selling pressure from Bitcoin miners is now also confirmed by the hash ribbon indicator.

As the chart below shows, the hash bands are displaying a bullish cross. “Miners have stopped selling and are now plugging in machines at a sufficient rate to declare this period of miner capitulation over,” stated Will Clemente from Reflexivity Research.

Bitcoin hash ribbons

What Does This Mean For Bitcoin?

The hash ribbon is a market indicator that assumes BTC tends to hit a bottom when miners capitulate. Currently, the hash ribbons indicate that the worst of the miner capitulation is over as the 30-day MA of the hash rate crossed over the 60d MA.

In other words: When the hash ribbons indicate a cross, it signifies a paradigm shift. This is historically an extremely good buying opportunity. As Charles Edwards once said, it may be the strongest buy signal of all.

Why? Because the hash rate is a leading indicator for identifying capitulation to mining difficulty. Since the mining difficulty, unlike the hash rate, is not adjusted daily, but only every 2,016 blocks, the difficulty lags behind the hash rate by as much as two weeks.

Therefore, the difficulty is a somewhat lagging indicator of miner capitulation. But difficulty also shows the growing euphoria among miners. Bitcoin initiated a mining difficulty adjustment yesterday at block height 772,128. Mining difficulty climbed 10.26% to 37.59T, a record high.

This also confirms the thesis that miners are increasingly plugging their miners back into the network. The hashrate of the entire network is now 269.02 EH/s, also approaching its highs again. Thus, miners are clearly signaling their bullish sentiment.

The creator of the hash ribbon indicator, Charles Edwards, tweeted:

Hash Ribbon buy confirmed. The signal date was the second lowest price in the last 48 days. Our December newsletter: ‘a price low typically forms during the capitulation and before we see hash rate recover. Sometimes the first candle of the miner capitulation is the price low.’

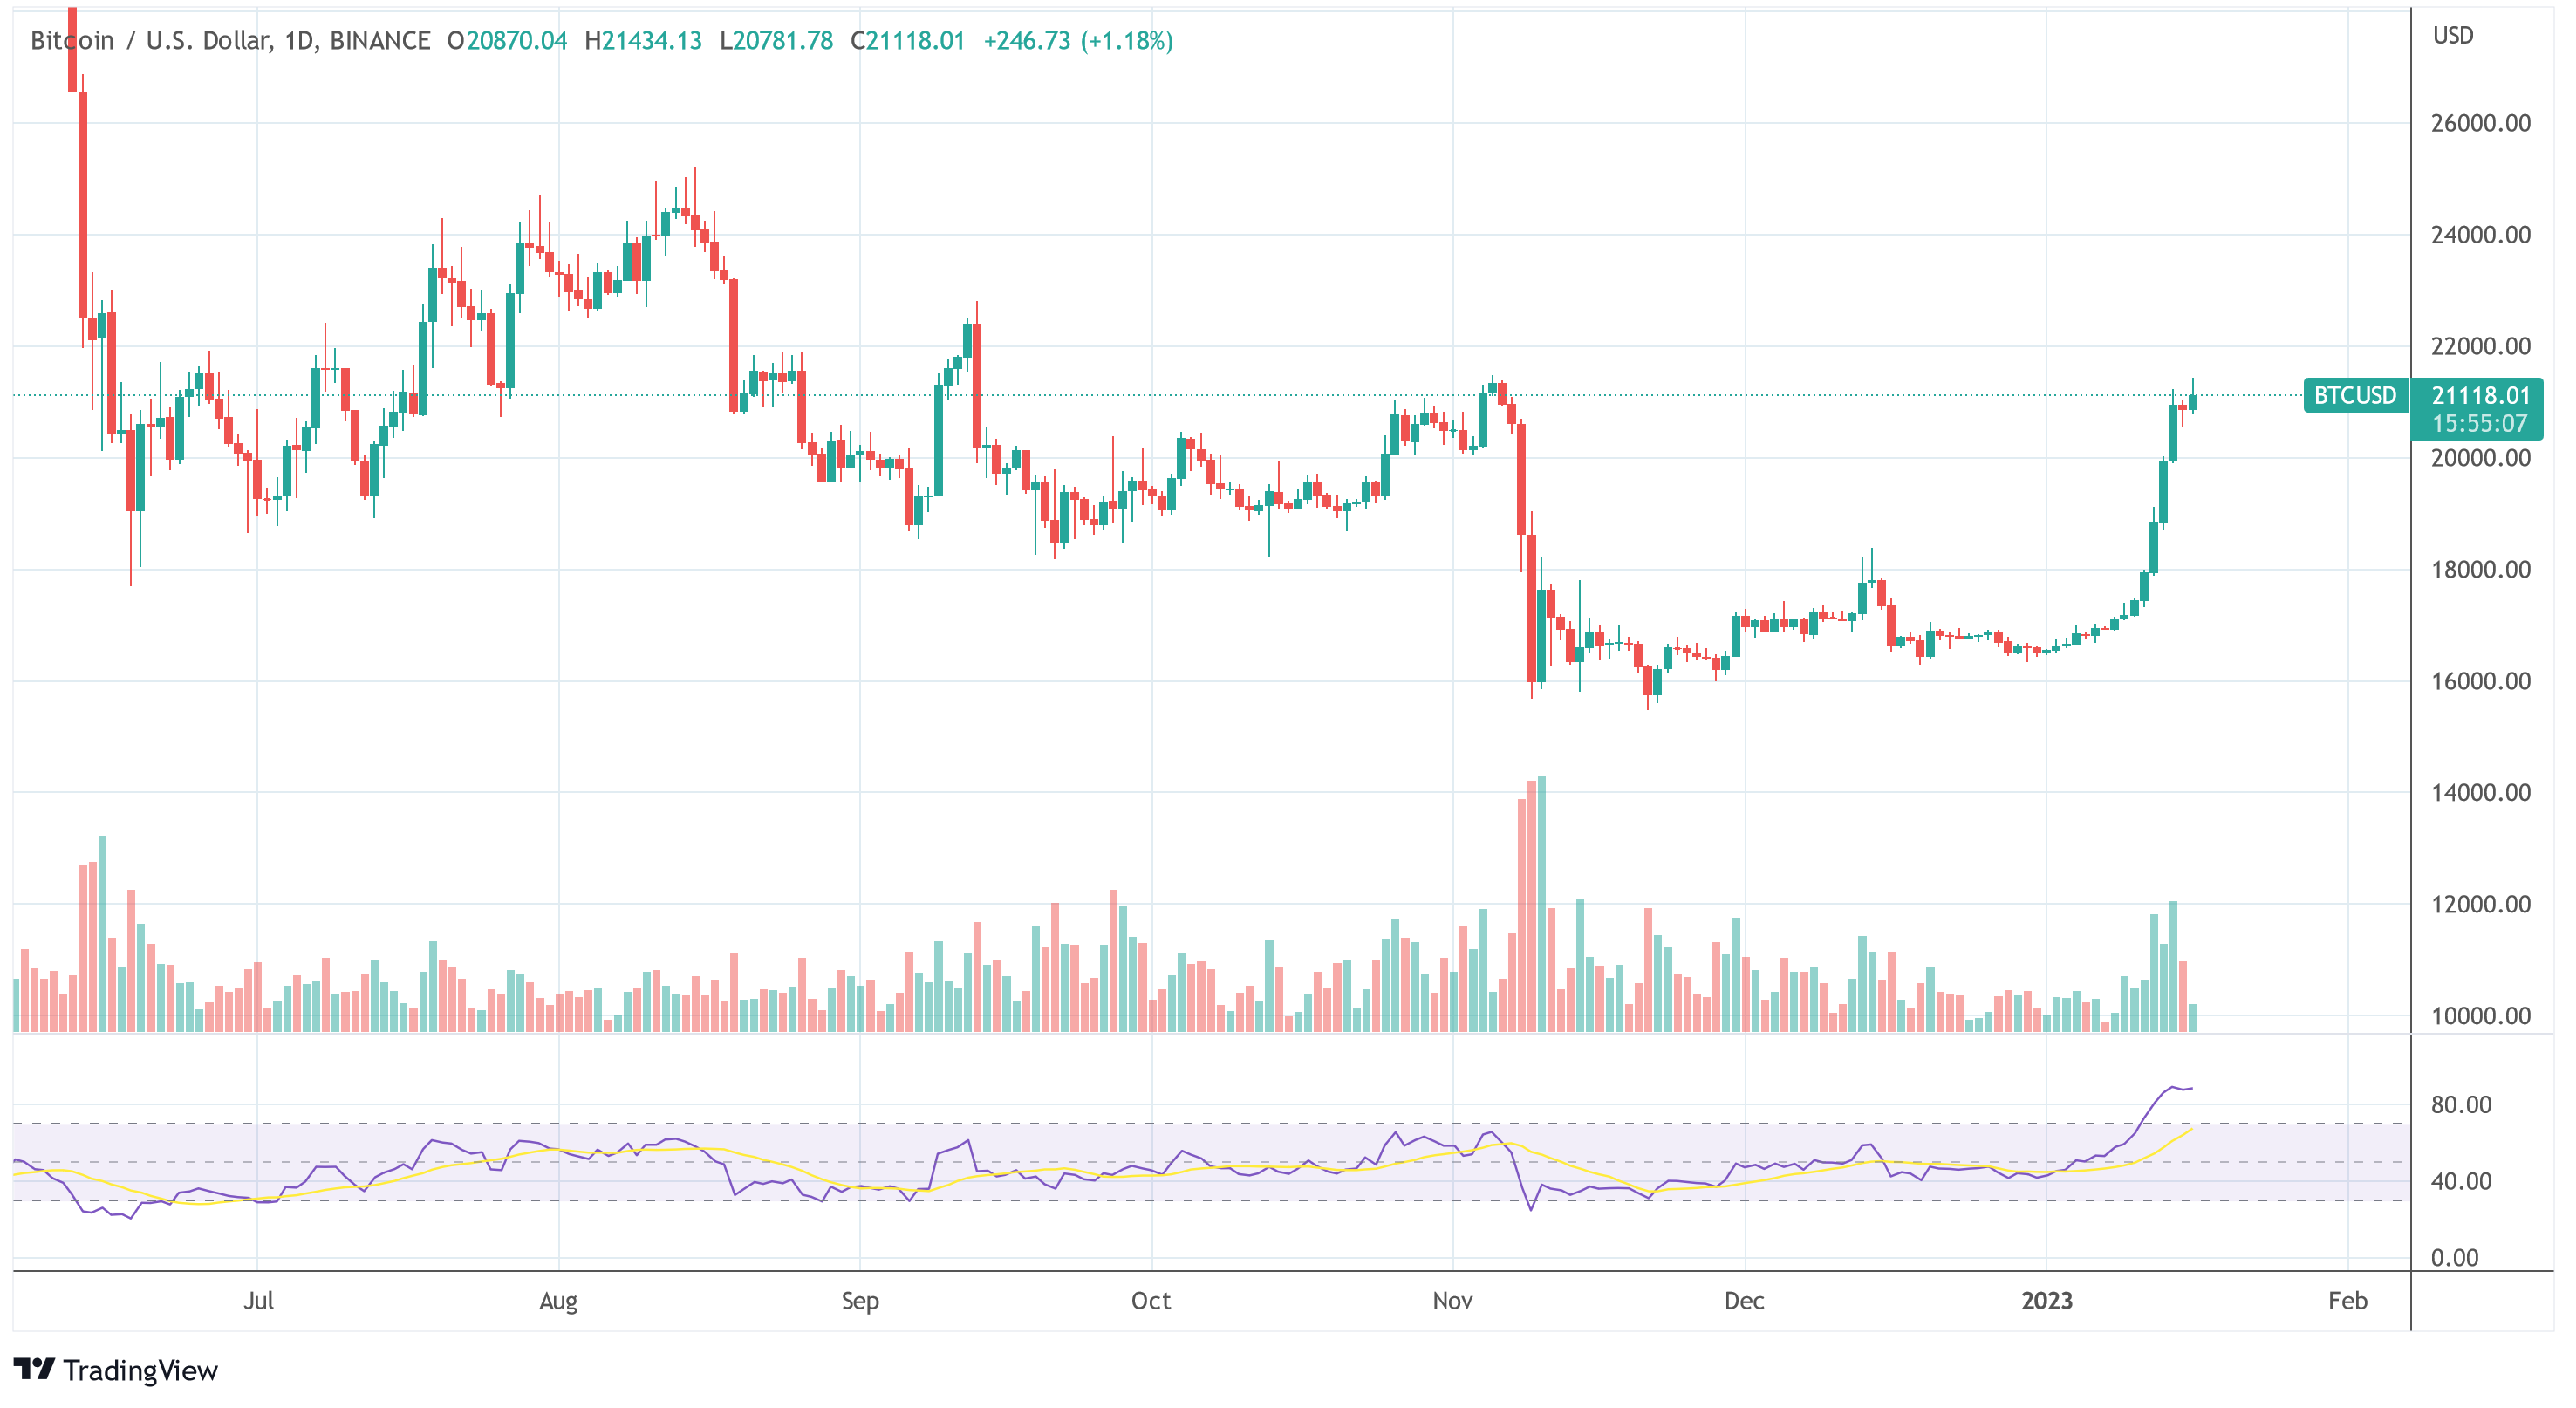
At press time, Bitcoin was trading at $21,118. On the daily chart, the RSI was at 89, indicating an overbought territory.

Bitcoin price BTC USD

Five Signs That The Bitcoin Bottom Is In

Bitcoin price was slashed in half during the month of May, leaving today as the last day for bulls to make a stand and undo the worst monthly on record.

Even if the blood stain is left behind on the price chart for good, that doesn’t mean bulls still can’t pull off an upset and push prices higher. Here are five signs that Bitcoin price has bottomed out, or will be soon.

The Signals Showing The Bitcoin Bottom Is Near

Just as extreme bullish sentiment and exuberance around mid-April was the local top of the 2021 rally so far, the current level could also act as the bottom now that sentiment has shift to the polar opposite.

A hidden bull div has formed on daily support | Source: BTCUSD on TradingView.com

Contrarian investors and traders suggest buying the fear or blood in the streets, but that’s still not the reason to think the bottom is in.

Related Reading | Building The Case That The Bitcoin Bottom Is In

Rather, technicals on nearly all timeframes point to a reversal in the making. The first ever cryptocurrency is forming a bullish divergence (above) while at daily support. The bounce happened once the Relative Strength Index hit oversold levels.

The logarithmic MACD shows momentum is turning upward | Source: BTCUSD on TradingView.com

The daily LMACD is also turning upward, showing that bulls are attempting to regain momentum on daily timeframes after a month of mayhem.

Moving up to a higher timeframe, Bitcoin price has also bounced at a rising trendline of RSI support on the three-day chart (below).

Bitcoin bounced off a high timeframe RSI support trend line | Source: BTCUSD on TradingView.com

But Wait, There’s More Reasons To Be Bullish On BTC

If that’s not enough to believe there’s a low-timeframe reversal in the making, on higher timeframes there’s still many more reasons to be bullish.

Related Reading | Don’t Have A Cow: Bart Simpson Is Back In Bitcoin

The rarely-looked-at two-week timeframe shows that Bitcoin fell to the middle-SMA on the Bollinger Bands. During the last bull market, the line was never lost. In fact, touching it resulted in the finally impulse upward.

The two-week middle-BB was retested only once during the last bull run | Source: BTCUSD on TradingView.com

The recent push down also caused Bitcoin’s most profitable buy signal to indicate “capitulation” in BTC miners. Past bull markets saw more than 8,000% and 3,500% after the last buy signal appeared per cycle.

The most profitable buy signal in crypto is about to trigger | Source: BTCUSD on TradingView.com

Nearly every time the signal appears, more upside is on the way. So why would this time be any different?

With so many signals stacking up, chances that the cryptocurrency is near the bottom are becoming more likely. Drawdowns post buy signal are still common, however, the potential reward has historically always outweighed the risk in terms of ROI versus loss.

Featured image from iStockPhoto, Charts from TradingView.com