Chainlink’s (LINK) Outlook Grows Bleak: Signals of Bearish Continuation Surface

Chainlink’s LINK price is struggling to surpass the $13.80 resistance. The price could continue to move down if it breaks the $13.00 support.

  • Chainlink price is showing bearish signs below the $14.00 resistance against the US dollar.
  • The price is trading below the $13.60 level and the 100 simple moving average (4 hours).
  • There is a key bearish trend line forming with resistance near $13.50 on the 4-hour chart of the LINK/USD pair (data source from Kraken).
  • The price could start a decent increase if it clears the $13.80 resistance zone.

Chainlink (LINK) Price Turns Red

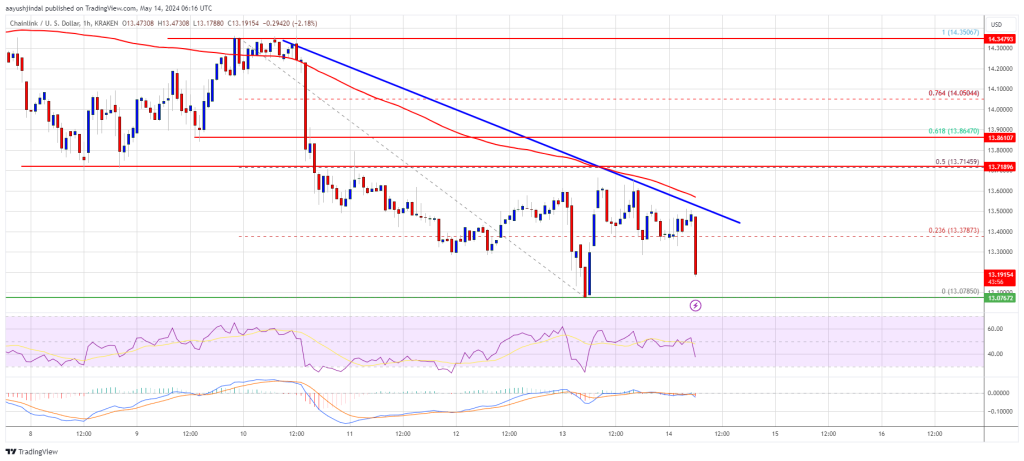
In the past few days, Chainlink saw a steady decline from well above the $13.80 level. LINK price declined below the $13.50 support level to enter a short-term bearish zone, like Bitcoin and Ethereum.

The price tested the $13.10 support zone. A low was formed at $13.07 and the price recently attempted a recovery wave. There was a move above the $13.50 level. It even jumped above the 23.6% Fib retracement level of the downward move from the $14.30 swing high to the $13.07 low.

However, the bears were active below the $13.80 resistance and the 50% Fib retracement level of the downward move from the $14.30 swing high to the $13.07 low. LINK price is still trading below the $13.80 level and the 100 simple moving average (4 hours).

Immediate resistance is near the $13.50 level. There is also a key bearish trend line forming with resistance near $13.50 on the 4-hour chart of the LINK/USD pair.

Chainlink (LINK) Price

The next major resistance is near the $13.80 zone. A clear break above $13.80 may possibly start a steady increase toward the $14.00 level. The next major resistance is near the $14.35 level, above which the price could test $15.50.

More Losses?

If Chainlink’s price fails to climb above the $13.50 resistance level, there could be a fresh decline. Initial support on the downside is near the $13.10 level.

The next major support is near the $12.80 level, below which the price might test the $12.20 level. Any more losses could lead LINK toward the $11.50 level in the near term.

Technical Indicators

4 hours MACD – The MACD for LINK/USD is gaining momentum in the bearish zone.

4 hours RSI (Relative Strength Index) – The RSI for LINK/USD is now below the 50 level.

Major Support Levels – $13.10 and $12.80.

Major Resistance Levels – $13.50 and $13.80.
LINK Price Eyes Recovery If It’s Able to Hold One Crucial Level

Chainlink’s LINK price retested the $12.00 support zone. The price is now eyeing a recovery wave above the $13.50 and $15.00 resistance levels.

  • Chainlink price is showing bearish signs below the $15.00 resistance against the US dollar.
  • The price is trading below the $14.20 level and the 100 simple moving average (4 hours).
  • There is a key bearish trend line forming with resistance near $13.50 on the 4-hour chart of the LINK/USD pair (data source from Kraken).
  • The price could start a decent increase if it clears the $15.00 resistance zone.

Chainlink (LINK) Price Eyes Steady Increase

In the past few days, Chainlink saw a major decline from well above the $18.00 level. LINK price declined below the $15.00 pivot level to enter a short-term bearish zone, like Bitcoin and Ethereum.

The price tested the $12.00 support zone. A low was formed at $11.92 and the price is now attempting a recovery wave. There was a move above the $12.50 level. It even jumped above the 23.6% Fib retracement level of the downward move from the $18.66 swing high to the $11.92 low.

LINK price is still trading below the $14.20 level and the 100 simple moving average (4 hours). Immediate resistance is near the $13.50 level. There is also a key bearish trend line forming with resistance near $13.50 on the 4-hour chart of the LINK/USD pair.

LINK Price

Source: LINKUSD on TradingView.com

The next major resistance is near the $15.00 zone. A clear break above $15.00 may possibly start a steady increase toward the $16.00 level or the 61.8% Fib retracement level of the downward move from the $18.66 swing high to the $11.92 low. The next major resistance is near the $18.00 level, above which the price could test $20.00.

More Losses?

If Chainlink’s price fails to climb above the $13.50 resistance level, there could be a fresh decline. Initial support on the downside is near the $12.80 level.

The next major support is near the $12.00 level, below which the price might test the $10.80 level. Any more losses could lead LINK toward the $10.00 level in the near term.

Technical Indicators

4 hours MACD – The MACD for LINK/USD is gaining momentum in the bearish zone.

4 hours RSI (Relative Strength Index) – The RSI for LINK/USD is now below the 50 level.

Major Support Levels – $12.80 and $12.00.

Major Resistance Levels – $13.50 and $14.00.

LINK Price Regains Strength, Why Chainlink Could Surge Over 10%

Chainlink’s LINK price is moving higher above the $20.00 resistance. The price is now up over 5% and might aim for a move toward the $25.00 resistance.

  • Chainlink price is showing positive signs above $20.00 against the US dollar.
  • The price is trading above the $20.50 level and the 100 simple moving average (4 hours).
  • There was a break above a key bearish trend line with resistance near $20.00 on the 4-hour chart of the LINK/USD pair (data source from Kraken).
  • The price could rally further if it clears the $22.00 resistance zone.

Chainlink (LINK) Price Eyes More Upsides

In the past few sessions, Chainlink bulls were able to send the price above a few key hurdles at $18.50. Earlier, LINK price formed a base above the $16.75 and started a fresh increase.

There was a break above a key bearish trend line with resistance near $20.00 on the 4-hour chart of the LINK/USD pair. The bulls pumped the pair above the $22.00 level. A new multi-month high was formed at $22.85 before the price started a downside correction.

There was a move below the $22.00 level. The price declined below the 23.6% Fib retracement level of the upward move from the $16.75 swing low to the $22.85 high.

LINK is now trading above the $20.50 level and the 100 simple moving average (4 hours). The price is up over 5% and outpacing both Bitcoin and Ethereum. If the bulls remain in action, the price could rise further. Immediate resistance is near the $21.80 level.

LINK Price

Source: LINKUSD on TradingView.com

The next major resistance is near the $22.00 zone. A clear break above $22.00 may possibly start a steady increase toward the $23.00 and $24.20 levels. The next major resistance is near the $24.80 level, above which the price could test $25.00.

Are Dips Limited?

If Chainlink’s price fails to climb above the $22.00 resistance level, there could be a downside correction. Initial support on the downside is near the $21.00 level.

The next major support is near the $20.00 level or the 50% Fib retracement level of the upward move from the $16.75 swing low to the $22.85 high, below which the price might test the $18.80 level. Any more losses could lead LINK toward the $17.65 level in the near term.

Technical Indicators

4 hours MACD – The MACD for LINK/USD is gaining momentum in the bullish zone.

4 hours RSI (Relative Strength Index) – The RSI for LINK/USD is now above the 50 level.

Major Support Levels – $21.00 and $20.00.

Major Resistance Levels – $22.00 and $23.00.

Chainlink Breakout: LINK Poised For 38% Rally If It Clears This Key Resistance

Decentralized oracle network Chainlink (LINK) has been making significant strides in the altcoin market, outperforming its peers with an impressive 44.8% price increase over the past 30 days. 

Surging to a 24-month high, the cryptocurrency has inched closer to the $20 mark, attracting the attention of bullish investors. Notably, the uptrend for LINK may be far from over, as it can potentially record a substantial 38% price gain by breaking through a critical resistance level.

Chainlink Trading Volume Skyrockets

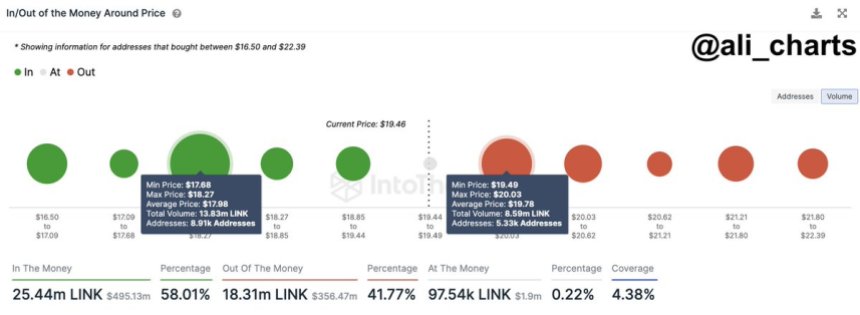
Crypto analyst Ali Martinez indicates that Chainlink faces formidable resistance between its current trading price of $19.40 and $20.03, with 5,330 addresses collectively holding over 8.59 million LINK. 

Chainlink

Despite this supply wall, if Chainlink manages to break through, Ali Martinez suggests that the next critical resistance level stands at $26.87, presenting an opportunity for a significant 38% price surge.

Adding to the positive outlook, Chainlink has witnessed a surge in trading volume and an increase in circulating market cap over the past few days. 

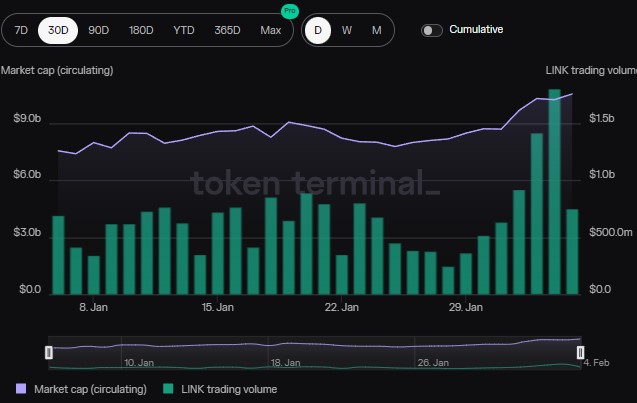
Data from Token Terminal reveals that while Chainlink’s trading volume has steadily risen over the past 30 days, the token experienced exceptional trading volume of over $9.5 billion in the past three days alone. This surge in trading activity suggests a growing interest from investors in the Chainlink protocol.

Chainlink

Examining the circulating market cap, Token Terminal data highlights a positive trend. The circulating market cap of Chainlink stands at $10.53 billion, displaying a notable increase of 32.66% over the past 30 days. In terms of fully diluted market cap, Chainlink records $18.16 billion, indicating a substantial rise of 28.89% over the same period.

Institutional Interest In LINK?

Recent blockchain data suggests that institutional investors are actively accumulating LINK. According to Spot On Chain data, the emergence of eight wallets withdrawing a substantial amount of LINK tokens, coupled with a price surge shortly after, indicates institutional interest in the cryptocurrency. 

Over the past twelve hours, eight new wallets, likely representing a single individual or institution, have collectively withdrawn 227,350 LINK tokens, equivalent to approximately $4.12 million at the withdrawal time. 

Notably, a significant portion of these tokens was withdrawn from centralized exchanges (CEX) just before the price experienced a sudden increase of approximately 4.1%. This pattern suggests that institutions may strategically accumulate LINK tokens, anticipating future price appreciation.

Moreover, as indicated by its performance on the algorithmic market scanner Commando, LINK has consistently been a top performer in the cryptocurrency market. 

According to the market intelligence platform Decentrader, with a current score of 1.83 and a green signal on low time frames, Chainlink’s technical analysis suggests a positive outlook for the cryptocurrency. Noteworthy is the recent breakthrough of Chainlink’s price from a range held up by the 200-week moving average (200WMA). 

This breakout indicates a shift in market sentiment and a potential upward trend. The cryptocurrency is now aiming to target the “Sniper resistance” level just above $20 while finding support at the top of the previous range, around $16.8, according to Decentrader. 

Overall, institutions’ accumulation of Chainlink tokens and the cryptocurrency’s technical breakout point to growing confidence in LINK’s investment potential. 

The withdrawals from centralized exchanges suggest a desire to hold LINK tokens outside exchange custody, possibly indicating a longer-term investment strategy. 

Chainlink

Currently, LINK is trading at $19.7, up 8% in the last 24 hours.

Featured image from Shutterstock, chart from TradingView.com

Chainlink (LINK) Price Breaks Out Of Bullish Flag Pole, Here’s The Next Target

The Chainlink (LINK) price has been on an impressive rally over the last week that has brought its price to new yearly highs. As LINK bulls continue to hold firmly above the $18 support, the emergence of this bullish rally has continued to signal that the price surge is far from over.

Crypto Analyst Says Chainlink Bullish Flag Has Been Broken

In an analysis posted on the TradingView website, crypto analyst CobraVanguard explains why the Chainlink price is currently very bullish. According to the analyst, despite the altcoin showing very bullish signs, a lot of traders are failing to realize that this is the case.

They identified a flag pole that was created in the chart, and in this case, the flag for the LINK price was actually bullish. Even more interesting is the fact that the analyst revealed that the Chainlink price had successfully broken this flag, which they say is bullish for the price.

Chainklink price chart from Tradingview.com

“LINKUSDT is in a Bullish flag Patter,” the analyst said. “We can expect a bullish movement as much as the Measured Price movement (flag pole) to happen!” This further solidifies LINK’s entrance into its most bullish phase so far in 2024.

Another major factor that the analyst identifies for the LINK price at this level is that the price was testing the major supply zone at $18. At the time, the LINK price had not cleared this level. But at the time of writing, LINk has broken clean off this major supply zone and is now trending toward $19. “The Flag Is Broken,” the crypto analyst declared.

What Are The Targets For The LINK Price?

In the chart shared in the analysis, the crypto analyst identifies two major points of interest in the Chainlink chart and these are the Supply Zone and the Target Price. The first, which is the Supply Zone, is at $18.3, and the LINK price has already broken above this level.

Given this, the next major point of interest is the Target Price, and CobraVanguard puts this at the $27 price level. However, there is no straight shot toward this level as the analyst’s chart also shows a correction below the $13 support before rallying onto its target.

If this analysis holds over the coming days/weeks, then the LINK price could see a sharp 20% correction as the first sign. Then from there, a complete 100% move upward to bring the price to the $27 price target.

At the time of writing, LINK bulls continue to show dominance after a sharp 7% move in the last day. On the broader chart, the LINK price is up 27% in the last week, bringing its market cap to $10.9 billion.

LINK price chart from Tradingview.com (LINK Crypto analyst)

Chainlink (LINK) Breakout: Accumulation Zone Points To Upside Potential, $20 In Sight

The decentralized Oracle network Chainlink and its native token LINK have grown impressively in the past month. Despite experiencing a correction since late December, where LINK reached a 20-month high of $17.6, the token has shown signs of renewed bullish momentum. 

Key Resistance Levels For LINK’s Price Rally

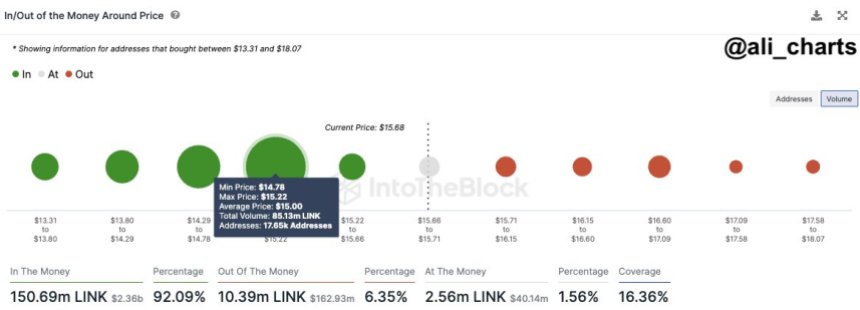
Renowned crypto analyst Ali Martinez has identified a robust demand zone for Chainlink between $14.8 and $15.2, slightly below its current trading price of $15.415. 

Within this range, many addresses (17,650) purchased 85.12 million LINK. With limited resistance, LINK appears to be well-positioned to advance towards the $20 mark.

Chainlink

Based on the analyst’s observations, if the current bullish momentum witnessed over the past seven days persists, LINK could swiftly reach the $20 price level. Looking at LINK’s 1-day chart, the next resistance levels to overcome before potentially climbing toward $20 are $15.55, $16.69, and $16.92. Breaching these levels would pave the way for a clear path towards the $20 milestone.

However, it is important to note that in the absence of major resistance walls, the battle for the next direction of LINK’s movements remains equally balanced. In the event of another price correction or selling pressure, the token lacks significant support walls to rely on.

Chainlink

Analyzing LINK’s 1-day chart, the first support level in the event of a drop would be around $14.22. If this level is breached, the next support stands at $13.31. A further decline could test the support at the $11 price level. A breach of this level could signify a breakdown in the four-month bullish structure of LINK.

Chainlink Ecosystem Growth

Despite the battle for supremacy between LINK’s bulls and bears, the protocol’s ecosystem has shown notable growth in key metrics since the last update. For example, Chainlink’s circulating market capitalization is $8.35 billion, reflecting a positive growth rate of 3.58%.

According to Token Terminal data, in terms of revenue over the past 30 days, Chainlink has generated $11.67 thousand. However, this figure shows a decline of 54.16% compared to the previous period, indicating a decrease in earnings during this timeframe.

Considering the fully diluted market capitalization, which considers the maximum number of Chainlink tokens that could exist in the future, the value stands at $14.82 billion. This metric has experienced a slight increase of 3.48% recently.

When it comes to revenue on an annual basis, Chainlink has generated $219.81 thousand. This represents a positive growth rate of 2.64%, indicating an upward trend in the company’s earnings over a year.

Regarding financial ratios, Chainlink’s price-to-fully-diluted ratio is calculated at an astonishing 68,246.47x. This metric compares the company’s market capitalization to its fully diluted market capitalization. It reflects the premium investors will pay for each unit of potential future tokens.

Similarly, based on the fully diluted market capitalization, the price-to-sales ratio is reported to be 68,246.47x. This ratio measures the company’s valuation relative to its annualized revenue and indicates how much investors will pay for each dollar of sales generated.

Featured image from Shutterstock, chart from TradingView.com 

LINK Price Rallies Over 5%, A New Uptrend In Making For Chainlink?

Chainlink’s LINK price is moving higher above the $15.00 resistance. The price is now up over 5% and might aim for a move toward the $18.00 resistance.

  • Chainlink price is showing positive signs above $14.50 against the US dollar.
  • The price is trading above the $15.00 level and the 100 simple moving average (4 hours).
  • There was a break above a key bearish trend line with resistance near $14.85 on the 4-hour chart of the LINK/USD pair (data source from Kraken).
  • The price could rally further if it clears the $16.40 resistance zone.

Chainlink (LINK) Price Eyes More Upsides

In the past few sessions, Chainlink bulls were able to send the price above a few key hurdles at $14.50. Earlier, LINK price formed a base above the $12.50 and started a fresh increase.

There was a break above a key bearish trend line with resistance near $14.85 on the 4-hour chart of the LINK/USD pair. The bulls pumped the pair above the 50% Fib retracement level of the downward move from the $17.59 swing high to the $12.50 low.

LINK is now trading above the $15.00 level and the 100 simple moving average (4 hours). The price is up over 5% and outpacing both Bitcoin and Ethereum. If the bulls remain in action, the price could rise further. Immediate resistance is near the 61.8% Fib retracement level of the downward move from the $17.59 swing high to the $12.50 low at $15.65.

Chainlink (LINK)

Source: LINKUSD on TradingView.com

The next major resistance is near the $16.40 zone. A clear break above $16.40 may possibly start a steady increase toward the $17.50 and $18.00 levels. The next major resistance is near the $18.80 level, above which the price could test $20.00.

Are Dips Limited?

If Chainlink’s price fails to climb above the $15.65 resistance level, there could be a downside correction. Initial support on the downside is near the $14.50 level.

The next major support is near the $13.70 level, below which the price might test the $13.00 level. Any more losses could lead LINK toward the $12.50 level in the near term.

Technical Indicators

4 hours MACD – The MACD for LINK/USD is gaining momentum in the bullish zone.

4 hours RSI (Relative Strength Index) – The RSI for LINK/USD is now above the 50 level.

Major Support Levels – $15.00 and $14.50.

Major Resistance Levels – $15.65 and $16.50.

Chainlink Staking Program Exceeds Expectations, Drives LINK Price Up By 12%

In a significant development for the blockchain data-oracle project, Chainlink (LINK) has witnessed a significant response to its enhanced crypto-staking program, amassing over $632 million worth of its LINK tokens within a remarkably short period. 

The company announced a recent press release highlighting the “overwhelming demand” during the early-access period, which filled the staking limit in just six hours.

Chainlink Unveils Staking v0.2

Chainlink, recognized as the industry-standard decentralized computing platform, unveiled Chainlink Staking v0.2, the latest upgrade to the protocol’s native staking mechanism. 

The Early Access phase has commenced, inviting eligible participants to stake up to 15,000 LINK tokens. This phase will last four days before transitioning into the General Access phase, enabling investors to stake up to 15,000 LINK tokens as long as the staking pool remains unfilled. 

Per the announcement, the upgrade introduces an expanded pool size of 45,000,000 LINK tokens, equivalent to 8% of the current circulating supply. This enlargement aims to enhance the accessibility of Chainlink Staking, enabling a more diverse audience of LINK token holders to participate. 

Staking forms an integral part of Chainlink Economics 2.0, which brings an additional layer of cryptoeconomic security to the Chainlink Network. Specifically, Chainlink Staking empowers ecosystem participants, including node operators and community members, to support the performance of Oracle services by staking LINK tokens and earning rewards for contributing to network security.

While v0.1 served as the initial phase of the Staking program, v0.2 has been restructured into a fully modular, extensible, and upgradable Staking platform. Building upon the lessons learned from the previous release, the v0.2 beta version focuses on several key objectives. 

Chainlink is introducing several new features to enhance its staking program. These include a new unbinding mechanism that provides more flexibility for Community and Node Operator Stakers.

Additionally, security guarantees for Oracle services are being reinforced by slashing node operator stakes. A modular architecture is being adopted to support future improvements and additions, and a dynamic rewards mechanism is being introduced to seamlessly accommodate new external sources of rewards in the future, such as user fees.

Following the conclusion of the Early Access phase on December 11, 2023, the v0.2 staking pool will transition to General Access. At this stage, anyone will have the opportunity to stake up to 15,000 LINK tokens.

LINK Surges To New Yearly High

Given Chainlink’s successful upgrade, LINK, the native token of the decentralized computing platform, experienced a significant surge of 12%, reaching a price as high as $17.305. 

This price level has not been seen since April 2022, signifying a new yearly high for the cryptocurrency. However, LINK has retraced slightly and is currently trading at $16.774.

Crypto analyst Ali Martinez has highlighted a critical support zone for Chainlink. Martinez noted that over 17,000 addresses purchased 47 million LINK tokens from $14.4 to $14.8. 

This accumulation by many addresses suggests strong buying interest in this price range, potentially acting as a support level for the token.

Chainlink

While the support zone may hold and trigger a rebound in the price of LINK, Martinez cautions that investors should remain vigilant. Any signs of weakness, such as a breach of the support zone or negative market sentiment, could prompt investors to sell their LINK holdings to avoid losses.

It remains to be seen whether LINK can maintain its position above these critical levels and whether the broader cryptocurrency market will enter an accumulation phase or experience a retracement after the significant upward movement witnessed in recent weeks. 

Such a retracement could potentially impact LINK’s price and lead to a test of the support above levels. On the other hand, the token faces immediate resistance at $17.483, $18.069, and $18.910. These represent the final hurdles to overcome before LINK reaches the $20 milestone.

Featured image from Shutterstock, chart from TradingView.com 

LINK Price Pumps 40% In Three Days, Why Bulls Are Not Done Yet

Chainlink’s LINK price is up over 40% and trading above $10. The bulls seem to be in control and might aim a rally toward the $12 resistance.

  • Chainlink price is gaining pace above the $10.00 resistance against the US dollar.
  • The price is trading above the $10.00 level and the 100-day simple moving average.
  • There is a key bullish trend line forming with support near $8.60 on the daily chart of the LINK/USD pair (data source from Kraken).
  • The price could continue to move up toward the $11.25 and $12.00 resistance levels.

Chainlink Price Starts Fresh Rally

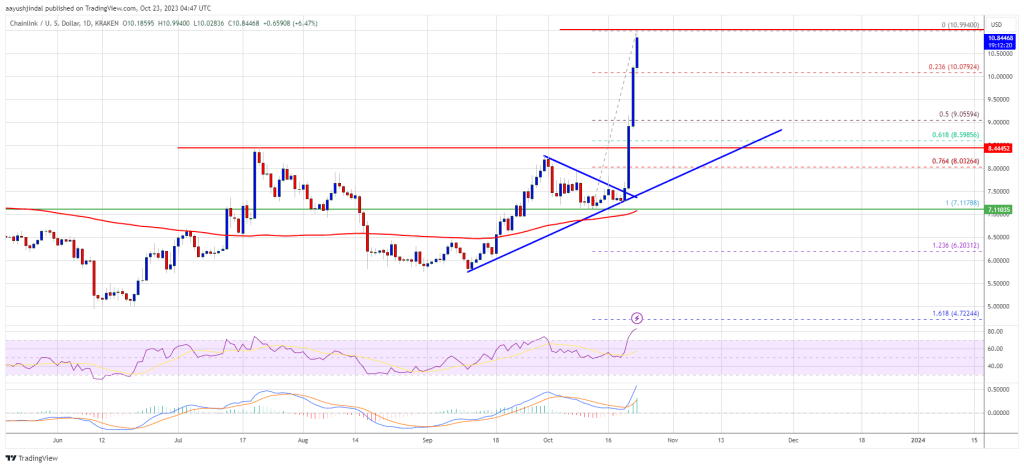
In the past few days, LINK price started a strong rally against the US Dollar. The price formed a base above the $7.00 level before the bulls stepped in. There was a major pump above the $7.50 and $8.00 resistance levels.

In the last three days, the price gained over 40% and cleared many hurdles near $9.00. The recent pump in Bitcoin also helped LINK surpass the $10.00 resistance. A new multi-week high is formed near $10.99. The price is now consolidating gains well above the 23.6% Fib retracement level of the upward move from the $7.11 swing low to the $10.99 high.

LINK is now trading above the $10.00 level and the 100 simple moving average (4 hours). There is also a key bullish trend line forming with support near $8.60 on the daily chart of the LINK/USD pair. The trend line is near the 61.8% Fib retracement level of the upward move from the $7.11 swing low to the $10.99 high.

Chainlink’s LINK price

Source: LINKUSD on TradingView.com

If there is a fresh increase, the price might face resistance near $11.20. The first major resistance is near the $12.00 zone. A clear break above $12.00 may possibly start a steady increase toward the $12.20 and $12.50 levels. The next major resistance is near the $13.20 level, above which the price could test $15.00.

Are Dips Limited in LINK?

If Chainlink fails to climb above the $11.20 resistance level, there could be a downside correction. Initial support on the downside is near the $10.00 level.

The next major support is near $9.00, below which the price might test the trend line support at $8.60. Any more losses could lead LINK toward the $8.00 level in the near term.

Technical Indicators

4 hours MACD – The MACD for LINK/USD is gaining momentum in the bullish zone.

4 hours RSI (Relative Strength Index) – The RSI for LINK/USD is now above the 50 level.

Major Support Levels – $10.00 and $9.00.

Major Resistance Levels – $11.20 and $12.00.

Chainlink (LINK) Price Hits New Highs With 22% Surge In A Single Day

Following a week dominated by Bitcoin and its positive performance, Chainlink (LINK) has emerged as one of the best performers in the crypto market this weekend. This comes after a long period of relative silence and sideways movement for the token’s price. The abrupt and significant surge in Chainlink price may have surprised many investors, but it only further highlights the volatile nature of the crypto market.

Chainlink Price Soars 22% In One Day – What’s Next?

According to data from CoinGecko, the price of Chainlink is up by more than 22% in the last 24 hours. Over the past day, LINK’s double-digit price explosion has seen the altcoin surpass the $9 mark, resulting in a multi-month high. LINK’s performance appears to be even more notable on the weekly chart, with a nearly 30% increase in the last seven days. 

Although Chainlink maintains a substantial percentage of its gain, the token’s price seems to be facing significant resistance at the $9.5 zone. This reflects the uncertain sentiment of investors who seem unsure whether the current rally is a fluke or a bullish hint. Nevertheless, a crypto analyst expects LINK to build on this positive momentum.

In a post on X (formerly Twitter), crypto trader Mags noted that the Chainlink price has just broken out of a consolidation wedge spanning more than a year. The analyst postulates that a close above $8.2 on the weekly timeframe will see the LINK price rise to $12.54. This represents a significant 30% projection from the current price point.

As of this writing, the Chainlink token is valued at $9.36. According to CoinGecko data, LINK is enjoying a 468% surge in its trading volume over the past 24 hours.

What Is Behind The Multi-Month High?

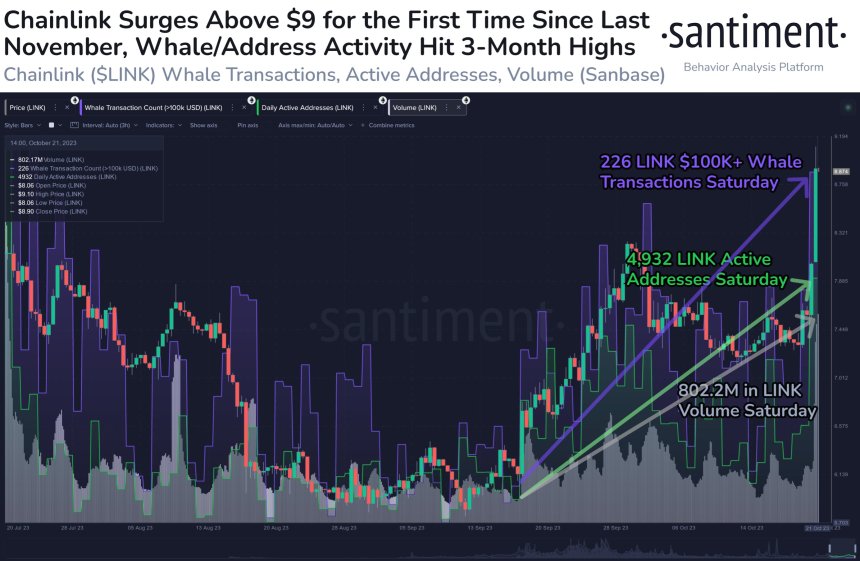
A dive into the Chainlink network activity can help understand the driving force behind the latest resurgence in LINK’s price. Interestingly, a recent report from the on-chain analytics platform Santiment offers insight into the activity levels of the network.

Santiment’s data report posted on X highlighted that Chainlink has been experiencing increased activity over the past few days. Specifically, the network witnessed significant growth – reaching three-month highs – in terms of whale transactions, active addresses, and trading volume this weekend.

Chainlink

As the highlighted chart shows, LINK saw more than 220 whale transactions above the $100,000 mark on Saturday, October 22, while nearly 5,000 unique addresses interacted with the altcoin on the same day. Furthermore, Chainlink recorded more than 800 million in LINK trading volume on Saturday.

While these data points don’t exactly indicate whether buying transactions are the prevailing activity on Chainlink, the ensuing LINK price rally suggests a possible accumulation trend.

Chainlink

LINK Price Primed For Meteoric Rise: Analyst Predicts 130% Rally To $18

The LINK price is no stranger to bullish rallies, and in September alone, the token has gone from a low of $5.8 to a peak of $7.9. Even now, bullish momentum among enthusiasts has not waned, especially with a 130% price increase prediction from a crypto analyst.

LINK Price Prediction Ahead Of October

In the analysis posted to TradingView, pseudonymous analyst Babenski explains the reasoning behind the $18 surge presented in their chart. First, it points to the $5.8 low that was recorded back in mid-September which is identified as the accumulation range.

This is not out of the ordinary given the massive buying that took place when the LINK price fell to $5.8. This accumulation was the reason behind the support that was generated shortly after, which served as the lift-off point for the rally toward $8.

Despite already seeing a nice 35% jump from its September lows, the analyst sees further upside. Putting the peak of the rally at $18 means that the LINK price could rise another 130% if it plays out as expected.

LINK price chart from Tradingview.com crypto analyst

The first roadblock is a retracement that was placed just above the $8 level, and LINK is already seeing a similar retracement after almost touching $8. Going by the analyst’s chart, the price could decline a bit further before picking up once more and then shooting straight to $18.

There is no timeframe added for when the LINK price would reach this price. But with September drawing to a close, October-November is more likely.

LINK Whales Take Initiative

The accumulation trend pointed out above has been mainly mounted by the LINK whales. Crypto analyst @ali_charts shared a chart on X (formerly Twitter) that showed that whales holding between 10,000 and 1,000 coins have been the main buyers.

According to Ali, these whales bought up more than 7.5 million tokens in a matter of weeks which translated to about $53 million spent buying LINK. As the LINK price has risen, these holders are seeing profit on their purchase, which could explain the downward correction in the LINK price in the last day.

Nevertheless, the digital asset remains bullish, especially with the whales still holding more than 206 million coins. This suggests that they are not tempted to sell into the present rally and could be holding on for higher prices.

LINK has been an impressive performer so far this week. It is up 15% on the 7-day chart, making it the best performer of the top 20 cryptocurrencies by market cap.