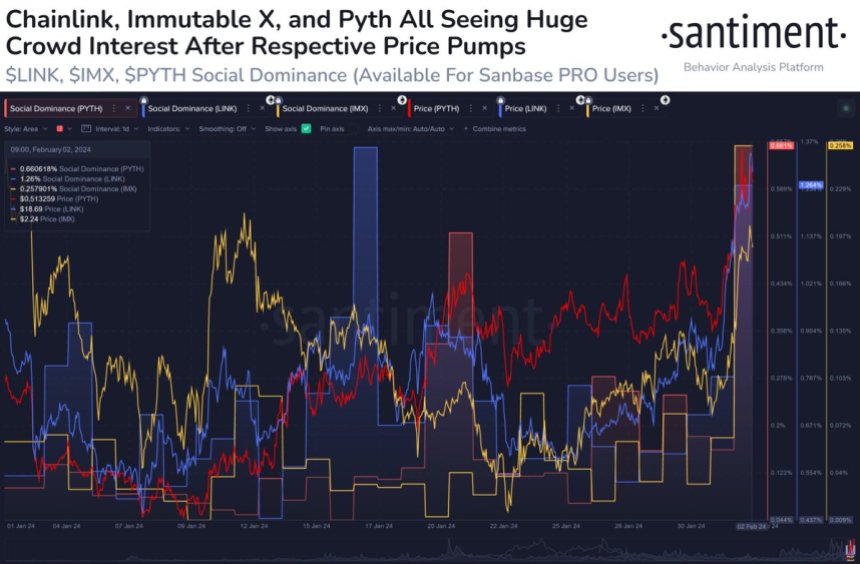
Chainlink’s LINK price is struggling to surpass the $13.80 resistance. The price could continue to move down if it breaks the $13.00 support.
- Chainlink price is showing bearish signs below the $14.00 resistance against the US dollar.
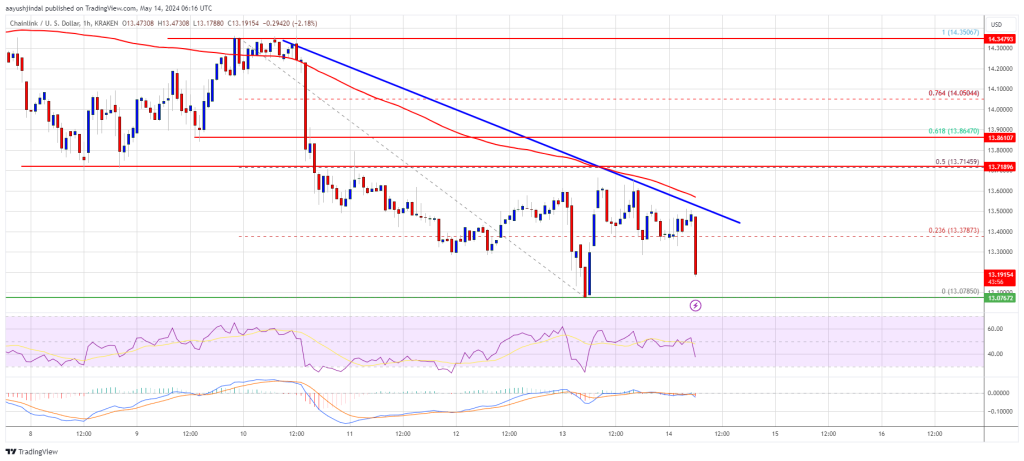
- The price is trading below the $13.60 level and the 100 simple moving average (4 hours).
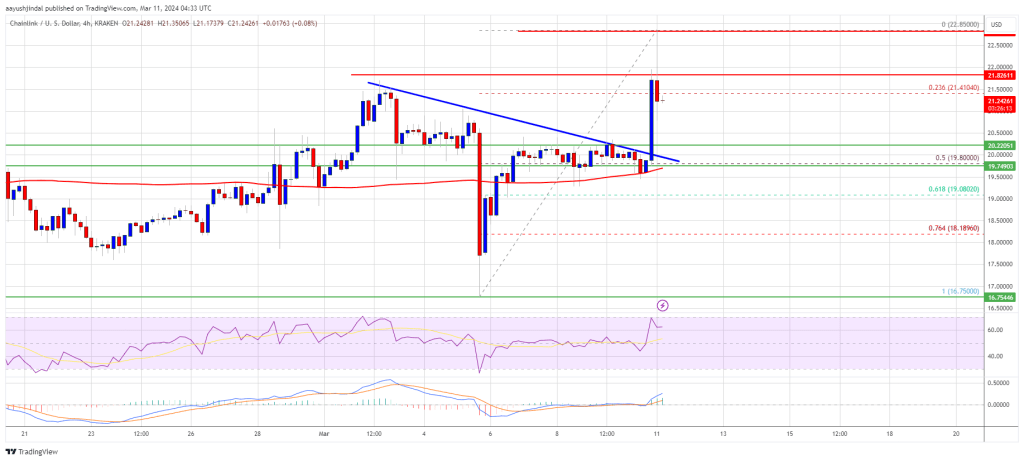
- There is a key bearish trend line forming with resistance near $13.50 on the 4-hour chart of the LINK/USD pair (data source from Kraken).
- The price could start a decent increase if it clears the $13.80 resistance zone.
Chainlink (LINK) Price Turns Red
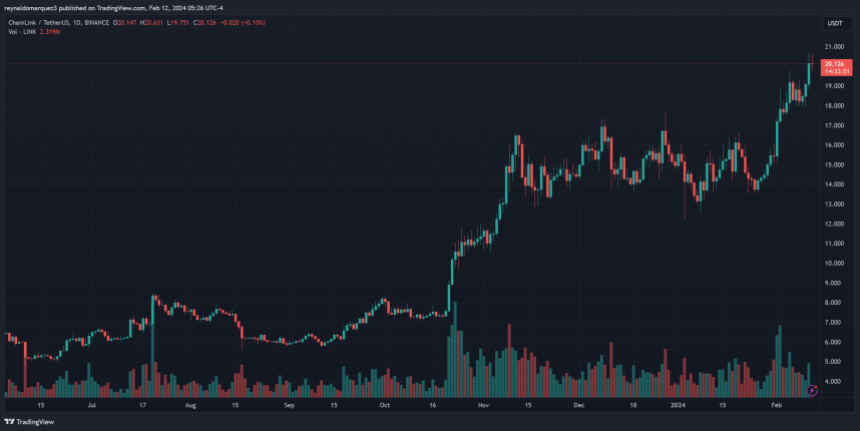
In the past few days, Chainlink saw a steady decline from well above the $13.80 level. LINK price declined below the $13.50 support level to enter a short-term bearish zone, like Bitcoin and Ethereum.
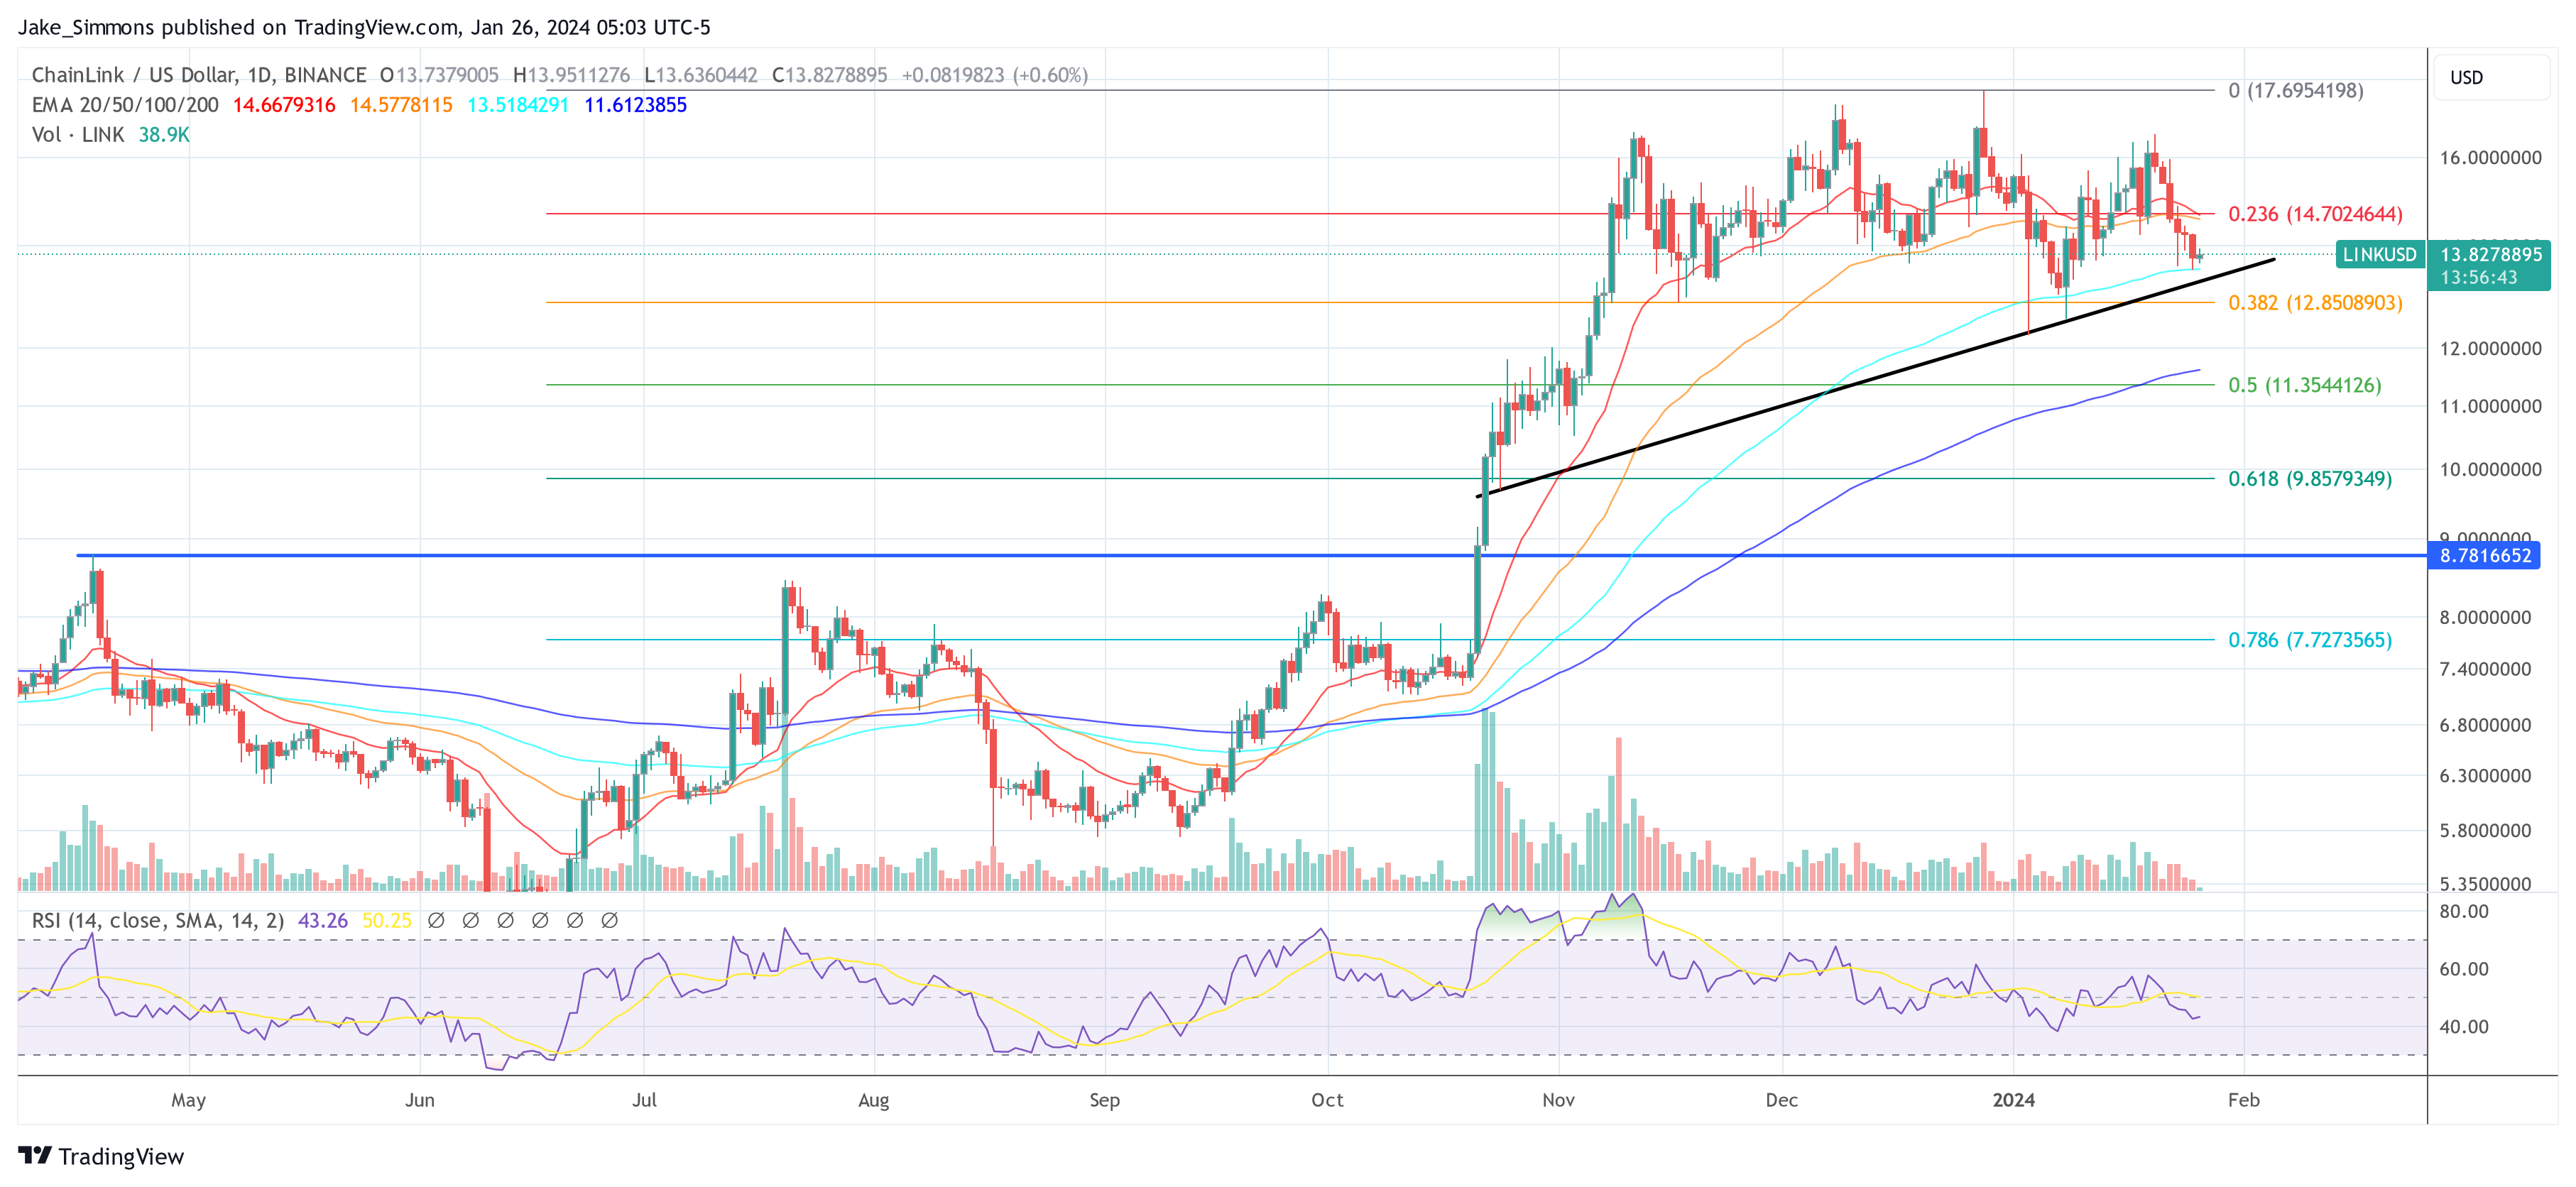
The price tested the $13.10 support zone. A low was formed at $13.07 and the price recently attempted a recovery wave. There was a move above the $13.50 level. It even jumped above the 23.6% Fib retracement level of the downward move from the $14.30 swing high to the $13.07 low.
However, the bears were active below the $13.80 resistance and the 50% Fib retracement level of the downward move from the $14.30 swing high to the $13.07 low. LINK price is still trading below the $13.80 level and the 100 simple moving average (4 hours).
Immediate resistance is near the $13.50 level. There is also a key bearish trend line forming with resistance near $13.50 on the 4-hour chart of the LINK/USD pair.
The next major resistance is near the $13.80 zone. A clear break above $13.80 may possibly start a steady increase toward the $14.00 level. The next major resistance is near the $14.35 level, above which the price could test $15.50.
More Losses?
If Chainlink’s price fails to climb above the $13.50 resistance level, there could be a fresh decline. Initial support on the downside is near the $13.10 level.
The next major support is near the $12.80 level, below which the price might test the $12.20 level. Any more losses could lead LINK toward the $11.50 level in the near term.
Technical Indicators
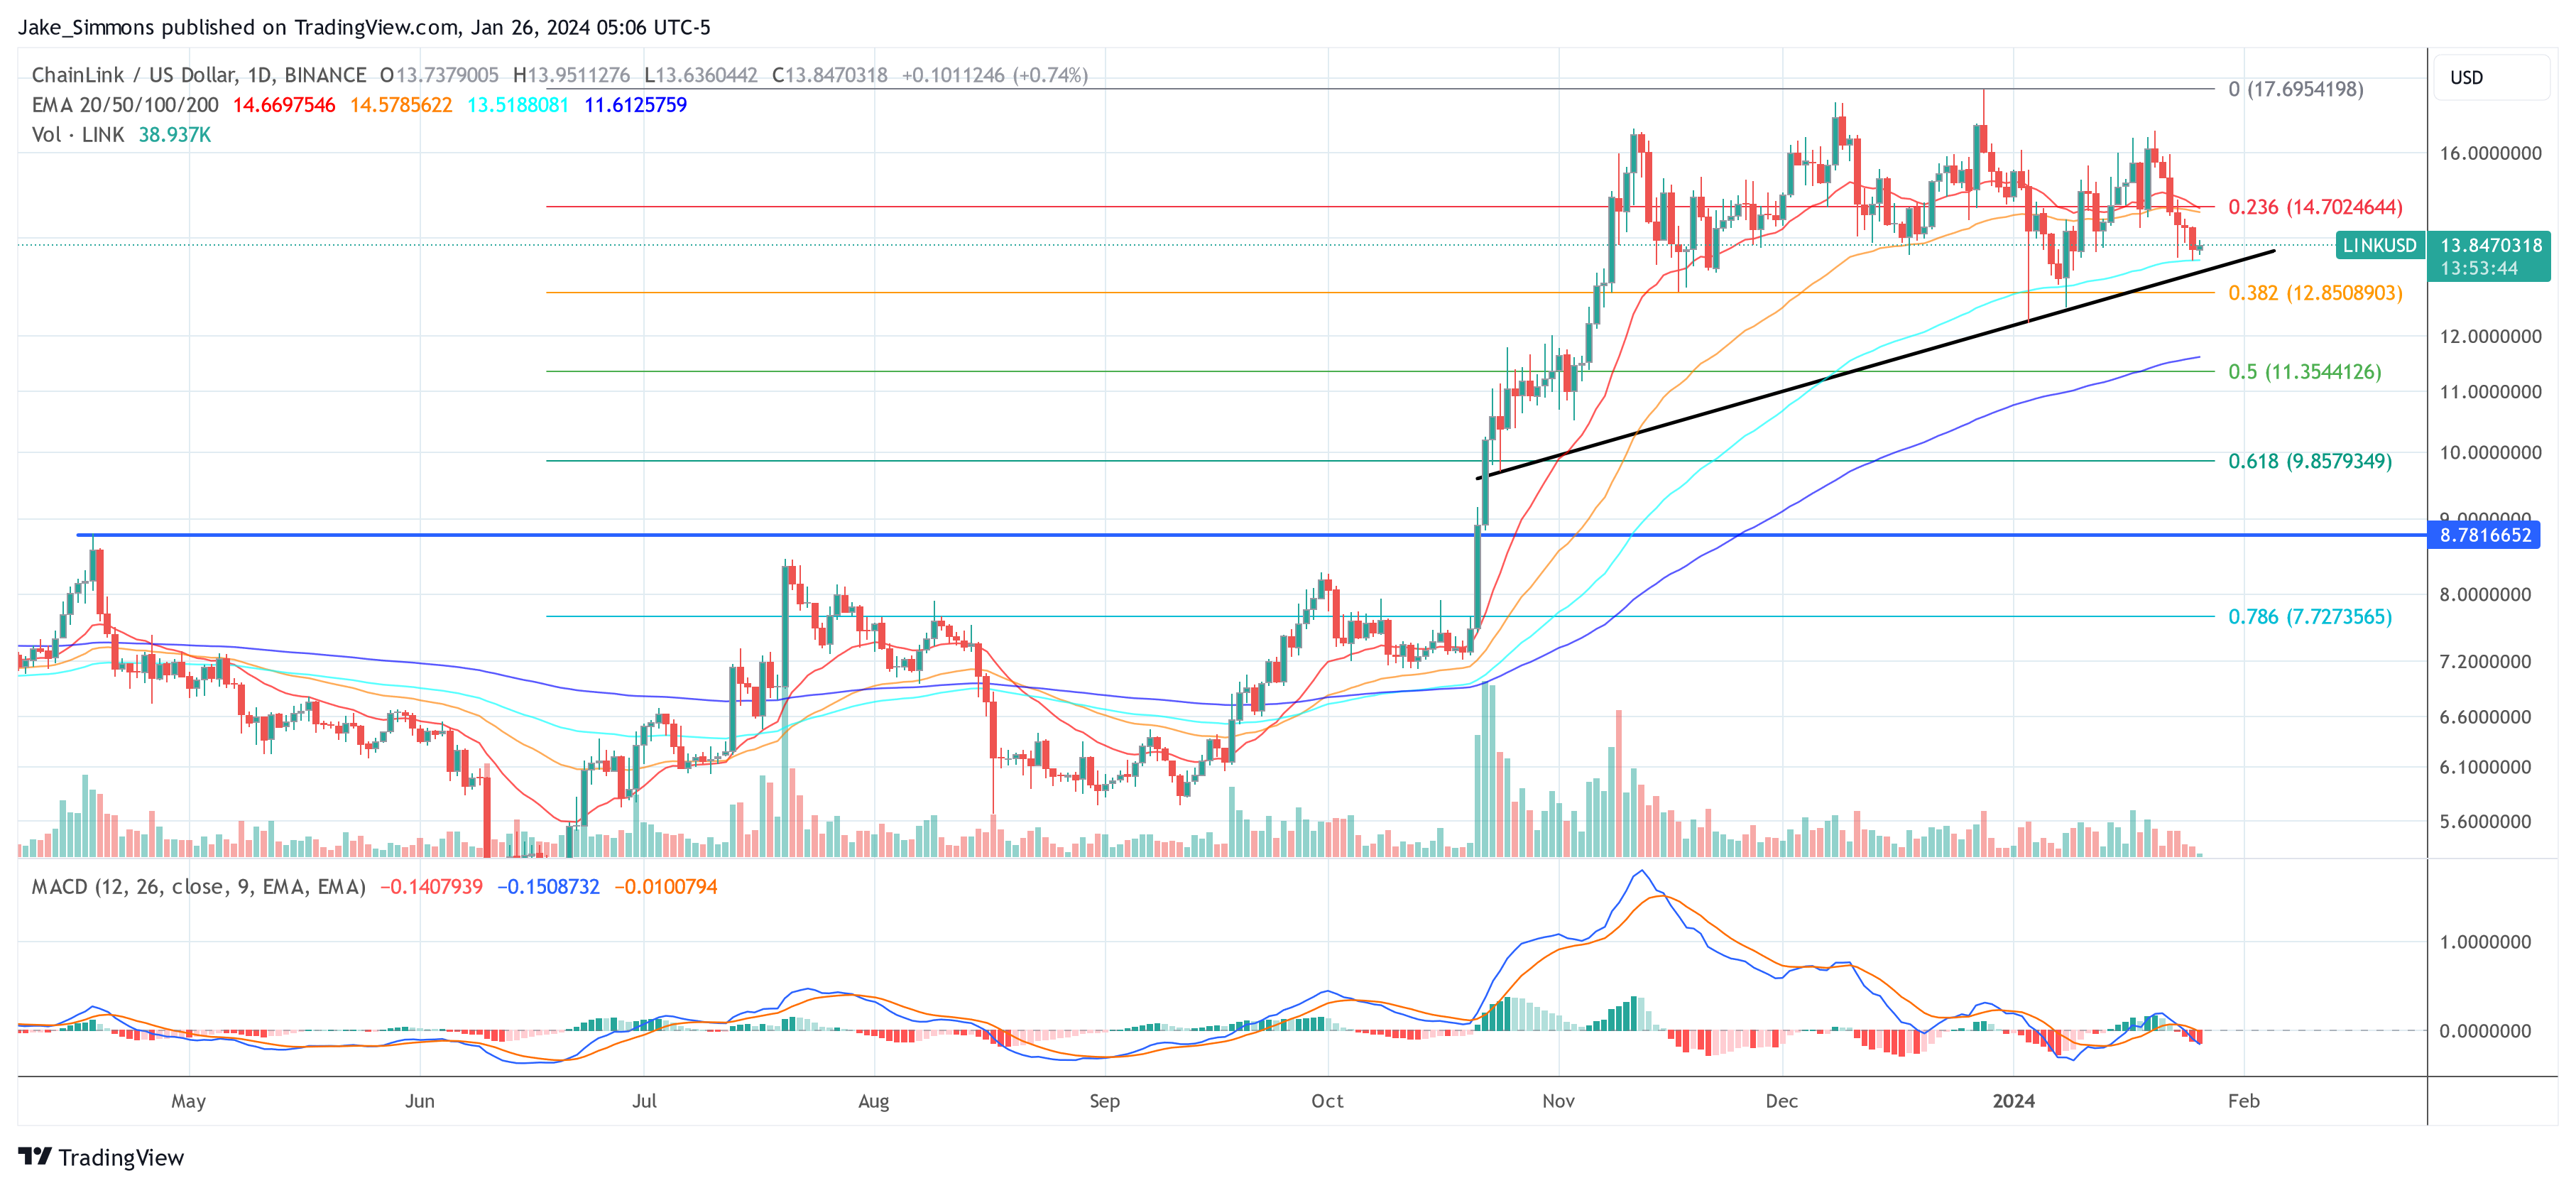
4 hours MACD – The MACD for LINK/USD is gaining momentum in the bearish zone.
4 hours RSI (Relative Strength Index) – The RSI for LINK/USD is now below the 50 level.
Major Support Levels – $13.10 and $12.80.
Major Resistance Levels – $13.50 and $13.80.
 800,000