These Altcoins Are Showing High Social Dominance After Recent Price Swings

According to crypto intelligence platform Santiment, some altcoins have been enjoying increased attention from investors over the past few days. This comes as the crypto market continues to undergo a positive recovery from its recent slump in the aftermath of the Bitcoin ETF launch.

These Altcoins Show Potential For More Profit: Santiment

In a post on the X platform, Santiment revealed that three altcoins, including Chainlink (LINK), Immutable X (IMX), and Pyth (PYTH), have become assets of mainstream interest in the past few days. 

This revelation is based on their performance in terms of Social Dominance, an indicator that compares the social volume of a particular asset to the combined social volume of the top 100 cryptocurrencies by market capitalization. 

Altcoins

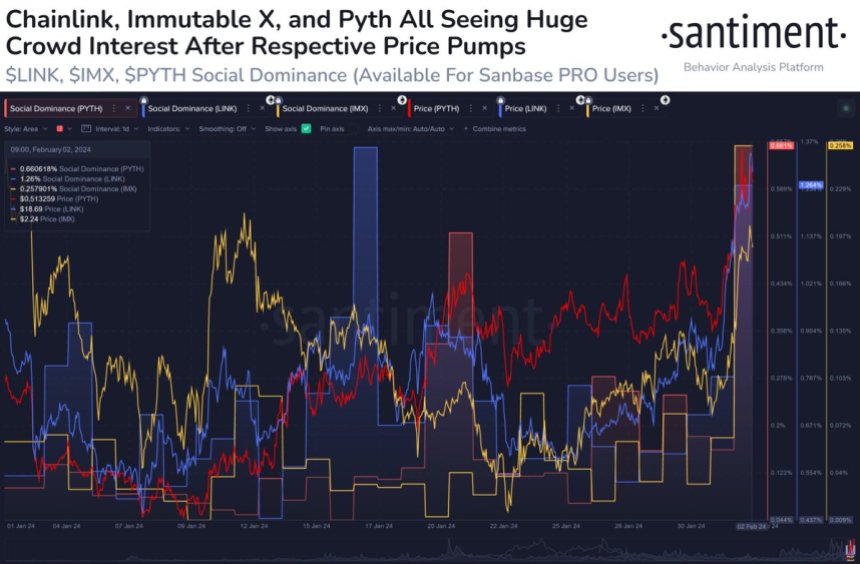
As shown in the chart above, the Social Dominance of these three altcoins has seen a notable spike in recent days. Interestingly, Santiment has associated this renewed investor interest in Chainlink, Immutable X, and Pyth, with their market cap growth in the past week.

According to data from Santiment, the valuations of LINK, IMX, and PYTH have increased by 34%, 23%, and 26%, respectively, in the last seven. The on-chain analytics noted that the mainstream crowd discussion around these altcoins will lead to FOMO (fear of missing out) amongst investors.

Santiment further highlighted that this FOMO can trigger high price volatility and increased buying pressure for Chainlink, Immutable X, and Pyth. Ultimately, this can lead to more price gains for the three crypto assets.

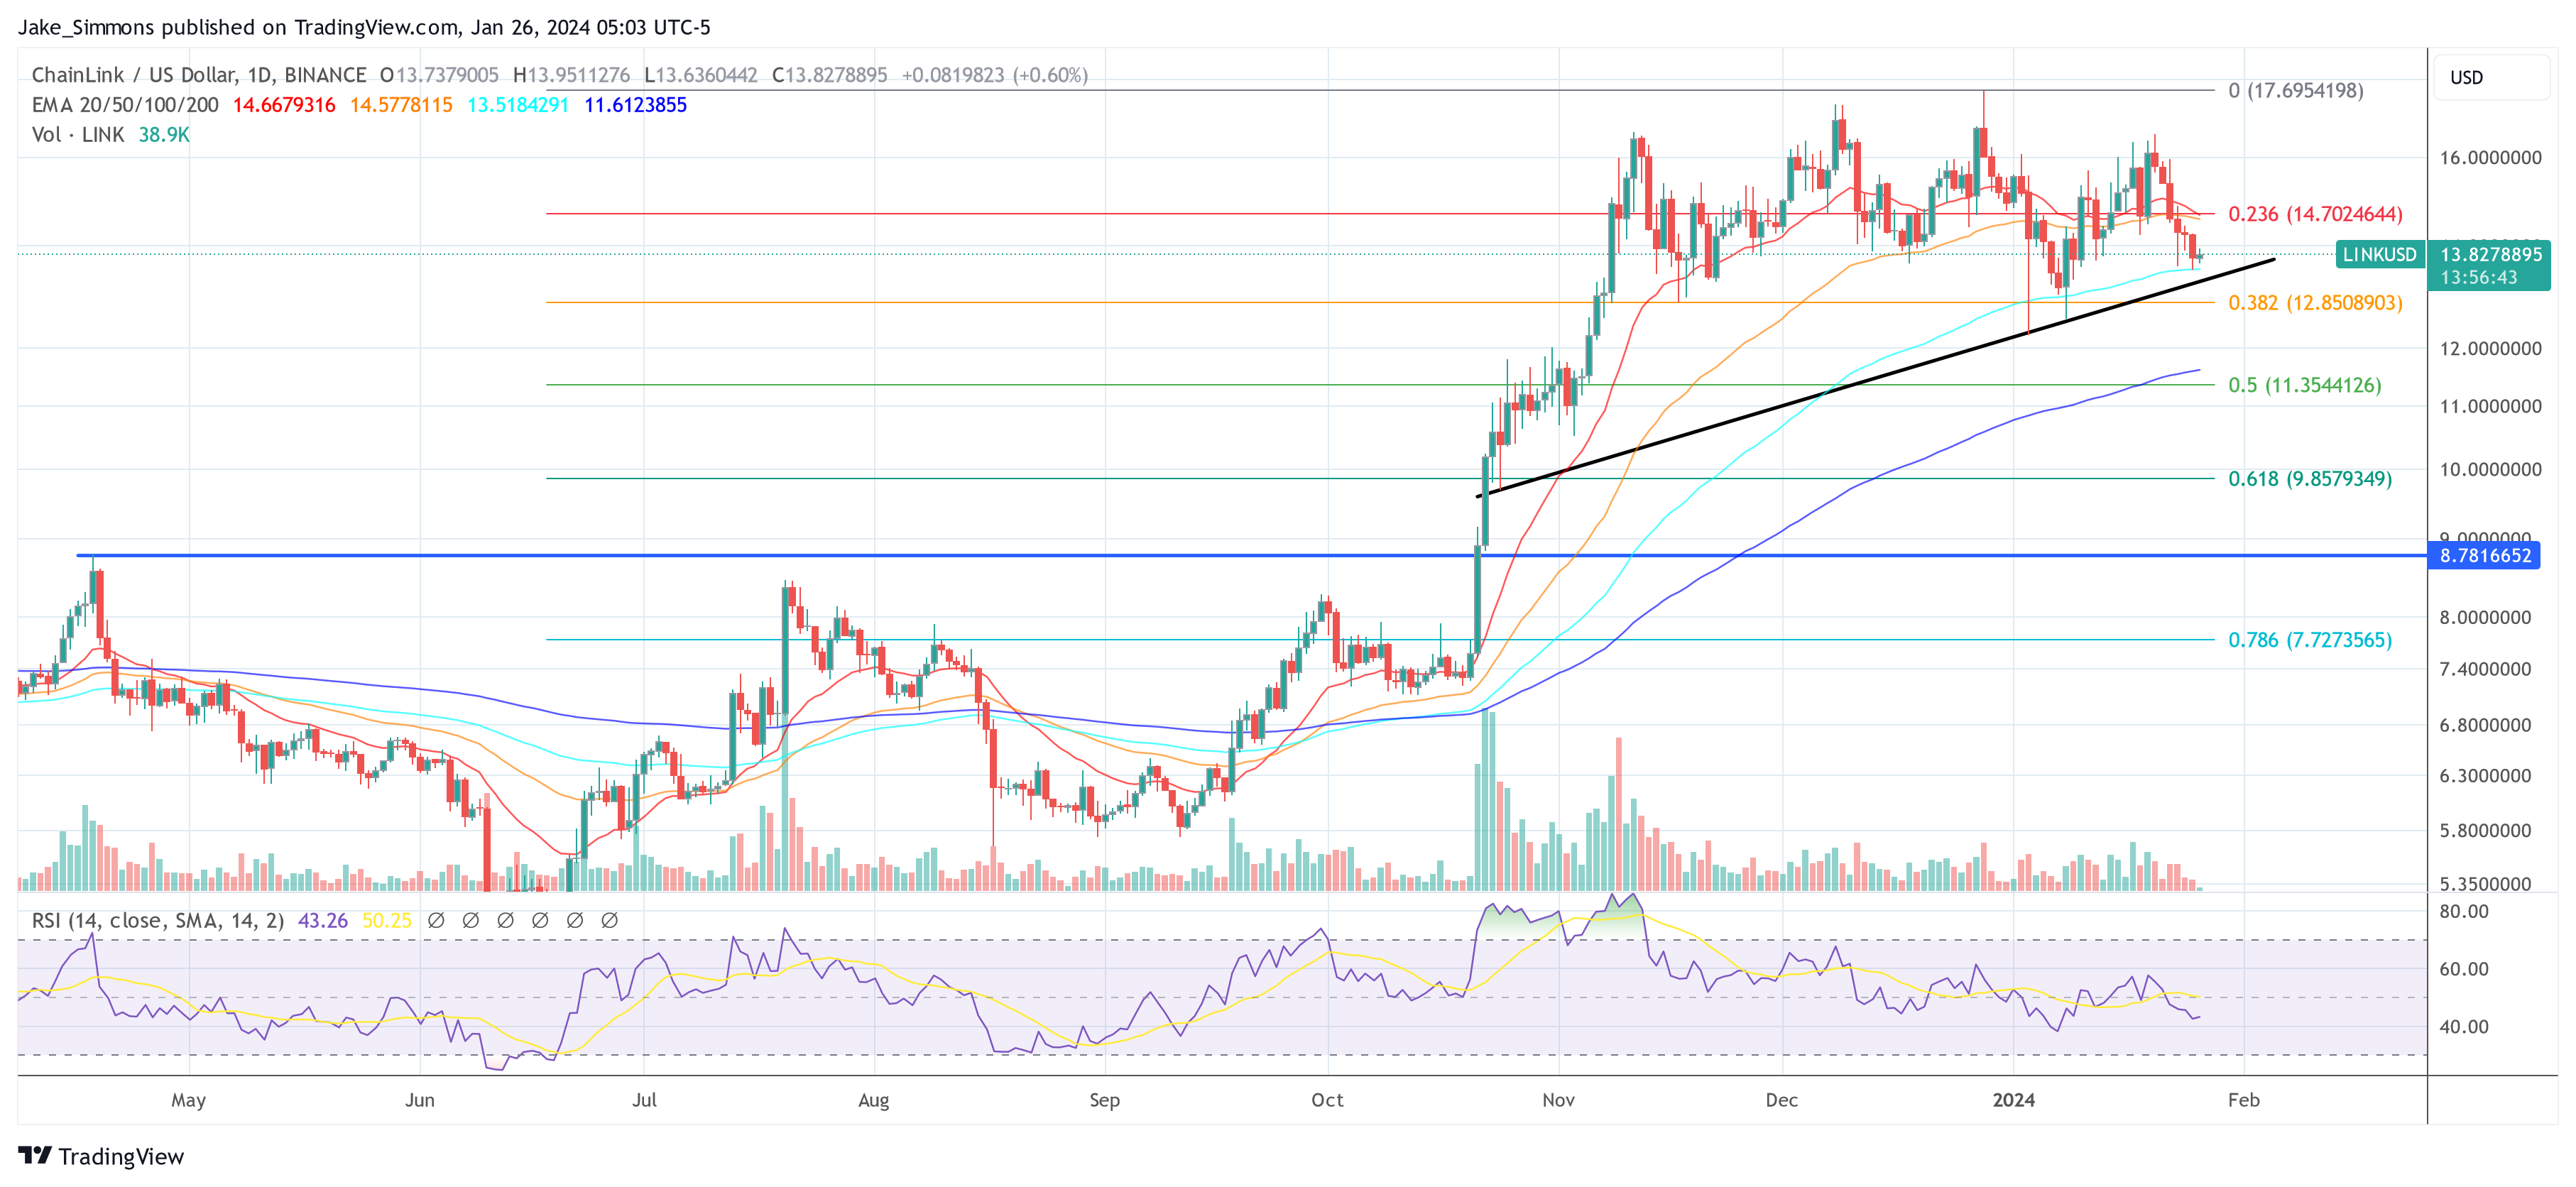
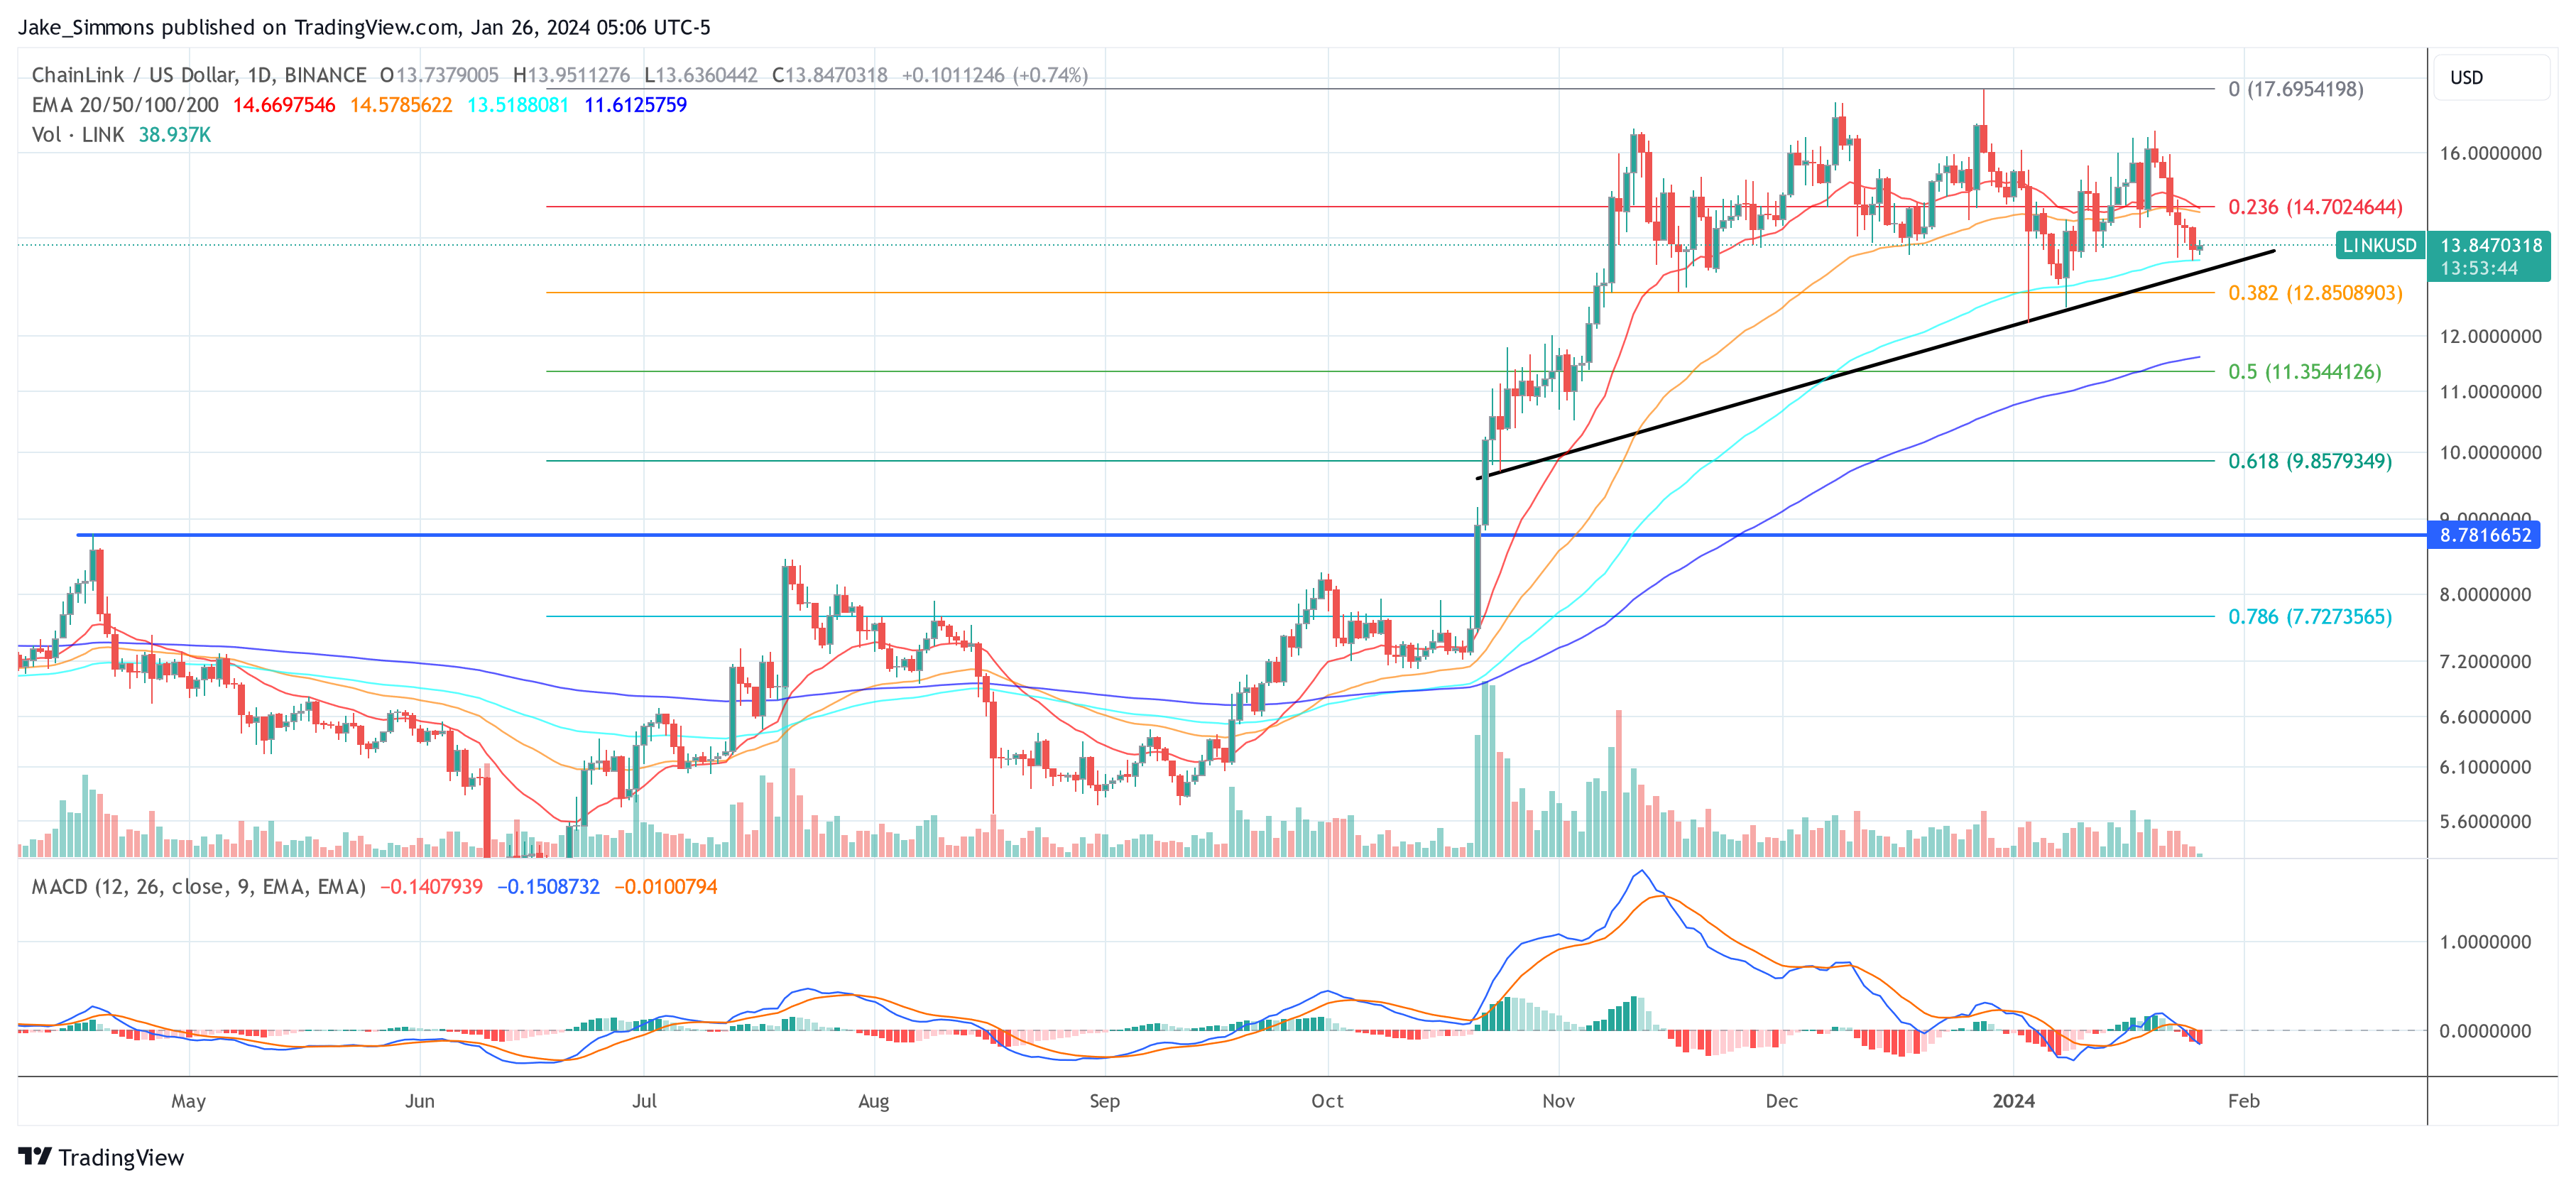
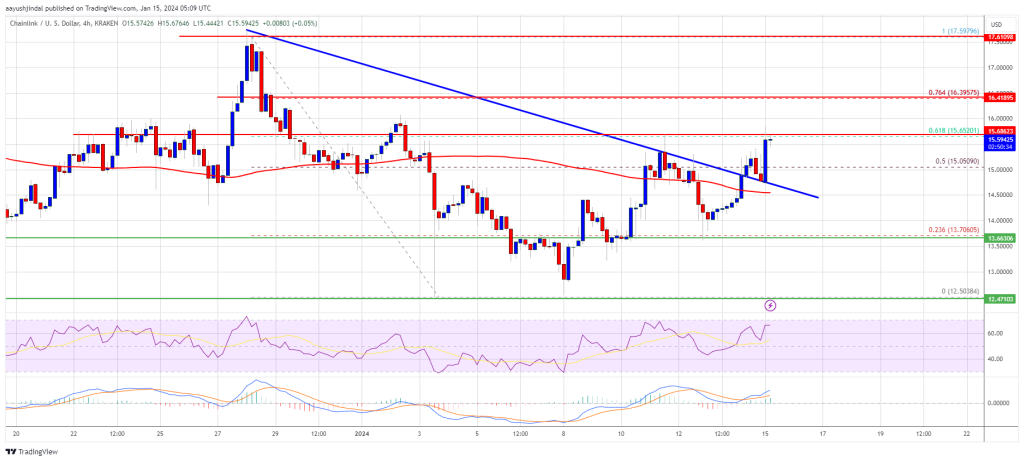
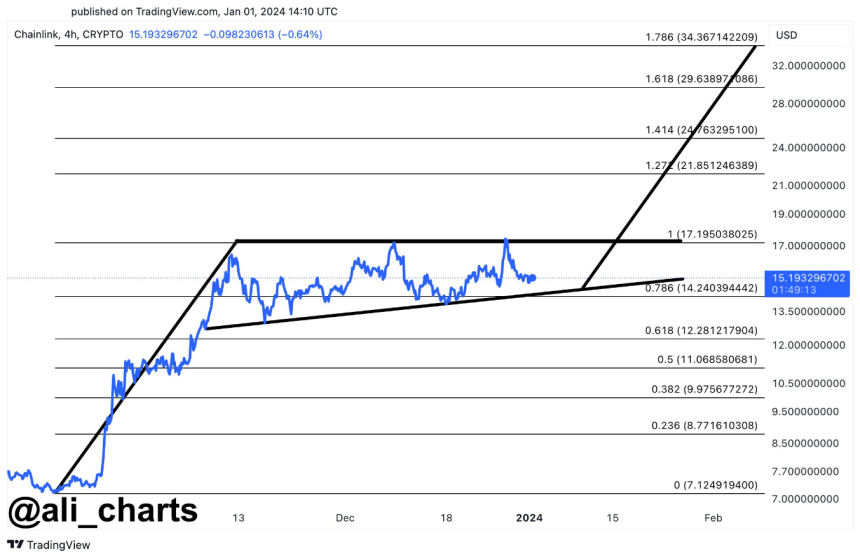
Chainlink Price Overview

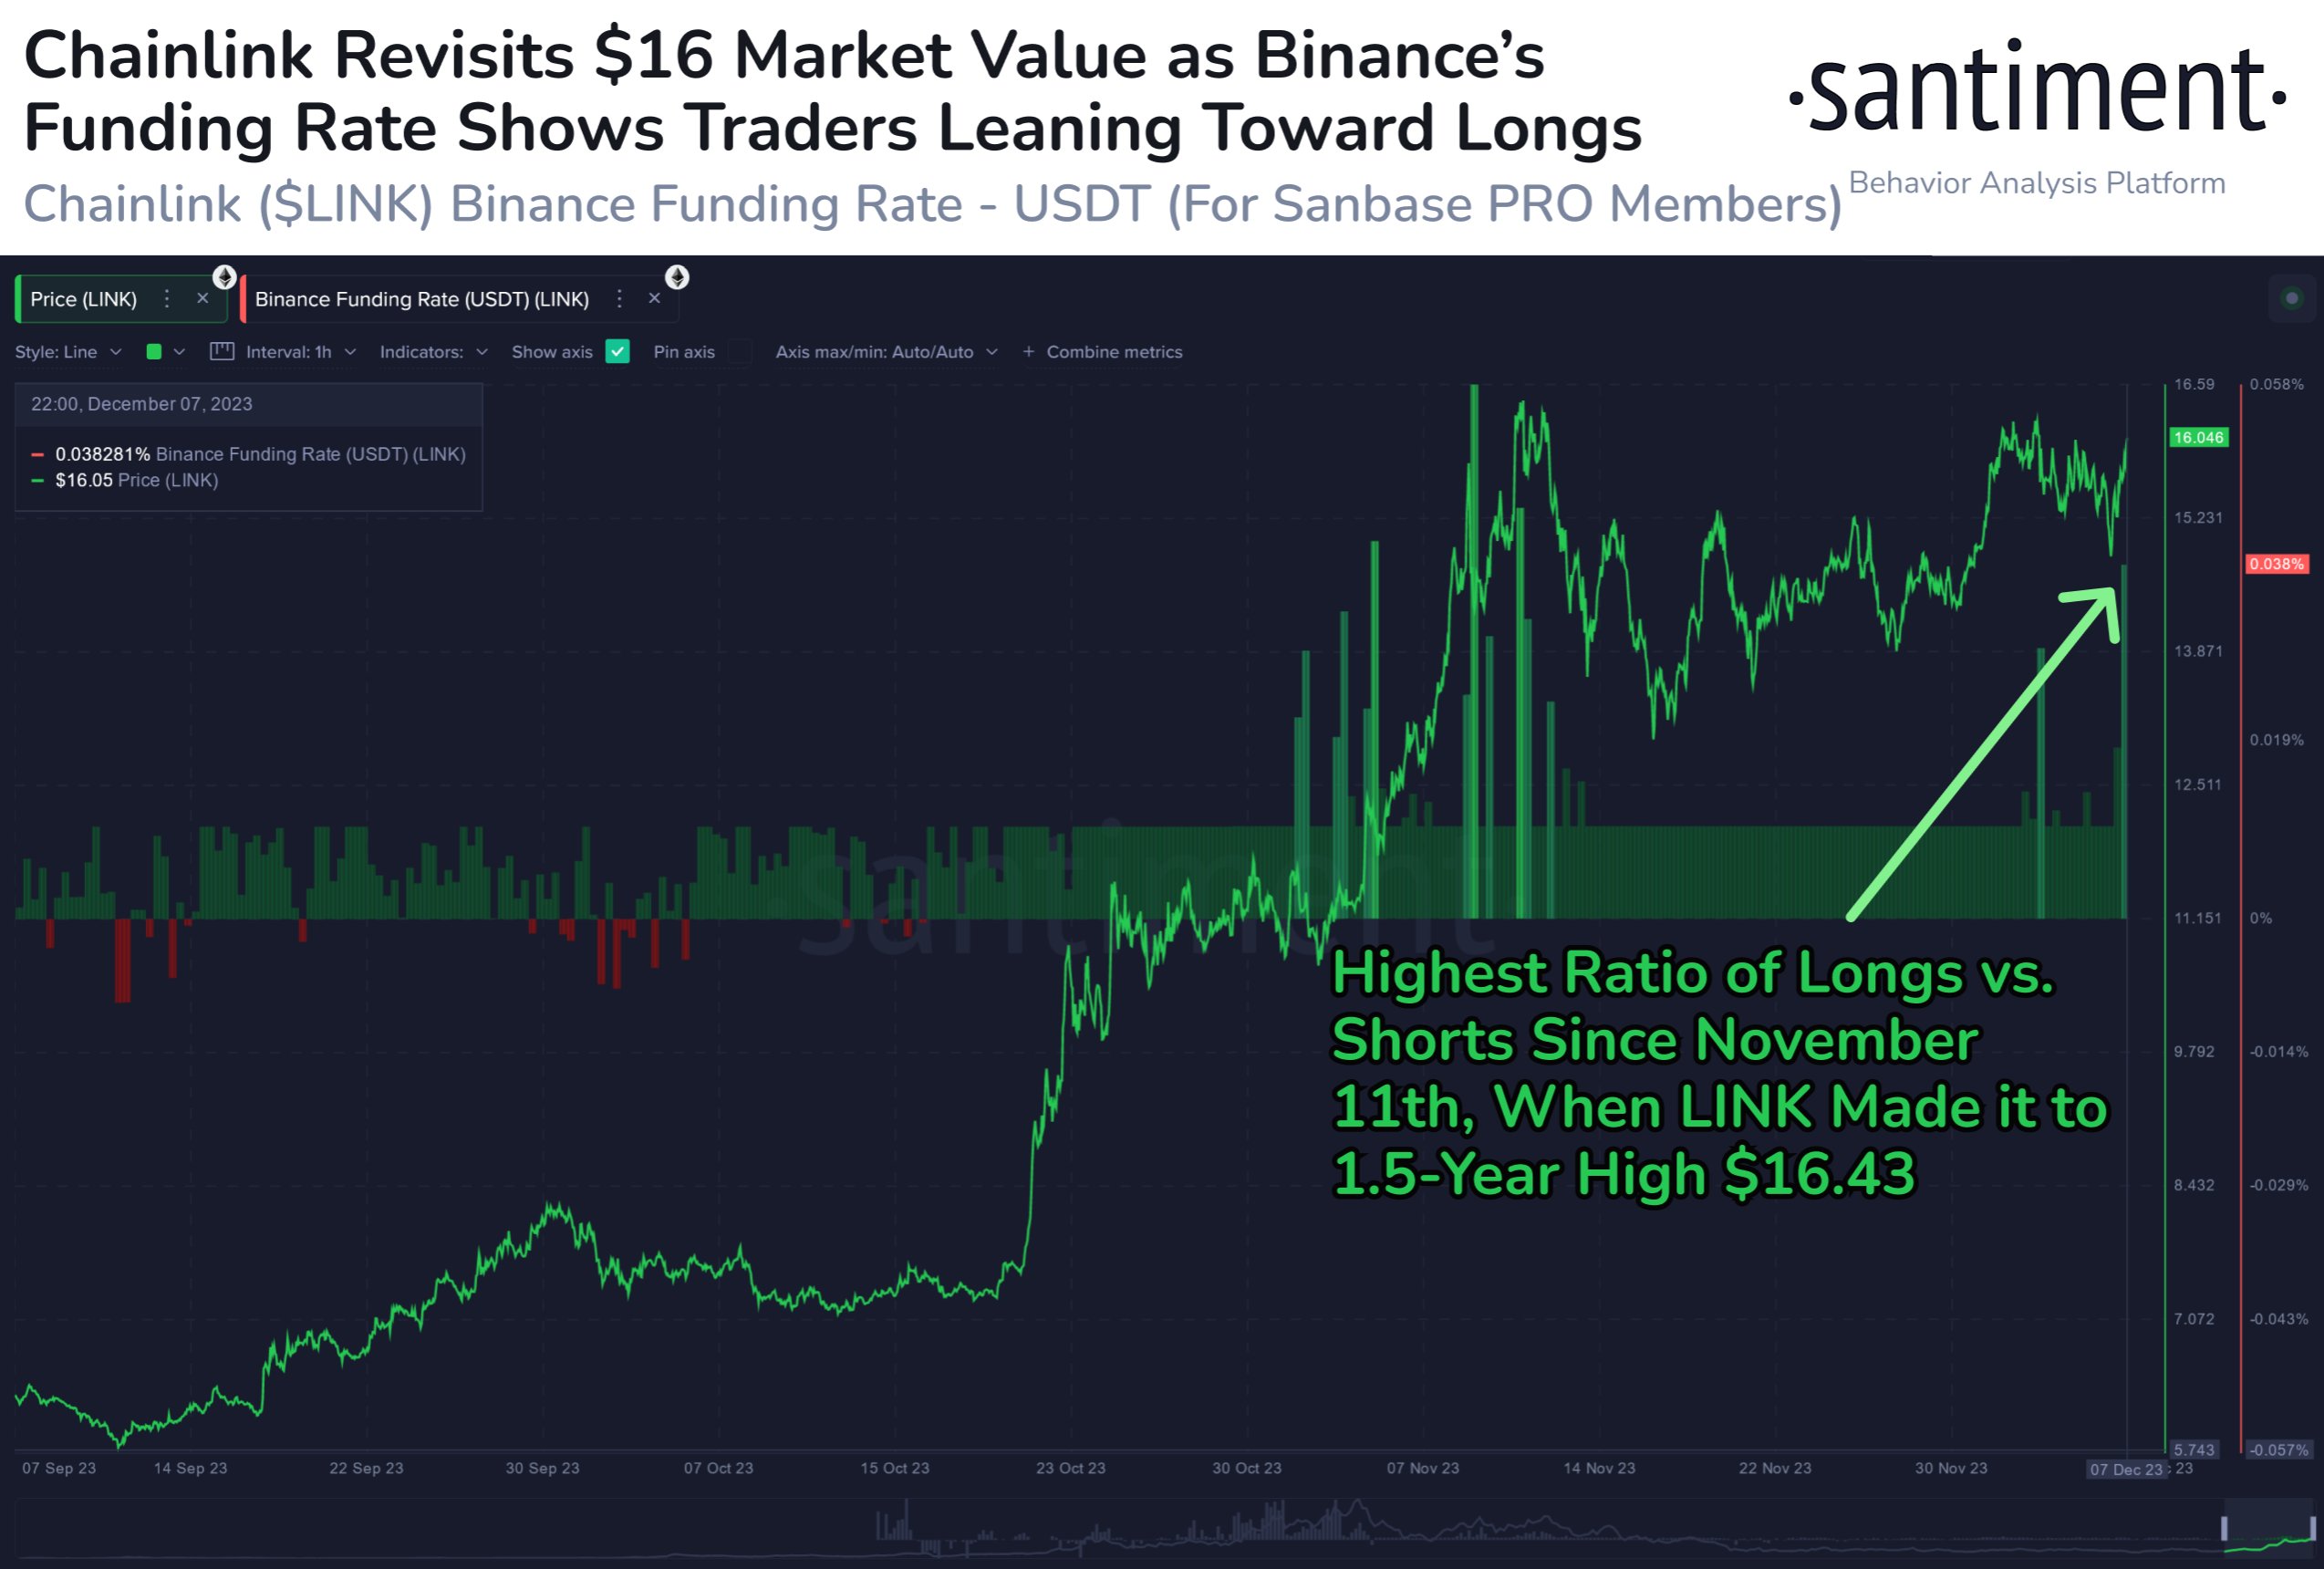
The price performance of Chainlink in the past week has been the most impressive of the three altcoins highlighted by Santiment. According to data from CoinGecko, LINK’s value has jumped by more than 24% in the past week.

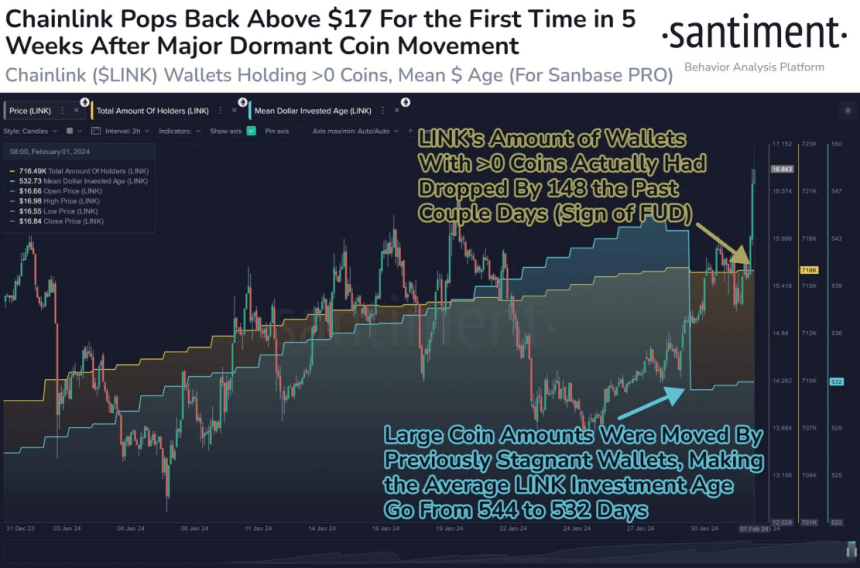
In a week dominated by Bitcoin’s resurgence to above $43,000, Chainlink managed to become one of the biggest gainers in the last seven days. The cryptocurrency’s price registered a positive run to almost as high as $19.

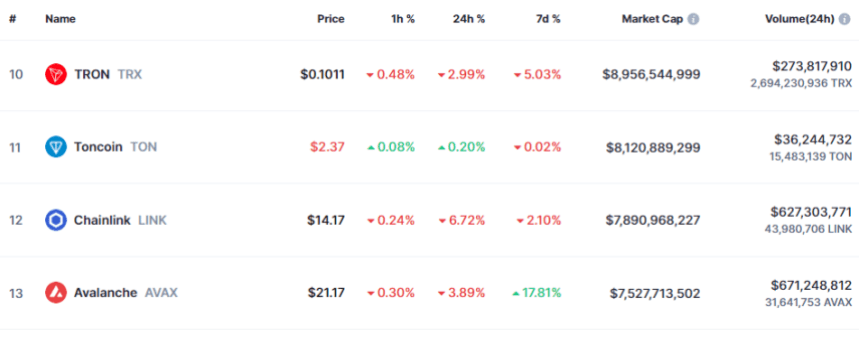
As of this writing, the Chainlink token is valued at $17.69, reflecting a 1.2% price decline in the last 24 hours. The altcoin appears to be witnessing some amount of downward pressure as it is struggling to hold above the $18 level.

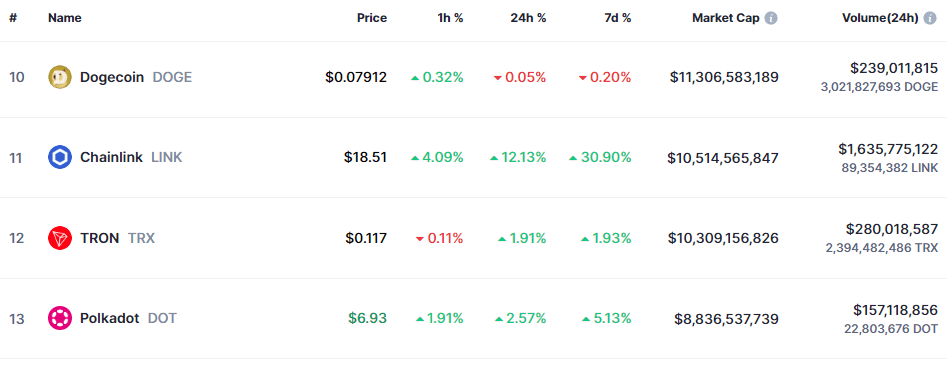
Nevertheless, Chainlink continues to lay a strong claim to a spot amongst the top 10 largest cryptocurrencies by market capitalization. With a market cap of over $10 billion, LINK ranks as the 13th-largest asset in the cryptocurrency sector.

Altcoins

Chainlink Surges 12% To $18: Price Set To Retest $20 Next?

Chainlink has shot up over 12% to break $18 during the past day. A retest of the on-chain resistance wall at $20 could be next.

Chainlink Has Outperformed Market With Its 12% Rally

The past 24 hours have been green for most of the cryptocurrency sector, but the positive returns have been small for most of the market, with Bitcoin, the largest digital asset, only seeing profits of 1%.

Chainlink, however, has separated from the crowd during this period, rallying around 12%. The chart below shows how the coin has performed over the last few days.

Chainlink Price Chart

With this latest surge, Chainlink has surpassed the $18 level for the first time in almost two years. With profits of about 30% over the past week, LINK is by far the best-performing asset among the top 60 cryptocurrencies by market cap.

Speaking of the market cap list, LINK has now flipped Tron (TRX) to become the 11th largest asset in the sector following this recent strong performance. The table below shows where LINK stands among its peers in the sector right now.

Chainlink Market Cap

Dogecoin (DOGE) is the next coin above Chainlink now, and if the asset can continue its run, it should be able to flip the meme coin. While there is still some gap between their market caps, it isn’t too big.

Whether the coin can further this rally or not, perhaps on-chain data could provide some hints.

LINK Has Next Major On-Chain Resistance Wall Around $20

As explained by analyst Ali in a new post on X, LINK has significant on-chain resistance at $20. In on-chain analysis, the strength of a support/resistance level lies in the amount of BTC that the investors bought at it.

Below is a chart that shows the distribution of holder cost basis across the various LINK price ranges near the current price of the cryptocurrency.

Chainlink Resistance

When the analyst shared the chart, LINK was trading around $17.85, and the ranges until the $19.49 to $20.03 one weren’t too dense with investors. Chainlink has mowed through some of these weaker price levels since then, and the asset may continue to do so until it strikes the resistance wall around $20.

In total, 5,330 addresses bought 8.59 million LINK within this range. Generally, investors become more sensitive when the price retests their cost basis, so they may be prone to making some moves. For investors in loss like those inside this range, such a retest can mean an exit opportunity, as they might be desperate to get their money back.

This effect becomes more pronounced as investors share their cost basis inside the same range, so ranges with dense cost basis distribution can be a source of major resistance for the spot price.

Chainlink Price Surge Powers Altcoin Market, Bulls Aim For $20 Target

Chainlink (LINK), the leading oracle network on the blockchain, has been on a tear, outperforming the broader market with a 30% gain in the past week. This surge has pushed LINK’s price to $17.82, solidifying its dominance among altcoins, as bulls set their sights on the vaunted $20 target.

Chainlink On-Chain Activity Hints At Renewed Investor Interest

Analysts point to several factors driving the rally. Santiment, an on-chain data provider, revealed a surge in activity from previously dormant wallets, suggesting renewed investor interest. This is reflected in the “Age Consumed” metric, which measures the total number of days coins have been dormant before being moved. For Chainlink, this metric hit a 5.38 billion spike – the highest ever recorded.

Whales Accumulating, But Liquidations Pose Minor Threat

Santiment’s data also indicated minor liquidations from some wallets, a phenomenon often associated with fear or uncertainty. While these liquidations could trigger short-term volatility, they might also present buying opportunities for savvy investors. Additionally, reports suggest whales accumulating LINK, further fueling bullish sentiment.

The rationale behind this perspective lies in the understanding that fear-induced sell-offs might create temporary price dips, allowing savvy investors to acquire assets at more favorable prices.

Moreover, recent reports have indicated a pattern of whales accumulating LINK, contributing to the overall bullish sentiment surrounding the cryptocurrency. Whale accumulation, where large holders increase their positions, is often interpreted as a sign of confidence in the asset’s future potential.

Technical Analysis Paints Bullish Picture

Crypto analyst Michael van de Poppe identified a “higher low” on the LINK/BTC trading pair, which he considers a bullish signal. He predicts a potential breakout, with LINK reaching $25-$30 in the near future, fueled by a broader altcoin market rally. Van de Poppe even envisions a 50-80% surge for the altcoin market, pushing its valuation to a staggering $1.25 trillion.

While Van de Poppe’s analysis sparks optimism, it’s crucial to remember that expert predictions are not guarantees. The cryptocurrency market remains inherently volatile, and past performance is not indicative of future results.

CFGI At ‘Neutral’ 

Meanwhile, LINK’s “Fear & Greed Index” is currently positioned at 40, indicating a state of neutrality in the market sentiment. This numerical assessment reflects a balance between fear and greed among investors and traders in the context of Chainlink’s performance.

A “Neutral” reading on the Fear & Greed Index implies that the market is not heavily skewed towards either extreme optimism or pessimism. In such a scenario, investors may exhibit a measured and cautious approach, avoiding impulsive decisions driven solely by emotions.

This equilibrium in sentiment suggests that participants are likely assessing the market conditions with a more rational and balanced perspective, considering various factors before making significant moves.

The “Fear & Greed Index” serves as a valuable tool for market participants to gauge the prevailing sentiment and potential market trends. In the case of Chainlink’s current reading at 40, it signifies a market environment where neither excessive fear nor greed is dominating decision-making.

Featured image from Adobe Stock, chart from TradingView

Renowned Crypto Expert Reveals Top 3 Altcoins Ready To Breakout In February 2024

A prominent crypto analyst and Bitcoin enthusiast, Michael Van de Poppe, has shared insights on the future trajectory of several altcoins in the space. The crypto analyst’s predictions highlight crucial moments for investors as they watch out for opportune times to buy and sell cryptocurrencies in this dynamic market. 

Altcoins Set To Rise In 2024

Following the approval of Spot Bitcoin ETFs, Bitcoin experienced a substantial surge, rallying to overcome the $45,000 price mark. During this bullish momentum, the prices of several altcoins, including Ethereum (ETH) and Solana (SOL), also witnessed significant increases. 

In a recent X (formerly Twitter) post, Poppe revealed major altcoins to buy or sell in 2024. The crypto analyst shared a chart illustrating the historical price movements and corrections of Solana, Polygon (MATIC) and Chainlink (LINK). 

Poppe revealed that Solana’s consolidation phase appears to have ended after it experienced a major decline from its 2023 peak of over $123 to $95.81 at the time of writing. His analysis suggests that Solana is poised for a higher time frame support test at $80 and is anticipated to surge to new highs, potentially reaching $140. 

Subsequently, the crypto analyst presented a historical performance chart of MATIC, the native token of Polygon. Noting that the cryptocurrency has maintained higher time frame support levels with established liquidity, Poppe predicts an upcoming upward movement despite MATIC’s recent underperformance. 

He forecasts that MATIC’s next rally could propel its price to a range between $1.25 and $1.50. As of now, the price of MATIC is trading at $0.789, reflecting a 2.39% decline in the past 24 hours, according to CoinMarketCap. 

The Bitcoin enthusiast also anticipates a substantial price increase for Chainlink’s native token, LINK. The crypto analyst revealed that the cryptocurrency has consistently held crucial price levels and is positioned for an upward momentum towards $25. At the time of writing, the price of LINK stands at $14.65, representing a 0.12% increase in the last 24 hours. 

Underperforming Crypto In 2024

In his X post, Poppe unveiled a roster of altcoins that has been struggling to surge and maintain crucial resistance levels. The crypto analyst pointed out that Ethereum’s recent slow growth has adversely impacted many altcoins, causing them to experience further declines. 

He mentioned Synthetix (SNX), which is currently depreciating primarily due to Ethereum’s lagging performance. Additionally, there is Arbitrum (ARB) and Polkadot (DOT), which Poppe predicts would have a significant price increase in the future. 

The Bitcoin enthusiast stated that if ARB can return to a price level of around $1.40 and $1.60, it could open up new entries into a more sustainable position. Subsequently, Poppe predicts a rise in the price of Polkadot to $15 despite its current price trading at $6.80. 

The crypto analyst revealed that DOT is currently showcasing a “great weekly candle”, and its previous price corrections present a great opportunity for investors in the ongoing bull market. 

Crypto Total Market Cap on Tradingview.com (Altcoins Analyst)

Is Chainlink (LINK) Ready To Soar? Key Indicators To Monitor

Among the 20 most important cryptocurrencies by market capitalization, Chainlink (LINK) is currently recording the second-highest loss of -10.4 % in the last seven days. This puts it just behind Ethereum, which recorded a slightly sharper decline of -10.9 %.

Despite this, a glimmer of optimism emerges when delving into the 1-day chart of LINK/USD. The analysis suggests a potential turnaround on the horizon. Should the current market structure remain intact, there’s a promising indication that the recent corrective phase for LINK might be drawing to a close.

Chainlink Price Analysis: Indicators To Watch

Several key indicators and patterns emerge that warrant the attention of traders and investors alike. Firstly, the price action has been demonstrating a series of higher lows, which could be indicative of an ascending triangle pattern forming – a bullish continuation pattern. As long as the LINK price holds above the rising trend (black line) established in late October of the previous year, the bulls remain in control.

At press time, LINK was trading at $13.82, presenting a nuanced narrative in its Exponential Moving Average (EMA) positioning. A critical observation is that LINK’s price is buoyantly positioned above the longer-term 100-day and 200-day EMAs, recorded at $14.6679316 and $11.61, respectively. This configuration typically signals a robust long-term bullish momentum, underpinning investor confidence in the asset.

Contrastingly, the short-term outlook is conveyed by the positioning of the 20-day and 50-day EMAs. With the 20-day EMA at $14.67 and the 50-day EMA at $14.58, both hover above the current price level, imparting a potential resistance zone. This immediate overhead resistance is indicative of a short-term bearish pressure or consolidation phase, possibly reflecting a market pause as traders and investors reassess their positions.

Chainlink price

The Fibonacci retracement levels, drawn from the swing low in June to the peak in December, suggest that LINK has recently tested the 0.236 retracement level at $14.70 as resistance. The subsequent levels to watch are 0.382 at $12.85, followed by 0.5 at $11.53, which could serve as potential support levels if a bearish reversal occurs. Conversely, a break above the 0.236 level may open the door to test the $17.69 level, which stands as a significant resistance.

On the volume front, trading activity has been moderate, with no significant spikes indicating a decisive market direction. The Relative Strength Index (RSI) is hovering around the 50 mark, which typically denotes a neutral market sentiment without clear overbought or oversold conditions.

The MACD indicator exhibits a bearish signal with the MACD line at -0.1407939, positioned below the signal line, which is at -0.1508732. The negative value of the MACD line suggests that the short-term momentum is weaker than the long-term momentum, indicating bearish sentiment in the current market.

Furthermore, the distance between the MACD and the signal line is very narrow, as reflected by the small histogram value of -0.0100794. This small negative histogram value indicates a weakening of downward momentum, as the MACD line is close to crossing above the signal line.

Chainlink price

Traders might view such a crossover as a potential change in momentum, possibly hinting at an upcoming bullish phase. However, until the crossover occurs, the prevailing sentiment indicated by the MACD remains bearish in the short term.

LINK/BTC: Bulls In Control

The LINK/BTC trading pair (weekly chart) is also favoring the bulls. The descending trend line, which has historically acted as a resistance since the peak in 2020, was decisively broken in October last year. This breakout is a key development, indicating a potential reversal of the downtrend that has dominated the LINK/BTC pair for a significant period.

Following the breakout, a retest of the descending trend line occurred, a move often anticipated by technical analysts. The successful retest occurred in the second week of January, when the price bounced off the trend line, reinforcing it as a new support level.

This retest is indicative of a shift in market sentiment, where former resistance levels transform into support, a classical sign of a trend reversal. A breakout above 0.0004472, and LINK could be exploding towards 0.0006875 or even 0.0009.

Chainlink price

In summary, Chainlink’s technical posture is one of cautious optimism, with a clear upward trend since November but facing immediate resistance near the $14.70 level. Market participants should watch these technical indicators closely for signs of either a continuation of the uptrend or a potential reversal if support levels falter.

Chainlink Gets Whale Backing: LINK Price Up 14% Amid Market Dip

In the midst of the recent turbulence within the cryptocurrency market, Chainlink (LINK) has emerged as a notable outlier, demonstrating resilience against the sweeping downturn that has left major altcoins crumbling.

Surprisingly, LINK has steadfastly clung to the $16 mark, showcasing a 14% rally in the last seven days and defying the prevailing market trends. However, investors are left to ponder whether this is a promising sign for Chainlink’s future or merely a momentary blip in the radar.

Massive Chainlink Whale Purchase

This positive signal coincides with a notable $8.9 million whale purchase, injecting a substantial dose of confidence into the market. Yet, beneath the surface, murmurs of a whale exodus are causing concern.

This purchase also dampens some worries especially following a recent selling spree by Chainlink investors, who offloaded a significant 2.3 million tokens since January 12th.

The positive signal also comes after recent concerns in the absence of a noteworthy uptick in fundamental growth metrics such as network usage. Without substantial real-world adoption, the coveted $20 price point for Chainlink might remain an elusive mirage.

Chainlink’s Strengths Persist Amid Market Uncertainty

Meanwhile, IntoTheBlock’s global in/out of the money (GIOM) chart uses the historical entry prices of the current LINK holders to highlight critical levels of support and resistance.

In the near term, investors may opt for short-covering maneuvers to prevent falling into a net-loss position, a strategy that could lead to the consolidation of Chainlink’s (LINK) price just below the $15 threshold in the upcoming days.

Conversely, bullish market participants could potentially counter this bearish scenario by successfully pushing the price beyond the $20 territory. However, a potential hurdle arises from the fact that over 94,000 holders have accumulated 51 million LINK at a minimum price of $18.8.

This sizable accumulation suggests the possibility of bears establishing a formidable sell-wall in that price range, potentially triggering a retreat in LINK’s value.

The interplay of these dynamics underscores the delicate balance between short-term tactical moves and broader market sentiment that currently characterizes the trajectory of Chainlink’s price.

Despite the prevailing turbulence, the core strengths of Chainlink should not be overlooked. Its established role as a leading oracle provider within the blockchain ecosystem remains undiminished.

If the broader crypto market stages a recovery and fundamental growth aligns, a resurgence for Chainlink is not out of the realm of possibility.

Featured image from Freepik

Chainlink Rises 17% – Is LINK On Course To Hit $20 This Week?

Traders in the crypto realm are watching Chainlink (LINK) with bated breath as the price coils up near the $16 mark, hinting at a possible break out towards $17, or even $20 given the right conditions this week.

Since November, LINK has been consolidating between $13.00 and $17.00, exhibiting classic market cycle behavior that presents prime opportunities for savvy traders.

Technical analysts are buzzing with potential bullish scenarios, with many pointing to the current price action as the telltale sign of an “accumulation phase.” As per the renowned Wyckoff method, this phase sees sellers exiting, prices stabilizing, and indecision ruling the market.

Will Chainlink Hit The Vaunted $20 Mark?

Following accumulation comes the much-anticipated “markup phase,” characterized by surging buying pressure, rapid price increases, and heightened activity.

And that’s precisely what the charts seem to be foreshadowing for LINK. Indicators like the Awesome Oscillator and MACD are flashing green and pushing towards bullish territory, suggesting growing confidence and impending upward momentum.

The Relative Strength Index (RSI) also leans north, potentially primed to cross its signal line and add fuel to the bullish fire.

Further bolstering the optimistic outlook are the Simple Moving Averages (SMAs). Both the 100- and 200-day SMAs are pointing north, with the latter currently nestled comfortably at $9.994. This upward trajectory indicates the path of least resistance lies in ascending territory for LINK.

Should buying pressure build steam above current levels, analysts predict a potential leapfrog over the 50-day SMA at $16.95, paving the way for a psychological $17 price point. In a highly bullish scenario, LINK could even tap into its full $20 potential, marking a 20% surge from its current position.

17% Rally Ignites More Optimism For LINK

But a fresh spark ignites the conversation – Chainlink just surged 17% today, propelling it closer to the long-held $17 barrier. Could this recent rally be the catalyst that sends LINK rocketing past its immediate target and into uncharted territory?

It’s still too early to definitively say. While the technical indicators remain encouraging, external factors and market sentiment can shift rapidly. However, one thing is certain: Chainlink’s latest surge adds another layer of intrigue to its already captivating price action.

Whether it coils upward for a glorious breakout or succumbs to profit-taking, the next few days promise to be a thrilling ride for LINK holders and a fascinating case study for technical analysis enthusiasts alike.

Featured image from iStock

LINK Price Rallies Over 5%, A New Uptrend In Making For Chainlink?

Chainlink’s LINK price is moving higher above the $15.00 resistance. The price is now up over 5% and might aim for a move toward the $18.00 resistance.

  • Chainlink price is showing positive signs above $14.50 against the US dollar.
  • The price is trading above the $15.00 level and the 100 simple moving average (4 hours).
  • There was a break above a key bearish trend line with resistance near $14.85 on the 4-hour chart of the LINK/USD pair (data source from Kraken).
  • The price could rally further if it clears the $16.40 resistance zone.

Chainlink (LINK) Price Eyes More Upsides

In the past few sessions, Chainlink bulls were able to send the price above a few key hurdles at $14.50. Earlier, LINK price formed a base above the $12.50 and started a fresh increase.

There was a break above a key bearish trend line with resistance near $14.85 on the 4-hour chart of the LINK/USD pair. The bulls pumped the pair above the 50% Fib retracement level of the downward move from the $17.59 swing high to the $12.50 low.

LINK is now trading above the $15.00 level and the 100 simple moving average (4 hours). The price is up over 5% and outpacing both Bitcoin and Ethereum. If the bulls remain in action, the price could rise further. Immediate resistance is near the 61.8% Fib retracement level of the downward move from the $17.59 swing high to the $12.50 low at $15.65.

Chainlink (LINK)

Source: LINKUSD on TradingView.com

The next major resistance is near the $16.40 zone. A clear break above $16.40 may possibly start a steady increase toward the $17.50 and $18.00 levels. The next major resistance is near the $18.80 level, above which the price could test $20.00.

Are Dips Limited?

If Chainlink’s price fails to climb above the $15.65 resistance level, there could be a downside correction. Initial support on the downside is near the $14.50 level.

The next major support is near the $13.70 level, below which the price might test the $13.00 level. Any more losses could lead LINK toward the $12.50 level in the near term.

Technical Indicators

4 hours MACD – The MACD for LINK/USD is gaining momentum in the bullish zone.

4 hours RSI (Relative Strength Index) – The RSI for LINK/USD is now above the 50 level.

Major Support Levels – $15.00 and $14.50.

Major Resistance Levels – $15.65 and $16.50.

Chainlink Bullish Chart Pattern Hints At $34 Target – But Can It Break Through?

As the calendar turned to 2024, numerous cryptocurrencies experienced a positive start, and among them, Chainlink (LINK) stood out. The notable highlight was the emergence of a bullish pattern on Chainlink’s price chart, indicating a heightened likelihood of an impending bull rally.

This positive momentum in the early days of the year hinted at favorable market conditions for Chainlink and garnered attention from investors and analysts alike. The formation of this bullish pattern added an optimistic outlook to the prospects of Chainlink, creating anticipation for potential upward price movements in the near future.

Bullish Pennant Signals Potential Breakout For Chainlink

The Chainlink platform, which is compatible with Ethereum and well-known for enabling decentralized oracles, is currently trading above $15, data from Coingecko shows.

Ali Martinez, a popular crypto analyst, pointed out a bullish pennant pattern being formed on Chainlink’s chart.

The chart shows Chainlink’s price over the past few days. There is a bullish pennant pattern forming, which is a technical indicator that suggests a potential breakout to the upside.

The pennant is formed by two converging trend lines, one above and one below the price. The breakout occurs when the price breaks above the upper trend line.

Martinez has identified the resistance level at $17.2. If Chainlink’s price can close above this level, it could be a signal that a breakout is happening and that the price could rise to $34.

However, if the price falls below the support level at $14.2, it could be a signal that the bullish momentum is weakening and that the price could fall further.

Overall, the chart suggests that Chainlink is in a bullish position and that there is a possibility of a breakout to the upside. However, it is important to note that technical analysis is not always accurate, and there are many other factors that could affect Chainlink’s price.

Analysts’ LINK Predictions

Changelly cryptocurrency analysts have provided a price estimate for Chainlink for the next weekend. The analysts predict that this weekend, LINK will trade between a minimum of $16.28 and a maximum of $17.71. They anticipate that LINK will be valued at $17 on average.

Meanwhile, Lark Davis, another popular crypto analyst has a more fearless forecast for Chainlink. He said the coin will soon witness a significant surge and “shock the crypto world.”

Davis indicated that the Chainlink network had a promising future. He revealed that he had a sizeable portion of LINK, despite acknowledging the inherent dangers associated with cryptocurrency investing.

According to the analyst, Chainlink’s alliances and technology continue to undervalue it. The Grayscale Trust Trading at premiums exceeding 200% to the spot LINK price, Davis said, indicates that institutional investors are becoming more interested in LINK. The price projection for Chainlink indicates that it may increase to $126 in 2024.

Featured image from Shutterstock

Is Chainlink and Polygon About to Rip Higher? Whales Accumulating

According to Lookonchain data on December 20, whales are actively accumulating Chainlink (LINK) and Polygon (MATIC) and moving them from Binance, one of the world’s largest cryptocurrency exchanges by trading volume. 

Citing on-chain transfers, Lookonchain notes that LINK is specifically seeing significant accumulation from a fresh wallet labeled “0x8eAD,” which has withdrawn 247,860 LINK worth approximately $3.5 million from Binance in the past two days.

Meanwhile, two new wallets, “0xa813” and “0x38b3”, have been actively accumulating MATIC, withdrawing 5 million MATIC worth around $3.13 million from Binance earlier today.

Chainlink whale moves coins | Source: Lookonchain via X

Whales Accumulating, Will MATIC And LINK Rally?

The fact that whales, individuals, or entities controlling large amounts of a particular token or coin are circling MATIC and LINK is net bullish and might support prices in the coming sessions. 

Notably, the transfer is considered bullish when whales move coins from exchanges to non-custodial wallets like hardware wallets or even hot wallets to engage in decentralized finance (DeFi), degen trading, or NFT trading. 

This shift is because, unlike in centralized exchanges like Binance, where their intention is usually trading for other coins or USDT, in on-chain apps, they can use the same stash to earn rewards, for instance, by providing liquidity or staking. 

Therefore, considering the recent transfer, LINK and MATIC prices might recover, increasing in the coming few trading sessions. Thus far, looking at candlestick formations in the daily chart, LINK is stable and remains within an uptrend. Notably, prices are trading above the 20-day moving average, suggesting that the coin found support. LINK is currently up 155% from September lows but down 15% from November peaks. 

Chainlink price trending upward on the daily chart | Source: LINKUSDT on Binance, TradingView

On the other hand, MATIC is also stable and rejects attempts for lower lows. After days of consolidation, the coin has support at around $0.70, matching a critical level recorded in November. 

Still, whether the uptrend will resume depends on whether prices will float higher, breaking above $0.93 or November 2023 highs in the coming session. 

Technically, $0.95 marks a critical reaction level for MATIC that, if comprehensively broken, could open the doors for $1.20 and $1.60 in the coming sessions.

Polygon And Chainlink Roll-Out Critical Features

Beyond current technical formations, fundamental events prop up Polygon and Chainlink bulls, especially around decentralized finance (DeFi) and layer-2 scaling. 

Chainlink’s new staking upgrade aims to mop more LINK from circulation, possibly increasing prices on rising demand for Cross-Chain Interoperability Protocol (CCIP). 

Meanwhile, as other blockchains repurpose to become Ethereum layer-2, Polygon CDK is becoming a critical cog in fast-tracking the process, directly supporting MATIC prices.

Crypto’s Silver Lining: Market Dips Are Stepping Stones To Soaring Heights – Analyst

Crypto Rand, a renowned crypto trader, has shared insights on the current market corrections, emphasizing the necessity of these corrections for sustainable market ‘growth.’

The trader, who disseminates his views on X, stresses that despite the evident pullbacks, the crypto market’s macrostructure remains “intact.”

This perspective comes at a time when most crypto assets, including Bitcoin, have experienced significant price drops over the past couple of days.

Navigating Resistance Levels: The Path To Growth

Crypto Rand’s leveraged the price action index of various cryptocurrencies, such as Cosmos (ATOM), Chainlink (LINK), NEAR Protocol (NEAR), Algorand (ALGO), and MultiversX (EGLD), among others to highlight his point.

Rand identifies multiple resistance levels in these assets’ trajectories, suggesting these as potential points for market turnaround. These resistance levels are categorized as major or minor, depending on the frequency and intensity of price actions historically observed at these points.

Despite the temporary pullbacks that these resistance levels might introduce, Crypto Rand views them as necessary pauses that allow the market to gather strength for future upward movements.

This perspective is particularly relevant in light of Bitcoin’s recent price behavior. The flagship cryptocurrency has seen a notable dip from its recent high of $44,000, currently trading just below $42,000.

Bitcoin (BTC) price chart on TradingView amid crypto market news

This downward trend has echoed across the crypto market, impacting other major assets like Ethereum including altcoins Rand mentioned like Chainlink, and Algorand.

Over the past 7 days, BTC and ETH have experienced declines of 4.4% and 2%, respectively. Meanwhile, Chainlink has seen a 6.9% drop during the same period, and Algorand has fallen by 4.1% in just the past 24 hours.

The Broader Perspective On Crypto Market Corrections

The sentiment that market corrections are a healthy and necessary aspect of growth is not exclusive to Crypto Rand. William Clemente, the co-founder of Reflexivity Research, echoes this viewpoint.

Clemente posits that the current market retraction, which could potentially bring Bitcoin’s price closer to $40,000, should “not be a cause for alarm.”

Clemente argues that this process is crucial for eliminating weaker market participants and reducing excess leverage, ultimately establishing a firmer foundation for future upward trends.

Clemente further articulates that the inherent volatility of Bitcoin should be perceived as “a feature, not a bug”. It is worth noting that this stance reinforces the notion that the crypto market is still evolving and that such fluctuations are part and parcel of its journey towards maturity.

Featured image from iStock, Chart from TradingView

Chainlink Becomes Long-Heavy As Price Clears $16: Top Here?

Chainlink has seen long contracts pile up on Binance during the past day, which may lead toward a top for the cryptocurrency.

Chainlink Funding Rate On Binance Has Turned Highly Positive

According to data from the on-chain analytics firm Santiment, the Chainlink funding rate on Binance has now reached the highest level in about four weeks. The “funding rate” refers to the periodic fee that derivative traders on any given platform are exchanging with each other right now.

When the value of this metric is positive, it means that the long holders are currently paying a fee to the short investors in order to hold onto their positions. Such a trend suggests a bullish mentality is dominant on the platform.

On the other hand, negative values imply a bearish sentiment is shared by most LINK traders on the exchange as the shorts outweigh the longs.

Now, here is a chart that shows the trend in the Chainlink funding rate on cryptocurrency exchange Binance over the last few months:

Chainlink Funding Rate

As displayed in the above graph, the Chainlink funding rate on Binance has assumed significantly positive values following the asset’s surge beyond the $16 mark.

Longs currently outweigh the shorts by the highest ratio since November 11th, when the cryptocurrency’s price set its then-yearly high, which the coin has now surpassed.

Historically, longs piling up on the derivatives market have often been negative for the price. This is because a mass liquidation event called a “squeeze” is usually more likely to affect the side with the most positions.

In a squeeze, a sudden swing in the price triggers a large amount of liquidations, which only feed into the swing further and end up leading to a cascade of more liquidations.

As the Chainlink funding rate is significantly positive, a long squeeze could be more likely to happen than a short squeeze. Last month, the asset hit its local top in these conditions, so the same might also repeat this time.

If LINK does observe a drawdown shortly, though, the decline may not be too extended. This is because there appears to be some strong on-chain support present between the $14.4 and $14.8, as analyst Ali pointed out in an X post yesterday.

Chainlink Price Chart

In on-chain analysis, levels are defined as resistance and support based on the total number of investors who acquired their coins at said levels. From the chart, it’s visible that 17,000 addresses have their cost basis inside the $14.4 to $14.8 range, which means it’s possibly a zone of strong support.

On the contrary, the levels above the current one are thin with investors, meaning that they shouldn’t pose too much resistance should the rally continue.

“As $LINK has regained the $16 threshold, watch if a bit of FOMO forms a local top, or if prices continue surging toward $20 with little resistance,” notes Santiment.

LINK Price

LINK had earlier broken past the $17 mark, but the asset has since seen some pullback as it’s now trading under the level once more.

Chainlink Price

LINK Price Climbs Above $16 Again – What’s Behind The Latest Surge?

The LINK price seems to be intensifying its bullish momentum again after cooling off over the past few weeks. Despite the recent sluggishness in Chainlink’s price action, the cryptocurrency has maintained most of its profit and managed to stay above the $14 level in the past weeks.

Interestingly, the LINK price recently made its way above the $16 mark for the second time in less than a month. But here is the question – what is driving the latest surge?

On-Chain Data Reveals Catalyst For Chainlink’s Jump To $16

The latest on-chain revelation from Santiment has offered insight into the catalyst behind LINK’s price jump to $16. According to data from the crypto analytics firm, Chainlink’s richest wallets have made a substantial amount of token purchases in the past few days.

In a December 2 post on X, Santiment revealed that LINK whales bought about 3.9 million tokens (worth more than $62 million) in the past three days. This data point highlights an increase in the total amount of tokens held by the 200 largest Chainlink addresses.

This recent market activity underscores the current accumulation trend amongst Chainlink whales. According to data provided by Santiment, the top 200 wallets have loaded up more than $50 million worth of LINK tokens in approximately five weeks.

Furthermore, the on-chain analytics firm also revealed that the 200 largest Chainlink addresses currently hold a combined 746.57 million tokens (equivalent to a massive $11.84 billion). This figure represents nearly 75% of LINK’s total supply.

This accumulation trend is a positive sign for LINK and its price trajectory, as it suggests that large investors are keeping their faith in the asset and banking on the token’s price growth.

Is LINK Outperforming Bitcoin?

As of this writing, the LINK token is valued at $16.11, reflecting a nearly 2% price increase in the last 24 hours. According to data from CoinGecko, the cryptocurrency has jumped by more than 7.5% in the past week.

With its market capitalization rising by more than 143% in the last five months, Chainlink’s performance over the past few months is even more remarkable. Moreover, the altcoin has held its own against the premier cryptocurrency, Bitcoin.

Based on data provided by Santiment, LINK has outperformed the market leader by over 93% – in terms of market cap – in the past five months. This is especially impressive considering that Bitcoin has also been on a positive run, recently breaking above $39,000 for the first time in over a year.

Nevertheless, Bitcoin maintains its position as the top cryptocurrency with a market cap of $772 billion. Comparatively, LINK ranks as the 12th-largest asset with a $9 billion market capitalization.

LINK

Chainlink Signal Resurfaces: Is Another 31% Rally Coming?

On-chain data shows that a Chainlink signal that last preceded a 31% rally for the asset’s price has just reversed.

Chainlink Age Consumed Metric Has Observed A Sharp Spike Recently

According to data from the on-chain analytics firm Santiment, LINK has recently seen a significant movement from old coins. The relevant indicator here is the “Age Consumed,” which tells us whether the dormant Chainlink tokens are on the move or not right now.

When the indicator’s value registers a large spike, it’s a sign that the blockchain is currently observing the transfer of a significant number of old coins. Such dormant tokens belong to a cohort called the “long-term holders” (LTHs), made up of the relentless hands of the sector.

As such, this metric surging can be something to watch out for, as it means that these LTHs, who usually remain quiet no matter what’s going on in the wider market, have decided to break their dormancy.

Now, here is a chart that shows the trend in the Chainlink Age Consumed over the last few months:

Chainlink Age Consumed

As displayed in the above graph, the Chainlink Age Consumed indicator has observed a sharp rise recently, implying that the LTHs have been making transactions.

At the peak of this latest spike, the metric’s value touched 4.28 billion, which is the highest level seen since the middle of September. Back then, the indicator registered a spike almost double in scale, and interestingly, what followed in the next couple of weeks was a 31% rally as LINK went from $6.36 to $8.22.

It’s hard to say if a similar pattern would repeat for Chainlink this time since the LTHs could have broken their silence for several reasons, including for selling.

An analyst has pointed out that yesterday (which was about the same time as this spike in the Age Consumed), the whales made many transactions, as the chart below shows.

Chainlink Whale Transactions

In total, the Chainlink network observed 2,600 transactions valued over $100,000 yesterday. The spike would confirm that the LTHs who broke their dormancy weren’t just ordinary investors but the whales.

In isolation, it’s hard to say why these two indicators recently observed a spike. Still, when looking at the latest LINK news, perhaps the most likely explanation becomes apparent.

Yesterday, Chainlink staking v0.2 went live on the Ethereum blockchain, allowing the v0.1 stakers to migrate toward the new network. Thus, given the close timing of the spikes in the Age Consumed and Whale Transaction Count, it would appear quite probable that these LTHs were making transfers toward the new staking pools.

LINK Price

Chainlink had observed some drawdown towards the $13.7 mark just recently, but it would seem like the asset has already recovered as it’s now trading around $14.7.

Chainlink Price Chart

Is $20 On The Cards? LINK Price Rides High With Chainlink Staking v0.2 Rollout

Chainlink, a widely used distributed computing platform, has recently introduced an upgrade to its staking capabilities.

Known as Staking v0.2, this new version adds an extra layer of security to the network and stands as a key component of Chainlink’s Economic 2.0 strategy.

The anticipated duration for the migration of the protocol for the current v0.1 stakeholders is nine days. Users cannot transfer their staked LINK or the associated rewards to version 0.2 at this time.

According to the most recent data, LINK was trading at a price range of $14.7 to $14.9, representing a monthly growth of over 30%. The majority of LINK oscillators exhibit a consistent optimistic bias. The Relative Strength Index (RSI) indicates a possible purchasing opportunity at 50.

Chainlink (LINK) is experiencing an extraordinary quarter, having gained nearly 100 percent since the start of October. At the time of writing, the altcoin had risen as high as 12th among the largest cryptocurrencies by market capitalization.

LINK holders may still have more to look forward to, as on-chain data indicates that the recent ascent of the token has created favorable conditions for the formation of robust support levels. Among these strongest support levels, according to data provider IntoTheBlock, is the region between $13.15 and $13.50.

Chainlink: Staking And Migration Advancements

LINK maintains its favorable outlook in spite of the general market volatility that has ensued since the regulatory issues faced by the Binance exchange and the discourse surrounding exchange-traded funds (ETFs).

Whale Transactions Up

With the launch of the v0.2 migration, the industry-leading Oracle network Chainlink has provided stakers with a more flexible staking platform. In addition, it features an adaptive rewards system, enhanced security guarantees, and a modular architecture.

Santiment, a market intelligence platform, reports that whale transactions (see chart below) comprising LINK worth a minimum of $100,000 increased by 1,145% in the previous day, from 176 transactions on November 28 to 2,198 transactions as of the time of writing.

Rapid growth in whale activity is typically associated with increased volatility in an asset. Furthermore, according to data from Santiment, LINK experienced a marginal increase in total open interest (OI) within the last day, rising from $211 million to $213 million.

Eleven months have passed since the protocol’s December 2022 introduction of staking on the Chainlink network. A press statement from Chainlink on November 28th stated that the v0.2 update includes an increase in the amount of the staking pool to 45 million LINK.

The aforementioned figure signifies a 96% growth from the initial allocation of 22.5 million LINK to the staking pool in December, which accounted for 8% of the altcoin’s circulating supply at the time.

LINK Price Analysis: Eyes On The $20 Mark

Meanwhile, with Chainlink’s Staking v0.2 in play, LINK’s value is on the rise, prompting the question: Will it hit $20? The excitement is building as investors keep a close eye on the numbers.

The recent boost in LINK’s price has people hopeful about reaching that $20 mark. As the crypto world unfolds, it’s a waiting game to see where LINK’s journey takes us next.

(This site’s content should not be construed as investment advice. Investing involves risk. When you invest, your capital is subject to risk).

Featured image from Shutterstock

Market Watch: These 5 Altcoins Are Poised For Breakouts, Says Crypto Expert

A recent analysis by a Crypto Banter pinpointed new notable price levels for prominent altcoins such as  XRP, Solana (SOL), Chainlink (LINK), Fantom (FTM), and Polygon (MATIC).

These insights provide a fresh perspective on potential entry points for bullish positions in the current market.

Altcoins At Crossroads: Key Price Levels To Watch

In this analysis, Crypto Banter singles out Solana (SOL) and notes that $48 is an “intriguing” level to watch for any pullback. Additionally, historical data consolidating around this price point on the SOL/USD weekly chart indicates it could be an “optimal” buying zone should prices drop to this mark.

In the case of Chainlink (LINK), Crypto Banter identifies $13.3 down to $12.2 as a “hot zone.” A drop below this range might shift focus to the $9 level as a critical reversal point.

Polygon (MATIC) also comes under scrutiny, with the analyst observing a break in the 200-day moving average on its weekly chart timeframe. According to the host, this development suggests a potential bounce back at the $0.68 zone, possibly preluding a rally.

For clarity, “moving average,” or MA, is a widely used indicator in technical analysis that helps unravel price data by creating a constantly updated average price. This average is typically calculated over a specific period, like 10 days, 20 minutes, 30 weeks; in the case of the Crypto Banter analysis, they based their analysis on the 200-day MA.

Fantom’s Surge And XRP’s Pivotal Turnaround

On the other hand, Fantom (FTM), Crypto Banter, revealed that the altcoin has shown a significant pump of over 50% since late October.

Yet, the analyst suggests a possible retraction towards the 200-day moving average, making the $0.25 region attractive, particularly for those employing a dollar-cost averaging (DCA) strategy.

XRP is not left out of this analytical purview. The host points out that XRP is nearing a critical juncture from a technical standpoint.

The analyst reveals that the 12-hour chart for XRP shows a recent rebound off the 50-day MA. A turnaround around the $0.54 price region could occur if the ongoing pattern along the downward trendline persists.

The analyst further disclosed that this level gains importance due to the convergence of key moving averages that form a support zone around it.

Interestingly, among the altcoins highlighted by Crypto Banter as primed for a breakout, SOL and FTM stand out with significant gains. Over the past two weeks, Solana has seen a 13.8% increase, while FTM has climbed by 8.3%.

XRP price chart on TradingView amid altcoins breakout

Contrastingly, XRP, LINK, and MATIC  have experienced declines during the same period. XRP’s price fell by 5.5%, LINK by 5.6%, and MATIC by 6.6%, signaling a diverse performance landscape among these notable altcoins.

Featured image from iStock, Chart from TradingView

Chainlink Retests $14: Here’s What Will Happen If Support Holds

Chainlink has registered some drawdown and has recently retested the $14 level. Here’s what might happen if support holds at this mark.

On-Chain Data Suggests Resistance Is Thin At Higher Chainlink Levels

As pointed out by analyst Ali in a new post on X, Chainlink is currently in a critical on-chain demand zone. In on-chain analysis, a price range is defined as major support or resistance based on the number of investors or addresses that bought their coins inside the said range.

To any holder, their cost basis is naturally fundamental, as their profit/loss situation can flip whenever the cryptocurrency retests it. For this reason, an investor becomes more likely to show a move whenever such a retest takes place.

If the holder had earlier been holding a loss, but the price has now risen and reached its equilibrium point, they might lean towards selling. This is because they might fear their holdings would go into loss again shortly, so exiting at break-even wouldn’t sound like a bad idea.

The opposite can be true when the retest occurs from above: the investor might be willing to buy more, thinking that if this same cost basis proved profitable earlier, it would do so again soon.

A single investor making such buy or sell moves is insignificant for the rest of the market, but if many investors share the same cost basis, the asset could feel a sizeable reaction when the price retests the level.

Now, here is a chart that shows how the Chainlink ranges around the current price look in terms of the density of investors who bought inside them:

Chainlink Cost Basis

As displayed in the above graph, the Chainlink levels from $13.8 to $14.2 host the cost basis of about 11,470 addresses, which acquired 23.45 million LINK inside this range.

This range is notably thicker than any other range immediately below or above the asset’s current price. LINK has been floating around this range recently, meaning it has been retesting this major support zone.

From the chart, it’s apparent that the ranges above don’t contain that many investors, so in theory, a move toward the higher levels shouldn’t be too hard for the asset.

However, the trouble would be if this support area is lost and LINK slips under it for an extended duration. This dense zone will turn into a resistance wall if this happens, making it hard for the cryptocurrency to recover above it.

Ali notes, though, that if Chainlink can remain above this zone, the price could climb towards new highs for the year 2023.

LINK Price

Chainlink had slipped below this range just earlier, but the asset was quick to recover above it, implying that it’s still holding up as support.

Chainlink Price Chart

Analyst Predicts Chainlink Rally To $20 Based On This Pattern

An analyst has pointed out how Chainlink might be breaking out of a bull flag right now, which could suggest a rally toward $20.

Chainlink Is Escaping Out Of A Bull Flag Pattern Currently

In a new post on X, analyst Ali pointed out a breakout that may be forming in the LINK price chart. The relevant technical pattern here is the “bull flag,” which, as its name implies, looks like a flag on a pole.

This pattern forms when the asset’s price goes through a pullback after seeing a sharp rally and consolidates inside a region. The initial trend acts as the “pole,” while the parallel trendlines of the consolidation region make up the “flag.”

The flag’s length (the distance between the parallel trendlines) is always at most half the length of the pole. If it’s not, then the pattern isn’t that of a bull flag.

Inside the flag, the price feels resistance at the upper line and support at the lower one. A successful break out of the resistance zone generally indicates that the asset is ready to continue the initial uptrend.

According to the analyst, the chart below shows that such a pattern is forming for Chainlink.

Chainlink Bull Flag

As displayed in the graph, Chainlink had earlier been consolidating inside what seems to have been a bull flag, but with the recent surge, the asset has seen a break out of the pattern.

When Ali shared the chart, LINK had been trading just under the $15 mark. The analyst had noted that a retest of the breakout zone could happen soon, around $14.

The cryptocurrency has indeed made such a retest since then, as its price has observed some retrace. Ali believes the price could rally towards the $20 mark, continuing the bullish momentum from earlier. From the current asset price, such a jump would imply profits of almost 42% for Chainlink.

It remains to be seen whether the bull flag pattern holds for the cryptocurrency this time and if a return to a bullish trend occurs.

LINK Has Seen A Rally Of 185% In The Past Month

Regardless of the recent pullback that the asset has seen from above the $16 mark, its returns for the last 30 days are still incredible, as they currently stand at a whopping 85%.

The below chart shows what the performance of the asset has looked like during this period.

Chainlink Price Chart

With such large returns, Chainlink has naturally outperformed most of the other top assets recently, and it’s no wonder that the cryptocurrency has also significantly improved its standing in the market cap list.

Chainlink Market Cap