Major Success For Chainlink: US Banks’ Pilot Program Propels LINK Price Up 6%, Details

The Depository Trust and Clearing Corporation (DTCC) has partnered with blockchain oracle Chainlink and several prominent banking institutions in the United States to conduct a successful pilot aimed at accelerating the tokenization of funds. 

The collaboration has not only paved the way for the adoption of blockchain technology in the traditional asset management sector but has also had a significant impact on the price of Chainlink’s native cryptocurrency, LINK, which has surged past the $14 threshold.

Major Asset Managers Join DTCC And Chainlink

The pilot, called Smart NAV, was developed by DTCC to explore the extension of its Mutual Fund Profile Service I (MFPS I), an industry-standard platform that transmits “Price and Rate” data, also known as “NAV data.” 

By leveraging Chainlink’s cross-chain interoperability and blockchain abstraction capabilities, the pilot aimed to investigate the potential of on-chain price and rate data as a key enabler for new initiatives, particularly in the realm of mutual fund tokenization.

To evaluate the industry value of a DLT-based price and rate dissemination solution, DTCC collaborated with asset managers, service providers, and distributors, including American Century Investments, BNY Mellon, Edward Jones, Franklin Templeton, Invesco, JPMorgan, MFS Investment Management, Mid Atlantic Trust, and State Street. 

On-Chain Data Delivery For Fund Tokenization

According to the announcement, the results of the pilot were positive. The collaboration between DTCC, the US banking institutions, and Chainlink reportedly showed that structured data can be delivered on-chain, enabling the embedding of foundational data into multiple on-chain use cases. 

This capability has far-reaching implications, including supporting brokerage portfolio applications and facilitating real-time, automated data dissemination. Moreover, Smart NAV aims to provide built-in access to historical data and simplify the relay of price and rate data through new interfaces for data consumption.

Furthermore, the pilot reportedly achieved several key milestones, including validating user interfaces and applications that leverage on-chain data, establishing automation of data routing through smart contracts for dynamic data management, and preventing future fragmentation through Chainlink’s Cross-Chain Interoperability Protocol (CCIP). 

Ultimately, the DTCC stated that the partnership with Chainlink has played a key role in the success of the Smart NAV use case. By providing an abstraction layer through its cross-chain interoperability capabilities, Chainlink has facilitated “seamless” transmission of data across multiple blockchains. 

This approach eliminates the need for DTCC to establish individual connections to each blockchain, mitigating costs and operational complexities while ensuring data accessibility and optimization.

Bullish Momentum For LINK 

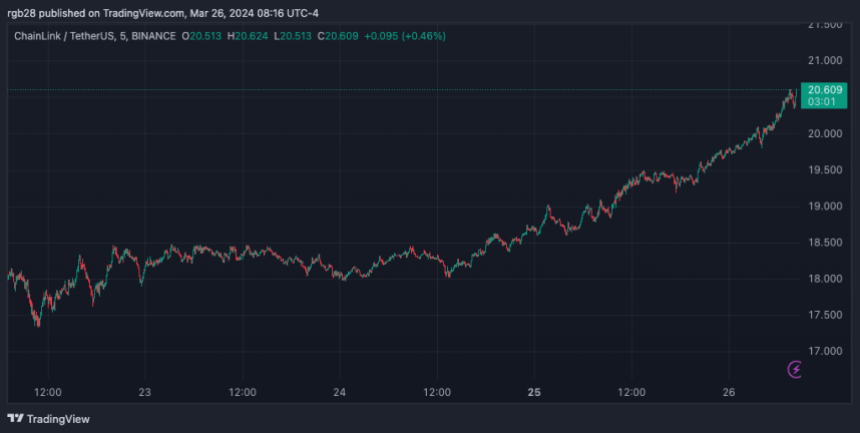
As of the time of this press release, the LINK token has successfully surged above the $14.88 mark, experiencing a notable 6.8% increase in price since the initial announcement on Thursday. 

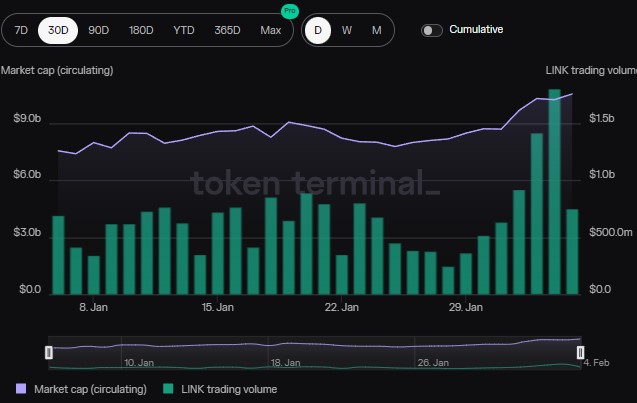
Data from CoinGecko indicates that the token’s trading volume has also seen a significant surge of 17% in the last hours, reaching a substantial figure of $400 million. 

Chainlink

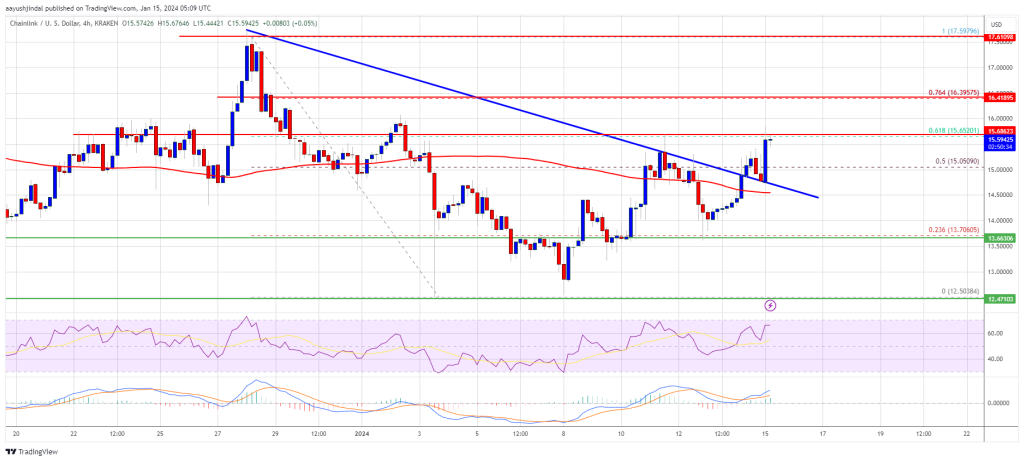
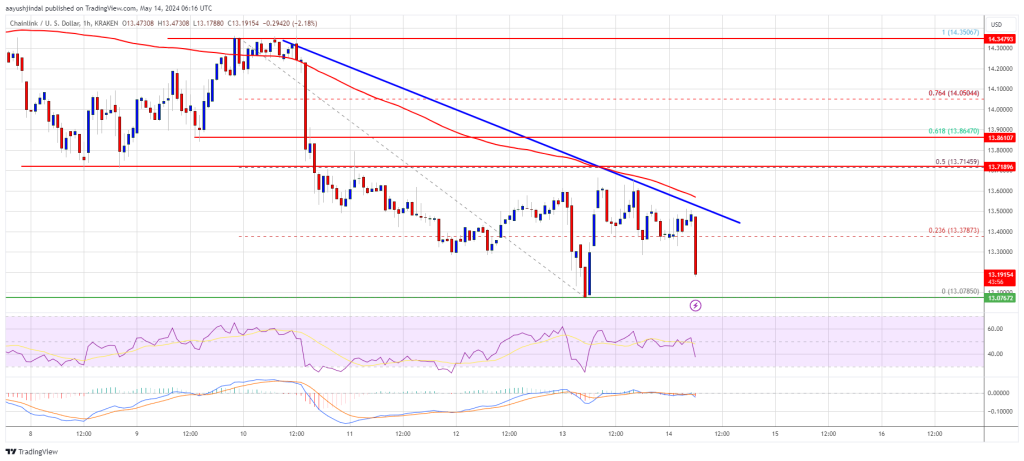
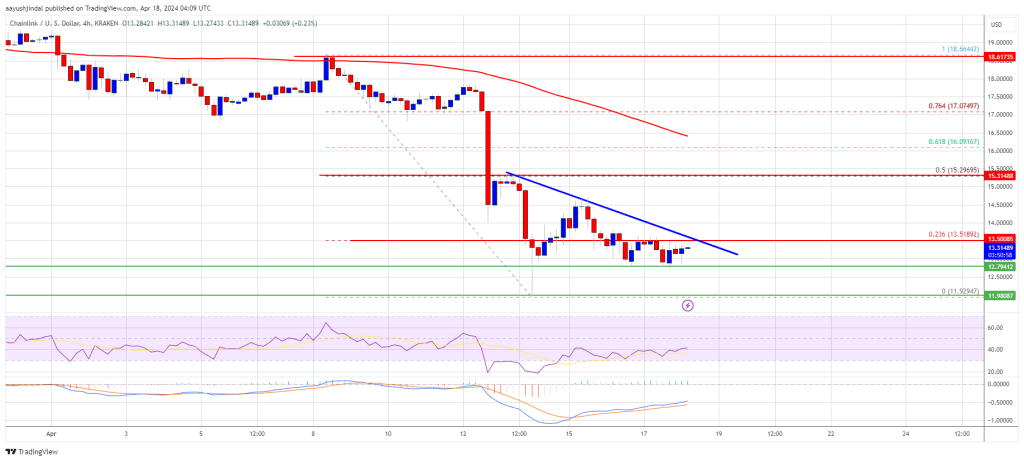
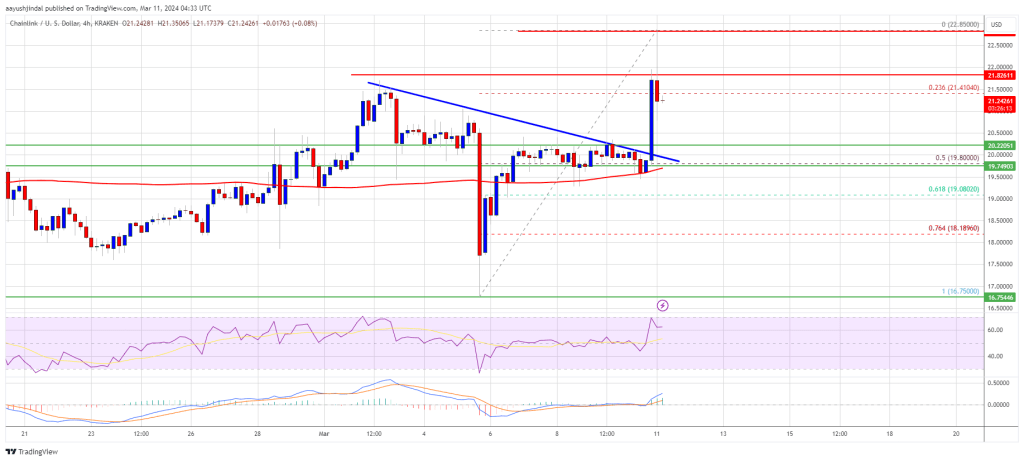
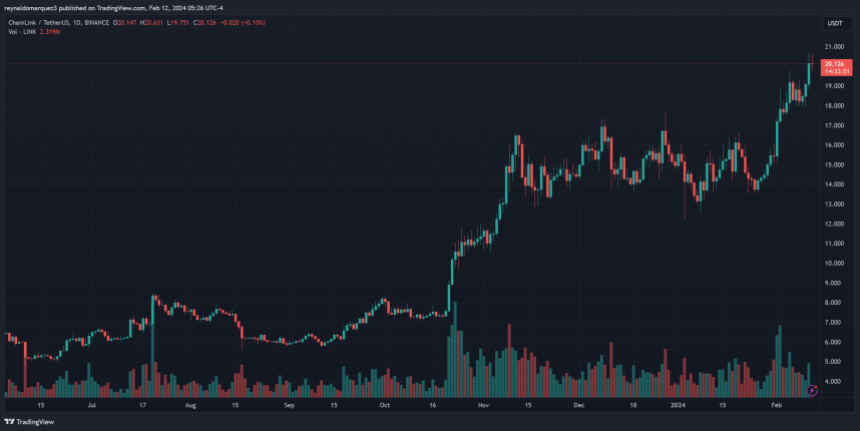
However, for LINK to recover from its 72% losses from its all-time high of $52.70 reached in May 2021, it faces two key resistance levels as shown on the token’s daily LINK/USD chart above. 

These resistance walls are located at $15.18 and $17.8 respectively, before potentially moving towards the $20 mark. It remains to be seen whether the current bullish momentum will persist and further propel the price of LINK beyond these levels.

Featured image from Shutterstock, chart from TradingView.com

Chainlink’s (LINK) Outlook Grows Bleak: Signals of Bearish Continuation Surface

Chainlink’s LINK price is struggling to surpass the $13.80 resistance. The price could continue to move down if it breaks the $13.00 support.

  • Chainlink price is showing bearish signs below the $14.00 resistance against the US dollar.
  • The price is trading below the $13.60 level and the 100 simple moving average (4 hours).
  • There is a key bearish trend line forming with resistance near $13.50 on the 4-hour chart of the LINK/USD pair (data source from Kraken).
  • The price could start a decent increase if it clears the $13.80 resistance zone.

Chainlink (LINK) Price Turns Red

In the past few days, Chainlink saw a steady decline from well above the $13.80 level. LINK price declined below the $13.50 support level to enter a short-term bearish zone, like Bitcoin and Ethereum.

The price tested the $13.10 support zone. A low was formed at $13.07 and the price recently attempted a recovery wave. There was a move above the $13.50 level. It even jumped above the 23.6% Fib retracement level of the downward move from the $14.30 swing high to the $13.07 low.

However, the bears were active below the $13.80 resistance and the 50% Fib retracement level of the downward move from the $14.30 swing high to the $13.07 low. LINK price is still trading below the $13.80 level and the 100 simple moving average (4 hours).

Immediate resistance is near the $13.50 level. There is also a key bearish trend line forming with resistance near $13.50 on the 4-hour chart of the LINK/USD pair.

Chainlink (LINK) Price

The next major resistance is near the $13.80 zone. A clear break above $13.80 may possibly start a steady increase toward the $14.00 level. The next major resistance is near the $14.35 level, above which the price could test $15.50.

More Losses?

If Chainlink’s price fails to climb above the $13.50 resistance level, there could be a fresh decline. Initial support on the downside is near the $13.10 level.

The next major support is near the $12.80 level, below which the price might test the $12.20 level. Any more losses could lead LINK toward the $11.50 level in the near term.

Technical Indicators

4 hours MACD – The MACD for LINK/USD is gaining momentum in the bearish zone.

4 hours RSI (Relative Strength Index) – The RSI for LINK/USD is now below the 50 level.

Major Support Levels – $13.10 and $12.80.

Major Resistance Levels – $13.50 and $13.80.

LINK Price Eyes Recovery If It’s Able to Hold One Crucial Level

Chainlink’s LINK price retested the $12.00 support zone. The price is now eyeing a recovery wave above the $13.50 and $15.00 resistance levels.

  • Chainlink price is showing bearish signs below the $15.00 resistance against the US dollar.
  • The price is trading below the $14.20 level and the 100 simple moving average (4 hours).
  • There is a key bearish trend line forming with resistance near $13.50 on the 4-hour chart of the LINK/USD pair (data source from Kraken).
  • The price could start a decent increase if it clears the $15.00 resistance zone.

Chainlink (LINK) Price Eyes Steady Increase

In the past few days, Chainlink saw a major decline from well above the $18.00 level. LINK price declined below the $15.00 pivot level to enter a short-term bearish zone, like Bitcoin and Ethereum.

The price tested the $12.00 support zone. A low was formed at $11.92 and the price is now attempting a recovery wave. There was a move above the $12.50 level. It even jumped above the 23.6% Fib retracement level of the downward move from the $18.66 swing high to the $11.92 low.

LINK price is still trading below the $14.20 level and the 100 simple moving average (4 hours). Immediate resistance is near the $13.50 level. There is also a key bearish trend line forming with resistance near $13.50 on the 4-hour chart of the LINK/USD pair.

LINK Price

Source: LINKUSD on TradingView.com

The next major resistance is near the $15.00 zone. A clear break above $15.00 may possibly start a steady increase toward the $16.00 level or the 61.8% Fib retracement level of the downward move from the $18.66 swing high to the $11.92 low. The next major resistance is near the $18.00 level, above which the price could test $20.00.

More Losses?

If Chainlink’s price fails to climb above the $13.50 resistance level, there could be a fresh decline. Initial support on the downside is near the $12.80 level.

The next major support is near the $12.00 level, below which the price might test the $10.80 level. Any more losses could lead LINK toward the $10.00 level in the near term.

Technical Indicators

4 hours MACD – The MACD for LINK/USD is gaining momentum in the bearish zone.

4 hours RSI (Relative Strength Index) – The RSI for LINK/USD is now below the 50 level.

Major Support Levels – $12.80 and $12.00.

Major Resistance Levels – $13.50 and $14.00.

Chainlink (LINK) Soars 9%: Crypto Analyst Predicts Next Big Target

Chainlink (LINK) has performed strongly over the past week, with the token’s price increasing 21.3% in the last seven days. Some analysts have shared their predictions and thoughts on LINK, suggesting keeping an eye on the token and its long-term performance.

What Is LINK’s Next Steppingstone?

Recently, Chainlink announced its partnership with blockchain platform Avalanche and the Australia and New Zealand Banking Group to connect the Avalanche and Ethereum blockchains using Chainlink’s Cross-Chain Interoperability Protocol (CCIP).

As reported by NewsBTC, the partnership aims to facilitate the “access, trade, and seamless settlement of tokenized assets across networks in different currencies in a process called Delivery vs. Payment (DvP).”

The crypto community appeared to receive the news well. X users expressed their positive sentiments towards the collaboration and Chainlink’s token. The sentiment has seemingly translated to LINK’s performance, as the token’s price soared 9% in the last 24 hours.

Crypto analyst and trader The Lord of Entry shared his prediction for LINK. In the X post, the trader highlights that the token’s performance in the past day had been strong as it broke above the $18.5 resistance level. Chainlink’s LINK unsuccessfully tested the resistance zone over the past week after falling below it on March 18.

The token continued the upward trajectory throughout the day after successfully rising above the $18.5 price. In the early hours of Tuesday, LINK surged above the $20 mark but faced resistance near the $20.5 range.

According to the trader, if the token can break above this level and turn it into a support zone, the next big target for LINK would be the $28 price range.

As of this writing, LINK tested this new resistance level, which has been rising above it twice in the past hour. The token reached $20.6 in the first attempt and briefly surpassed the $20.7 price range during the second attempt. However, the token momentarily failed to flip the resistance zone and fell below $20.5 again.

Chainlink’s “Very Strong” Long-Term Performance

Despite the failed attempts, LINK’s price surged 9% in the past 24 hours. Interest in the token has seemingly risen in the same timeframe as its market activity increased by 55.19%, reaching a daily trading volume of $539.9 million.

Its market capitalization also increased by 8.16% in the past day, reaching $12.02 billion. Chainlink is the 14th-largest cryptocurrency by this metric, according to CoinMarketCap data.

Moreover, LINK has shown a remarkable 182.6% performance in the last year. As a result, crypto analyst Altcoin Sherpa shared some notes on LINK, suggesting that it shouldn’t be actively traded. Sherpa stated that the token is a better fit to “buy and hold” as it is a “safe coin that is going to do strong numbers.”

The analyst considers LINK fundamentally “very strong” and one of the best tokens based on its long-term performance. Ultimately, Sherpa predicts the price will “consolidate for a bit longer before its next move.”

Chainlink, LINK, LINKUSDT, crypto

Chainlink Facing Strong Rejection From Profit-Taking, Will CCIP Recharge Demand?

One analyst on X notes that Chainlink is facing a tug-of-war between bullish momentum and strong upside resistance from profit-taking traders. For bulls to add to their longs and extend the uptrend, the existing oversupply must be moped, paving the way for more gains above immediate liquidation levels. 

LINK profit taking | Source: Analyst on X

Profit Taking Slowing Down LINK Bulls

Looking at the LINK price action in the daily chart, it is clear that buyers have the upper hand. Bulls have been relentless since the token bottomed out in September 2023. 

Since then, LINK has doubled, even breaking above the psychological round number at $20. At press time, buyers are still in control, snapping back to trend despite the market-wide cool-off after Bitcoin crashed last week. 

Chainlink prices trending upward on the daily chart | Source: LINKUSDT on Binance, TradingView

LINK is within a broader range, with clear caps at around $17.9 on the lower end and $21.7 on the upper end. After protracted expansion from September, the emergence of a ranging market could suggest that traders are exiting their positions, slowing down the uptrend.

This has been confirmed by on-chain data that the analyst tagged, explaining the recent slowdown. Indeed, on-chain data suggests investors have been cashing in on the recent expansion.

As a result, the excess supply needs to be absorbed by the market before LINK Bulls builds enough momentum to drive the coin to new 2024 highs above $21.8.

 Chainlink CCIP Adoption To Recharge Demand?

Despite the short-term headwinds, Chainlink bulls are banking on the widespread adoption of the Chainlink Cross-Chain Interoperability Protocol (CCIP) as a demand catalyst. CCIP is critical for blockchain interoperability. The solution allows secure communication between smart contracts of linked blockchains and external data sources.

CCIP has been adopted by, among others, Metis, a layer-2 scaling solution for Ethereum. Circle, the issuer of USDC, a stablecoin, is also leveraging the platform to enhance interoperability.

Recent data shows a surge in CCIP revenue, pointing towards increased adoption of this multichain bridging platform. As of March 26, Dune Analytics data shows that the CCIP has generated over $484,000 in revenue. This figure will likely increase as CCIP finds adoption and Chainlink integrates with even more protocols, businesses, and blockchains. 

CCIP revenue | Source: Dune Analytics

Still, the pace at which LINK breaks above March highs and registers fresh 2024 highs will also demand the performance of other coins, including Bitcoin and Ethereum. A resurgent BTC could draw more capital, lifting altcoins, including LINK, in the process.

LINK Price Regains Strength, Why Chainlink Could Surge Over 10%

Chainlink’s LINK price is moving higher above the $20.00 resistance. The price is now up over 5% and might aim for a move toward the $25.00 resistance.

  • Chainlink price is showing positive signs above $20.00 against the US dollar.
  • The price is trading above the $20.50 level and the 100 simple moving average (4 hours).
  • There was a break above a key bearish trend line with resistance near $20.00 on the 4-hour chart of the LINK/USD pair (data source from Kraken).
  • The price could rally further if it clears the $22.00 resistance zone.

Chainlink (LINK) Price Eyes More Upsides

In the past few sessions, Chainlink bulls were able to send the price above a few key hurdles at $18.50. Earlier, LINK price formed a base above the $16.75 and started a fresh increase.

There was a break above a key bearish trend line with resistance near $20.00 on the 4-hour chart of the LINK/USD pair. The bulls pumped the pair above the $22.00 level. A new multi-month high was formed at $22.85 before the price started a downside correction.

There was a move below the $22.00 level. The price declined below the 23.6% Fib retracement level of the upward move from the $16.75 swing low to the $22.85 high.

LINK is now trading above the $20.50 level and the 100 simple moving average (4 hours). The price is up over 5% and outpacing both Bitcoin and Ethereum. If the bulls remain in action, the price could rise further. Immediate resistance is near the $21.80 level.

LINK Price

Source: LINKUSD on TradingView.com

The next major resistance is near the $22.00 zone. A clear break above $22.00 may possibly start a steady increase toward the $23.00 and $24.20 levels. The next major resistance is near the $24.80 level, above which the price could test $25.00.

Are Dips Limited?

If Chainlink’s price fails to climb above the $22.00 resistance level, there could be a downside correction. Initial support on the downside is near the $21.00 level.

The next major support is near the $20.00 level or the 50% Fib retracement level of the upward move from the $16.75 swing low to the $22.85 high, below which the price might test the $18.80 level. Any more losses could lead LINK toward the $17.65 level in the near term.

Technical Indicators

4 hours MACD – The MACD for LINK/USD is gaining momentum in the bullish zone.

4 hours RSI (Relative Strength Index) – The RSI for LINK/USD is now above the 50 level.

Major Support Levels – $21.00 and $20.00.

Major Resistance Levels – $22.00 and $23.00.

Analyst Forecasts $40 Target For Chainlink (LINK)

Chainlink (LINK) continues to remain among the headlines following a negative performance, which saw the token’s price decline by 7.63% in the last week based on data from CoinMarketCap. However, despite this discouraging price loss, investors and market experts appear to remain bullish on the altcoin. For instance, popular crypto analyst Michaël van de Poppe has recently released a price prediction that states LINK could double its market price in the coming months.

Chainlink (LINK) Poised To Notch 122% Gains, Analyst Says

In a Friday post on X, Michaël van de Poppe presented a bullish case for Chainlink using the LINK/BTC 3-day chart. The analyst began his prediction by noting LINK’s positive stint in the first two weeks of February, during which the token rose by 32.77% to trade above the $20 price mark.

However, despite this impressive price gain, the prominent altcoin failed to breach a crucial resistance zone at 0.00480 BTC, thus failing to initiate a breakout. Following this event, van de Poppe believes that Chainlink is now seeking a higher low to serve as its support level.  For context, a higher low In technical analysis refers to a pattern on a price chart in which a successive low point in a trend is higher than the previous low point. It is usually interpreted as a bullish signal indicating a potential trend reversal or continuation of an upward trend.Chainlink

After successfully finding its higher low, van de Poppe anticipates LINK to experience a price reversal, gaining by 4,500 satoshis, which is currently valued at $2.29 at the current Bitcoin price of $50,761. Thus, Chainlink could soon return above the $20 mark. Furthermore, the analyst believes this price gain could lead to LINK finally initiating a breakout, hitting a price in the range of $30-$40 within the next few months. If this prediction proves true, the altcoin could experience a potential maximum gain of 122.71% on its present market price.

LINK Price Overview

At press time, Chainlink continues to exchange hands at $17.96 with a 0.11% gain in the last day. Meanwhile, the token’s daily trading volume has experienced a slight decline of 0.70% and is now valued at $426.65 million. Based on market shares, Chainlink is ranked as the 12th largest cryptocurrency with a total market cap value of $10.55 billion.

Chainlink

LINK trading at $17.944 on the daily chart | Source: LINKUSDT chart on Tradingview.com

Chainlink Open Interest Sitting At Record Levels, What This Means For Price

Chainlink has seen its open interest spike significantly in the month of February, so much so that it has reached new all-time highs. This trend has not waned despite the decline in the price of the cryptocurrency, which could paint a rather bullish picture for the LINK price going forward.

Chainlink Open Interest Crosses $450 Million

The Chainlink open interest ended the month of January on a high note and carried this trend into the month of February. A major jump was seen between January 31 and February 3 when the open interest went from below $250 million to more than $320 million.

In the days following this, the open interest continued to rise, and eventually hit a peak of $533 million. This was significant because it was not just the highest point for the year but it is the highest that the open interest has ever been for the asset.

Chainlink Open interest

As expected, the price would quickly rise to keep up with the open interest as investors continued to place their bets on the price. There has been a retracement in the open interest. However, Chainlink has continued to maintain more than $450 million in open interest since February 12.

Currently, Coinglass data shows that the Chainlink open interest is $456 million as of February 23, continuing to maintain a high level. Given this, it might be prudent to look at how the LINK price has reacted in the past when open interest remained elevated.

Historical Performance Of The LINK Price

While the Chainlink open interest is at record levels, there have been times in the past where the open interest had been elevated for a period of time like it is now. So, how the price reacted during those periods could provide a pointer for how it might perform now.

The last time that the open interest was this elevated for a long period of time was back in October-November 2023 when open interest more than doubled. It would maintain this elevated level for almost a month, but at the end of it, the LINK price would react positively and saw a price surge from $11 to $15, which was a 36% increase in price.

If this scenario were to repeat now, then a 36% increase would send the LINK price to $24. This is not particularly hard to believe, given that the LINK price had topped out at $52 in the last bull market. So, such a move would still leave it 50% below its all-time high levels.

On the flip side of this, the open interest levels could also taper off, as was seen in November 2023. This could see the LINK open interest lose its hold on the $450 million that it maintained in February and fall toward $400 million before recovering again.

Chainlink Takes Over Dogecoin In Key Metric As Mysterious Whale Pushes LINK Upwards

Chainlink (LINK) is now experiencing three weeks of robust positive price activity, putting it well ahead of the overall cryptocurrency market. LINK’s price has skyrocketed over 48% since January 25, surpassing $20 on February 11 for the first time since February 2022.

Amidst this price surge, which saw the cryptocurrency moving closer to Dogecoin in market cap rankings, on-chain data has revealed a consistent whale accumulation. One whale, in particular, has accumulated $83.6 million worth of LINK in the past five days.

Chainlink Overtakes Dogecoin In Market Cap

Chainlink’s price movement this year has been surprising, and current price action shows no intention of slowing down anytime soon. LINK, the decentralized oracle network’s token, recently overtook Dogecoin to become the 10th largest cryptocurrency by market capitalization.

At the time of writing, LINK’s market cap is $11.85 billion compared to DOGE’s $11.46 billion. The recent surge in LINK’s price and market cap seems driven by whales and investors accumulating the token.

According to data from IntoTheBlock, LINK whale transactions greater than $100,000 totaled more than $1.29 billion in the past seven days.

Notably, total exchange outflows in the same period have far outweighed inflows, indicating the current holding sentiment from LINK traders.

IntoTheBlock’s exchange metric shows that $282.6 million worth of LINK was withdrawn from exchanges in the past seven days, compared to an inflow of $154.89 million. 

chainlink linkusdt 2 link

One whale has been scooping up massive amounts of LINK from crypto exchange Binance in the past seven days. Blockchain data analysis platform Lookonchain has revealed that 4,556,684 LINK ($83.6 million) have been withdrawn from the exchange within the past five days and placed in 55 new wallets.

Although the outflow has gone into multiple wallets, the pattern of withdrawals suggests that one entity is carrying out the accumulation. 

What’s Next For LINK?

At the time of writing, Chainlink is trading at $20.21. Although still up by 9% and 36.13% in the past seven and 30 days, respectively, the price surge seems to be slowing down, and the crypto has since corrected 2% from a yearly high of $20.63 in the past 24 hours.

Chainlink LINK LINKUSDT

On the broader end, the crypto market seems to be catching up in gains, as most cryptocurrencies witnessed inflows led by Bitcoin last week. Dogecoin wasn’t excluded from this inflow, with its price spiking 7.3% from 0.0776 to 0.08327. Dogecoin is currently trading at $0.08046. 

LINK’s market cap currently stands above DOGE by $390 million. An increase in LINK accumulation by traders could continue to widen the difference between the assets. 

Chart from Tradingview

Chainlink Breeds New Whales As $49.9 Million Accumulation Spree Cause Prices To Surge

Chainlink (LINK) has traders buzzing as its price has been up by 40% since the last week of January, massively outpacing the broader cryptocurrency market. Amidst this price spike, mysterious whale wallets have been topping up their holdings, as evidenced by on-chain data. 

According to blockchain tracker Lookonchain, there’s been a massive outflow of LINK from crypto exchange Binance in the past two days, particularly with 49 new wallets receiving 2,745,815 LINK within this timeframe. 

Massive LINK Accumulation Occurs On Binance Before Withdrawal

Details from Binance point to an ongoing accumulation of LINK from the crypto exchange. In the middle of this accumulation, a particular whale or institution has been going on a buying spree, gobbling up more than 2.7 million LINK tokens worth $49.9 million. This accumulation came days after the Lookonchain noticed that four new wallets had withdrawn over 119,583 LINK tokens worth over $2.15 million from Binance.

Similarly, Lookonchain noted that another whale address “0x2A19” has withdrawn 494,957 LINK tokens worth $9 million from Binance in the past 10 days. Notably, whale transaction tracker Whale Alerts has also noted some accumulation of LINK tokens from other crypto exchanges.

Analytics platform Santiment also noted that LINK whale addresses have upped their activity amidst the price surge as large amounts of coins were moved by previously stagnant wallets. This influx of tokens back into the network’s circulation, coupled with a minor liquidation of wallets, seems to have contributed to the price spike.

How Will New Chainlink Whales Impact Price Action Going Forward?

The crypto industry is currently going through a modest price gain led by Bitcoin recently breaking above the $44,000 level again. As a result, the industry is now up by 3.25% in the past 24 hours, with a 22.60% increase in trading volume. 

LINK hasn’t been left out of this price gain, registering a 4.30% gain in the past 24 hours. However, LINK has been on a sustained breakout since January, reaching as high as $19.68 on February 5. 

The price spike isn’t particularly surprising, as fundamentals of the Chainlink ecosystem point to a steady price growth for LINK. Chainlink’s role in DeFi and NFTs with its smart contracts oracles cannot be overstated. Chainlink also recently released its Staking v0.2 protocol in December, allowing investors to stake a minimum of 1 LINK for a base floor reward rate of 4.5% per year in LINK.

Consequently, the massive accumulation of LINK by whales is a very bullish signal for the token’s price action going forward. These large investors see LINK’s long-term value and potential and are loading up their bags in anticipation of higher prices.

LINK price chart from Tradingview.com (Chainlink whales)

Whale Rapidly Accumulating Chainlink: What’s Going On With LINK?

A mysterious whale is rapidly accumulating Chainlink (LINK). According to Lookonchain, the unknown entity, possibly an institution, withdrew over 2.2 million LINK (worth $42.38 million) via 47 new wallets from Binance, the world’s largest crypto exchange by trading volume, in two days.

This sudden block withdrawal now raises questions about what’s driving the whale’s interest and what it could mean for LINK in the coming days.

Crypto whale accumulating LINK | Source: Lookonchain via X

Chainlink Is Key In DeFi And NFTs, Gradually Improving 

Chainlink is a popular project that provides secure middleware services and allows smart contracts to access tamper-proof external data. For this role, the platform has been adopted by multiple protocols offering decentralized finance (defi) services in Ethereum and beyond. 

Additionally, Chainlink plays a role in non-fungible tokens (NFTs) through its random number generator (RNG). It continues to release new products and enhance its features.

To illustrate, in November, Chainlink upgraded its staking mechanism, releasing v0.2, which significantly increased the pool size to 45 million LINK. 

The platform noted that the decision was to attract more investors and, more importantly, bolster its security while concurrently aligning with its broader objective of attaining the “Economics 2.0” plan.

Initially, staking began in December 2022. The goal was to incentivize participation by expanding the utility of LINK and allowing stakers to receive rewards. 

The release of v0.2 in November means more tokens can be locked, helping make LINK scarce, considering the role of the token in the vast Chainlink ecosystem. 

Trackers show that over 40.8 million LINKs have been locked so far. Chainlink confirms that anyone can earn a variable reward rate of 4.32%.

LINK staked | Source: Chainlink

Beyond staking, Chainlink’s Cross-Chain Interoperability Protocol (CCIP) is gaining adoption. To illustrate, the Hong Kong Monetary Authority (HKMA) initiated its first phase of e-Hong Kong Dollar (e-HKD) trials in November, integrating CCIP. 

As part of this trial, the regulator wanted to illustrate the capabilities of programmable payments enabled by Chainlink via its solution, CCIP. In DeFi, protocols such as Synthetix and Aave have adopted CCIP. 

Will LINK Breach $20?

With more protocols and traditional institutions leveraging the technology, the demand for LINK (and prices) will likely increase as the fear of missing out (FOMO) kicks in.

While the whale’s motives remain unknown, their large-scale LINK accumulation suggests they might be bullish on the token. Notably, it coincides with the sharp expansion of LINK prices in the past 48 hours. 

Chainlink price trending upward on the daily chart: Source: LINKUSDT on Binance, TradingView

So far, the token is changing hands slightly below the $20 psychological resistance. Any breakout above this level might lift the token to around $35 in Q3 2021.

Chainlink Breakout: LINK Poised For 38% Rally If It Clears This Key Resistance

Decentralized oracle network Chainlink (LINK) has been making significant strides in the altcoin market, outperforming its peers with an impressive 44.8% price increase over the past 30 days. 

Surging to a 24-month high, the cryptocurrency has inched closer to the $20 mark, attracting the attention of bullish investors. Notably, the uptrend for LINK may be far from over, as it can potentially record a substantial 38% price gain by breaking through a critical resistance level.

Chainlink Trading Volume Skyrockets

Crypto analyst Ali Martinez indicates that Chainlink faces formidable resistance between its current trading price of $19.40 and $20.03, with 5,330 addresses collectively holding over 8.59 million LINK. 

Chainlink

Despite this supply wall, if Chainlink manages to break through, Ali Martinez suggests that the next critical resistance level stands at $26.87, presenting an opportunity for a significant 38% price surge.

Adding to the positive outlook, Chainlink has witnessed a surge in trading volume and an increase in circulating market cap over the past few days. 

Data from Token Terminal reveals that while Chainlink’s trading volume has steadily risen over the past 30 days, the token experienced exceptional trading volume of over $9.5 billion in the past three days alone. This surge in trading activity suggests a growing interest from investors in the Chainlink protocol.

Chainlink

Examining the circulating market cap, Token Terminal data highlights a positive trend. The circulating market cap of Chainlink stands at $10.53 billion, displaying a notable increase of 32.66% over the past 30 days. In terms of fully diluted market cap, Chainlink records $18.16 billion, indicating a substantial rise of 28.89% over the same period.

Institutional Interest In LINK?

Recent blockchain data suggests that institutional investors are actively accumulating LINK. According to Spot On Chain data, the emergence of eight wallets withdrawing a substantial amount of LINK tokens, coupled with a price surge shortly after, indicates institutional interest in the cryptocurrency. 

Over the past twelve hours, eight new wallets, likely representing a single individual or institution, have collectively withdrawn 227,350 LINK tokens, equivalent to approximately $4.12 million at the withdrawal time. 

Notably, a significant portion of these tokens was withdrawn from centralized exchanges (CEX) just before the price experienced a sudden increase of approximately 4.1%. This pattern suggests that institutions may strategically accumulate LINK tokens, anticipating future price appreciation.

Moreover, as indicated by its performance on the algorithmic market scanner Commando, LINK has consistently been a top performer in the cryptocurrency market. 

According to the market intelligence platform Decentrader, with a current score of 1.83 and a green signal on low time frames, Chainlink’s technical analysis suggests a positive outlook for the cryptocurrency. Noteworthy is the recent breakthrough of Chainlink’s price from a range held up by the 200-week moving average (200WMA). 

This breakout indicates a shift in market sentiment and a potential upward trend. The cryptocurrency is now aiming to target the “Sniper resistance” level just above $20 while finding support at the top of the previous range, around $16.8, according to Decentrader. 

Overall, institutions’ accumulation of Chainlink tokens and the cryptocurrency’s technical breakout point to growing confidence in LINK’s investment potential. 

The withdrawals from centralized exchanges suggest a desire to hold LINK tokens outside exchange custody, possibly indicating a longer-term investment strategy. 

Chainlink

Currently, LINK is trading at $19.7, up 8% in the last 24 hours.

Featured image from Shutterstock, chart from TradingView.com

Chainlink Price Stalls As $287 Million Worth Of LINK Makes Its Way To Binance

The price performance of Chainlink is one of the previous week’s biggest narratives, rivaling Bitcoin making its way above $43,000 again. According to data from CoinGecko, the altcoin recorded a significant 25% price increase in the last seven days.

However, the price of LINK seems to be slowing down, as it keeps struggling to hold above the $18 level. While expectations are that this sluggishness will blow over soon, the question still is – why is the Chainlink price stalling?

16 Million LINK Tokens Transferred To Binance

The latest on-chain revelation has offered insight into why the price of LINK is facing some form of bearish pressure. In a post on X, crypto analytics firm SpotOnChain disclosed that 19 million tokens (worth about $341 million) were recently unlocked from three of Chainlink’s non-circulating supply contracts.

In a more detailed breakdown, the on-chain analytics firm revealed that 15.95 million tokens (valued at $287 million) were moved to Binance, the world’s largest centralized exchange. Meanwhile, the remaining 3.05 million Chainlink (worth $54.3 million) were transferred to multi-sig wallet, 0xD50f.

According to SpotOnChain, this is not the first time transactions involving Chainlink’s wallets and of this caliber will happen. The analytics platform disclosed that Chainlink has been unlocking and transferring some of the unlocked tokens to Binance as far back as 2022.

On-chain data shows that Chainlink has unlocked a total of 106 million tokens, with 88.95 million LINK sent to Binance since August 2022. At an average price of $9.06, the entire worth of these transactions stands at $805 million.

SpotOnChain noted that the last two unlocks have been followed by a slight dip in LINK’s price. The last unlock saw the Chainlink token fall from almost $19 to $17.5 on Saturday, February 3.

As of this writing, the LINK token is valued at $17.86, reflecting a nearly 1.5% price jump in the past day.

Chainlink Records Multi-Month High In Transaction Volume

It appears that the price of LINK will not remain stagnant for very long, as the most recent on-chain data indicates that Chainlink has experienced a notable increase in network activity over the last few days. Positive network fundamentals could be all the altcoin needs to resume its bullish run.

According to Ali Martinez, the network recently witnessed a significant surge in transaction volume, bringing the metric to its highest in almost two years. Based on IntoTheBlock’s data, more than 72.24 million LINK tokens (equivalent to $1.3 billion) were transacted on Friday, February 4. 

Chainlink

Chainlink (LINK) Breakout: Accumulation Zone Points To Upside Potential, $20 In Sight

The decentralized Oracle network Chainlink and its native token LINK have grown impressively in the past month. Despite experiencing a correction since late December, where LINK reached a 20-month high of $17.6, the token has shown signs of renewed bullish momentum. 

Key Resistance Levels For LINK’s Price Rally

Renowned crypto analyst Ali Martinez has identified a robust demand zone for Chainlink between $14.8 and $15.2, slightly below its current trading price of $15.415. 

Within this range, many addresses (17,650) purchased 85.12 million LINK. With limited resistance, LINK appears to be well-positioned to advance towards the $20 mark.

Chainlink

Based on the analyst’s observations, if the current bullish momentum witnessed over the past seven days persists, LINK could swiftly reach the $20 price level. Looking at LINK’s 1-day chart, the next resistance levels to overcome before potentially climbing toward $20 are $15.55, $16.69, and $16.92. Breaching these levels would pave the way for a clear path towards the $20 milestone.

However, it is important to note that in the absence of major resistance walls, the battle for the next direction of LINK’s movements remains equally balanced. In the event of another price correction or selling pressure, the token lacks significant support walls to rely on.

Chainlink

Analyzing LINK’s 1-day chart, the first support level in the event of a drop would be around $14.22. If this level is breached, the next support stands at $13.31. A further decline could test the support at the $11 price level. A breach of this level could signify a breakdown in the four-month bullish structure of LINK.

Chainlink Ecosystem Growth

Despite the battle for supremacy between LINK’s bulls and bears, the protocol’s ecosystem has shown notable growth in key metrics since the last update. For example, Chainlink’s circulating market capitalization is $8.35 billion, reflecting a positive growth rate of 3.58%.

According to Token Terminal data, in terms of revenue over the past 30 days, Chainlink has generated $11.67 thousand. However, this figure shows a decline of 54.16% compared to the previous period, indicating a decrease in earnings during this timeframe.

Considering the fully diluted market capitalization, which considers the maximum number of Chainlink tokens that could exist in the future, the value stands at $14.82 billion. This metric has experienced a slight increase of 3.48% recently.

When it comes to revenue on an annual basis, Chainlink has generated $219.81 thousand. This represents a positive growth rate of 2.64%, indicating an upward trend in the company’s earnings over a year.

Regarding financial ratios, Chainlink’s price-to-fully-diluted ratio is calculated at an astonishing 68,246.47x. This metric compares the company’s market capitalization to its fully diluted market capitalization. It reflects the premium investors will pay for each unit of potential future tokens.

Similarly, based on the fully diluted market capitalization, the price-to-sales ratio is reported to be 68,246.47x. This ratio measures the company’s valuation relative to its annualized revenue and indicates how much investors will pay for each dollar of sales generated.

Featured image from Shutterstock, chart from TradingView.com 

LINK Price Rallies Over 5%, A New Uptrend In Making For Chainlink?

Chainlink’s LINK price is moving higher above the $15.00 resistance. The price is now up over 5% and might aim for a move toward the $18.00 resistance.

  • Chainlink price is showing positive signs above $14.50 against the US dollar.
  • The price is trading above the $15.00 level and the 100 simple moving average (4 hours).
  • There was a break above a key bearish trend line with resistance near $14.85 on the 4-hour chart of the LINK/USD pair (data source from Kraken).
  • The price could rally further if it clears the $16.40 resistance zone.

Chainlink (LINK) Price Eyes More Upsides

In the past few sessions, Chainlink bulls were able to send the price above a few key hurdles at $14.50. Earlier, LINK price formed a base above the $12.50 and started a fresh increase.

There was a break above a key bearish trend line with resistance near $14.85 on the 4-hour chart of the LINK/USD pair. The bulls pumped the pair above the 50% Fib retracement level of the downward move from the $17.59 swing high to the $12.50 low.

LINK is now trading above the $15.00 level and the 100 simple moving average (4 hours). The price is up over 5% and outpacing both Bitcoin and Ethereum. If the bulls remain in action, the price could rise further. Immediate resistance is near the 61.8% Fib retracement level of the downward move from the $17.59 swing high to the $12.50 low at $15.65.

Chainlink (LINK)

Source: LINKUSD on TradingView.com

The next major resistance is near the $16.40 zone. A clear break above $16.40 may possibly start a steady increase toward the $17.50 and $18.00 levels. The next major resistance is near the $18.80 level, above which the price could test $20.00.

Are Dips Limited?

If Chainlink’s price fails to climb above the $15.65 resistance level, there could be a downside correction. Initial support on the downside is near the $14.50 level.

The next major support is near the $13.70 level, below which the price might test the $13.00 level. Any more losses could lead LINK toward the $12.50 level in the near term.

Technical Indicators

4 hours MACD – The MACD for LINK/USD is gaining momentum in the bullish zone.

4 hours RSI (Relative Strength Index) – The RSI for LINK/USD is now above the 50 level.

Major Support Levels – $15.00 and $14.50.

Major Resistance Levels – $15.65 and $16.50.

Is Chainlink and Polygon About to Rip Higher? Whales Accumulating

According to Lookonchain data on December 20, whales are actively accumulating Chainlink (LINK) and Polygon (MATIC) and moving them from Binance, one of the world’s largest cryptocurrency exchanges by trading volume. 

Citing on-chain transfers, Lookonchain notes that LINK is specifically seeing significant accumulation from a fresh wallet labeled “0x8eAD,” which has withdrawn 247,860 LINK worth approximately $3.5 million from Binance in the past two days.

Meanwhile, two new wallets, “0xa813” and “0x38b3”, have been actively accumulating MATIC, withdrawing 5 million MATIC worth around $3.13 million from Binance earlier today.

Chainlink whale moves coins | Source: Lookonchain via X

Whales Accumulating, Will MATIC And LINK Rally?

The fact that whales, individuals, or entities controlling large amounts of a particular token or coin are circling MATIC and LINK is net bullish and might support prices in the coming sessions. 

Notably, the transfer is considered bullish when whales move coins from exchanges to non-custodial wallets like hardware wallets or even hot wallets to engage in decentralized finance (DeFi), degen trading, or NFT trading. 

This shift is because, unlike in centralized exchanges like Binance, where their intention is usually trading for other coins or USDT, in on-chain apps, they can use the same stash to earn rewards, for instance, by providing liquidity or staking. 

Therefore, considering the recent transfer, LINK and MATIC prices might recover, increasing in the coming few trading sessions. Thus far, looking at candlestick formations in the daily chart, LINK is stable and remains within an uptrend. Notably, prices are trading above the 20-day moving average, suggesting that the coin found support. LINK is currently up 155% from September lows but down 15% from November peaks. 

Chainlink price trending upward on the daily chart | Source: LINKUSDT on Binance, TradingView

On the other hand, MATIC is also stable and rejects attempts for lower lows. After days of consolidation, the coin has support at around $0.70, matching a critical level recorded in November. 

Still, whether the uptrend will resume depends on whether prices will float higher, breaking above $0.93 or November 2023 highs in the coming session. 

Technically, $0.95 marks a critical reaction level for MATIC that, if comprehensively broken, could open the doors for $1.20 and $1.60 in the coming sessions.

Polygon And Chainlink Roll-Out Critical Features

Beyond current technical formations, fundamental events prop up Polygon and Chainlink bulls, especially around decentralized finance (DeFi) and layer-2 scaling. 

Chainlink’s new staking upgrade aims to mop more LINK from circulation, possibly increasing prices on rising demand for Cross-Chain Interoperability Protocol (CCIP). 

Meanwhile, as other blockchains repurpose to become Ethereum layer-2, Polygon CDK is becoming a critical cog in fast-tracking the process, directly supporting MATIC prices.

LINK Price Climbs Above $16 Again – What’s Behind The Latest Surge?

The LINK price seems to be intensifying its bullish momentum again after cooling off over the past few weeks. Despite the recent sluggishness in Chainlink’s price action, the cryptocurrency has maintained most of its profit and managed to stay above the $14 level in the past weeks.

Interestingly, the LINK price recently made its way above the $16 mark for the second time in less than a month. But here is the question – what is driving the latest surge?

On-Chain Data Reveals Catalyst For Chainlink’s Jump To $16

The latest on-chain revelation from Santiment has offered insight into the catalyst behind LINK’s price jump to $16. According to data from the crypto analytics firm, Chainlink’s richest wallets have made a substantial amount of token purchases in the past few days.

In a December 2 post on X, Santiment revealed that LINK whales bought about 3.9 million tokens (worth more than $62 million) in the past three days. This data point highlights an increase in the total amount of tokens held by the 200 largest Chainlink addresses.

This recent market activity underscores the current accumulation trend amongst Chainlink whales. According to data provided by Santiment, the top 200 wallets have loaded up more than $50 million worth of LINK tokens in approximately five weeks.

Furthermore, the on-chain analytics firm also revealed that the 200 largest Chainlink addresses currently hold a combined 746.57 million tokens (equivalent to a massive $11.84 billion). This figure represents nearly 75% of LINK’s total supply.

This accumulation trend is a positive sign for LINK and its price trajectory, as it suggests that large investors are keeping their faith in the asset and banking on the token’s price growth.

Is LINK Outperforming Bitcoin?

As of this writing, the LINK token is valued at $16.11, reflecting a nearly 2% price increase in the last 24 hours. According to data from CoinGecko, the cryptocurrency has jumped by more than 7.5% in the past week.

With its market capitalization rising by more than 143% in the last five months, Chainlink’s performance over the past few months is even more remarkable. Moreover, the altcoin has held its own against the premier cryptocurrency, Bitcoin.

Based on data provided by Santiment, LINK has outperformed the market leader by over 93% – in terms of market cap – in the past five months. This is especially impressive considering that Bitcoin has also been on a positive run, recently breaking above $39,000 for the first time in over a year.

Nevertheless, Bitcoin maintains its position as the top cryptocurrency with a market cap of $772 billion. Comparatively, LINK ranks as the 12th-largest asset with a $9 billion market capitalization.

LINK

LINK Price Breaks Above $15 With 33% Rally – Is $18 The Next Stop?

LINK price has undoubtedly been one of the major highlights of the cryptocurrency market in 2023. Over the past week, the cryptocurrency maintained its recent positive momentum, reaching a new yearly high of $15.8 on Thursday, November 9. 

A crypto analyst and trader who predicted this latest bullish run has offered more insight on what to expect from the Chainlink token.

What’s Next For LINK Price?

A crypto analyst with the pseudonym Mags took to X (formerly Twitter) to share an interesting update on the LINK price action. While referring to their initial analysis, the crypto analyst predicted the likely movement of Chainlink’s price over the coming days.

In the October 22 analysis, Mags highlighted that the price of LINK had broken out of a 512-day consolidation wedge. The crypto trader then forecasted a straight rally to $12.54, a level the altcoin had surpassed earlier this week.

From the current standpoint, Mags believes that the LINK price will continue its “vertical” upward run without any re-test. “Expecting one more leg up till $18 before any HTF pullback,” the crypto analyst postulated in their post on X.

As of this writing, the LINK token is valued at $15.06, reflecting more than a 3.6% price increase in the past 24 hours. While the altcoin’s price has been moving mostly sideways in the last few days, it has maintained most of its gains in the past week.

According to data from CoinGecko, the Chainlink token has swelled by more than 33% over the past seven days. This figure underscores the altcoin’s position as one of the best performers in the crypto market over the last few months.

Chainlink’s Whale Activity Hits Six-Month High

A recent on-chain data report by blockchain analytics firm Santiment revealed that whale activity on the Chainlink network had hit its highest level in six months. Interestingly, the network is not alone in this trend, as other blockchains, including Bitcoin, Ethereum, and Cardano, have also experienced a similar spike in whale activity.

LINK Price

As Santiment noted, while there might be some profit-taking amongst the whales at the conclusion of the week, this does not necessarily mean that tops are imminent. Hence, the analytics firm’s revelation somewhat strengthens the case of a continuous upward movement for the LINK price.

LINK Price

Analyst Forecasts Chainlink (LINK) To Fall Below $10 Following Massive Price Surge

Chainlink (LINK) has emerged as one of the top cryptocurrencies in the last week following an impressive market performance which saw the token gain by 46.49% in the past seven days.

Even amidst whale movements, which suggest that investors are taking profit, LINK has managed to maintain its bullish momentum, gaining by 6.10% in the last day to above the $11 mark.

However, despite the positive sentiment that has currently overwhelmed the LINK market, some analysts believe the token may be due for a major retracement. 

LINK To Fall Below $10: Is The Bullish Run Over?

In a post on X on Friday, crypto analyst Altcoin Sherpa shared a prediction that LINK may soon experience a price dip, falling as low as $9.50. 

However, Altcoin Sherpa notes that this potential price loss may not spell the end of LINK’s bullish phase. In fact, the analyst describes the token’s price coming down as “healthy.” 

According to Sherpa’s prediction, LINK’s slide below $10 could simply be a price recorrection before the token resumes its upward trajectory. If this forecast proves true, many traders could view this $9.50 region as a great entry zone.

Interestingly, Cryptonary, another analyst on X, has recently shared a similar price prediction.

In a post on Thursday, Cryptonary called for much caution in the LINK market, stating the crypto asset may not sustain its current high price levels for long. 

To back up this forecast, the analyst states the Relative Strength Index (RSI) shows that Chainlink is currently in the overbought zone, which indicates a price pullback lies on the horizon.

Although many traders have opened long positions on LINK as indicated by the market’s positive funding rates, Cryptonary has advised investors against “joining the crowd”

Similar to Altcoin Sherpa, the analyst predicts LINK’s price to fall to $9.67 for a short-term retracement. However, with strong selling pressure, Cryptonary states that LINK could trade as low as $8. 

At the time of writing, LINK trades around $11.54 with a 0.25% gain on the last day. Meanwhile, the token’s trading volume is up by 8.01% and valued at $824.92 million. 

Chainlink Records Partnership Streak

In other news, Chainlink recently shared with the crypto community its streak of collaborations with major traditional brands in promoting the adoption of blockchain technology.

In a thread posted on X on Friday, the blockchain highlighted its partnership with the Swift payment company aimed at facilitating the seamless transfer of tokenized assets across multiple chains using Chainlink’s Cross Chain Interoperability Protocol  (CCIP). 

In addition to Swift, Chainlink also discussed its partnership with the Depository Trust and Clearing Corporation, the Australia and New Zealand Banking Group Limited, and Vodafone Digital Asset Breaker (DAB).

Chainlink

XRP Price To Go Parabolic, Here’s When

On Wednesday, October 25, a prominent cryptocurrency analyst Dark Defender revealed that the price of XRP will go parabolic in the future, highlighting how it is going to happen and when it is expected to happen. 

Crypto Analyst’s XRP Price Projection

The XRP analyst recently took to X (formerly Twitter) to share his predictions and optimism on the XRP price going parabolic and how it is going to happen.

In the Dark Defender X post, there are two crucial support levels and three resistance levels for the digital asset, which include $0.52 and $0.46 for the support levels, while the resistance levels are $0.66, $1.88, and $5.85. 

According to him, the XRP price could be on its way to surpass the $1 mark if it manages to break through the $0.66 resistance level. And when this happens, the next resistance level will be $1.88. 

The analyst’s recent projection presents a 210.64% price surge if the XRP price breaks through the $1.88 resistance level, which will see the cryptocurrency potentially heading toward the coveted $6 mark.

One interesting thing about the analyst projections is the fact that his projections are based on an examination of the XRP’s weekly market trajectory over the past two years.

According to the chart posted by Dark Defender, the trends that were evident prior to the July surge seem to be resurfacing, suggesting a potential bullish run for XRP between 2024 and 2025.

So far, the XRP analyst is not the only one who believes in a potential price for XRP. Several other experts have shown increased credence about the XRP’s potential price surge this year.

In September, Wells Fargo manager Shannon Thorp predicted the price of XRP could go as high as $500, presenting a bullish concept for the cryptocurrency.

XRP XRPUSDT

Another prominent figure in the crypto space who has expressed his optimism about the XRP price potential is CryptoInsight, drawing comparisons to the Bitcoin fractal from 2017. This is because the question that has been swelling among the crypto community is whether XRP will mirror the 2017 Bitcoin fractal in the coming weeks.

Leaving the result open-ended, he speculated that there is a possibility that XRP will outperform following a five-year period of consolidation.

According to CryptoInsight, this is because most of the cryptocurrencies now basically began their bull market after surpassing their previous peak, but the XRP seems to have plummeted due to the SEC’s lawsuit on Ripple being dropped. 

However, a recent rally has shown a significant 13% surge in the price of XRP over the past week, with a trading volume of $2.3 billion. The cryptocurrency is currently trading at $0.55 as of the time of writing.

With XRP’s recent growth, the cryptocurrency seems to have surpassed some of the leading altcoins in the crypto market, such as Solana (SOL) and Chainlink (LINK).