Litecoin Whale Deposits Big To Binance, LTC’s 3% Drop To Extend?

On-chain data shows a Litecoin whale has made a large deposit to cryptocurrency exchange Binance, which could add to the coin’s decline.

Litecoin Whale Has Transferred 100,000 LTC To Binance Today

According to data from the cryptocurrency transaction tracker service Whale Alert, a large transfer has been spotted on the Litecoin network during the past day.

This transaction involved the movement of 100,000 LTC across the blockchain, worth more than 7 million US Dollars at the time of the move. Since the transfer scale is so large, a whale entity was likely behind it.

Generally, the transfers of whales can be something worth watching out for, as they may end up causing ripples in the market. How a move from such a humongous holder would affect the asset, though, depends on the intent behind it.

Here are some additional details regarding the latest Litecoin whale transfer that may provide a hint about why the investor made the move:

Litecoin Whale

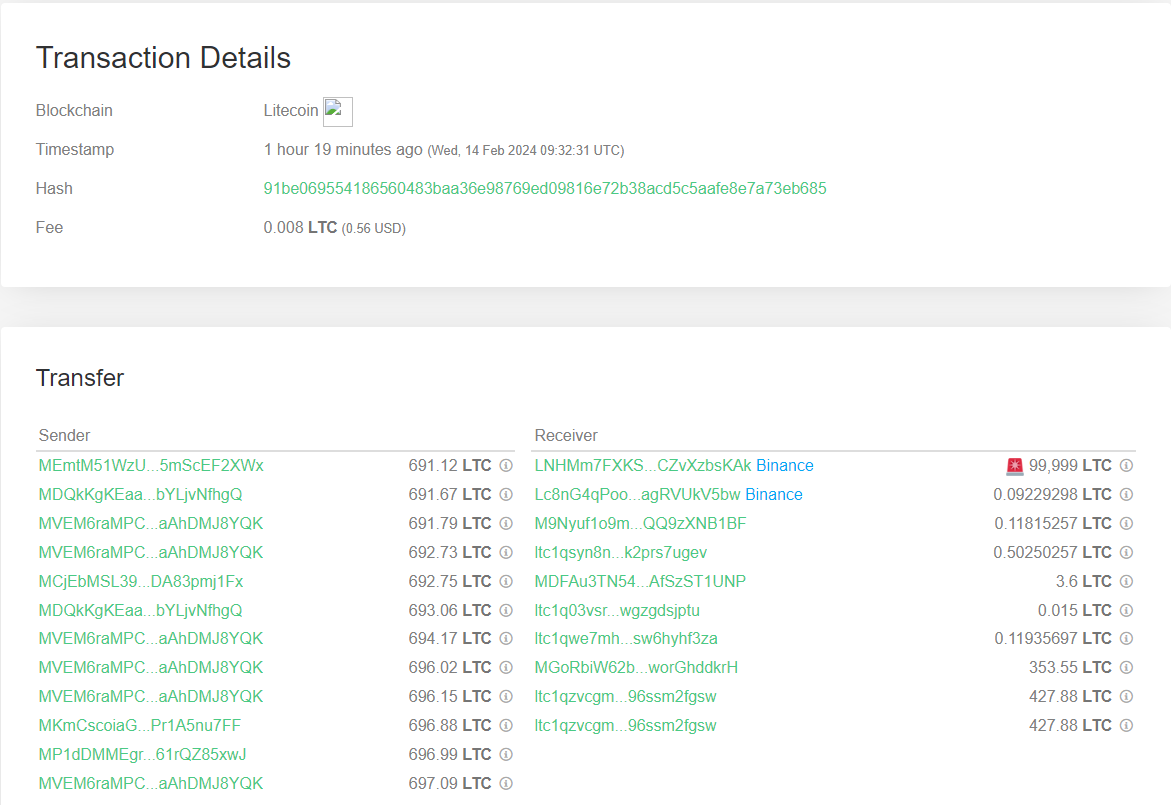
As displayed above, the whale transferred 100,000 LTC to wallets associated with the cryptocurrency exchange Binance in this move. The sending addresses were all unknown wallets that were unattached to any centralized platforms.

Such wallets are usually the investors’ addresses. Transactions like this, where coins move from self-custodial wallets towards exchanges, are called “exchange inflows.”

The latest exchange inflow from the Whale suggests that the investor wanted to use one of the platform’s services, which can include selling. As such, the transfer can be bad news for Litecoin.

LTC Has Gone Down 3% In Past 24 Hours Despite Market Surge

While most cryptocurrency sectors have enjoyed profits during the last day, Litecoin has been the odd one as it has registered negative returns.

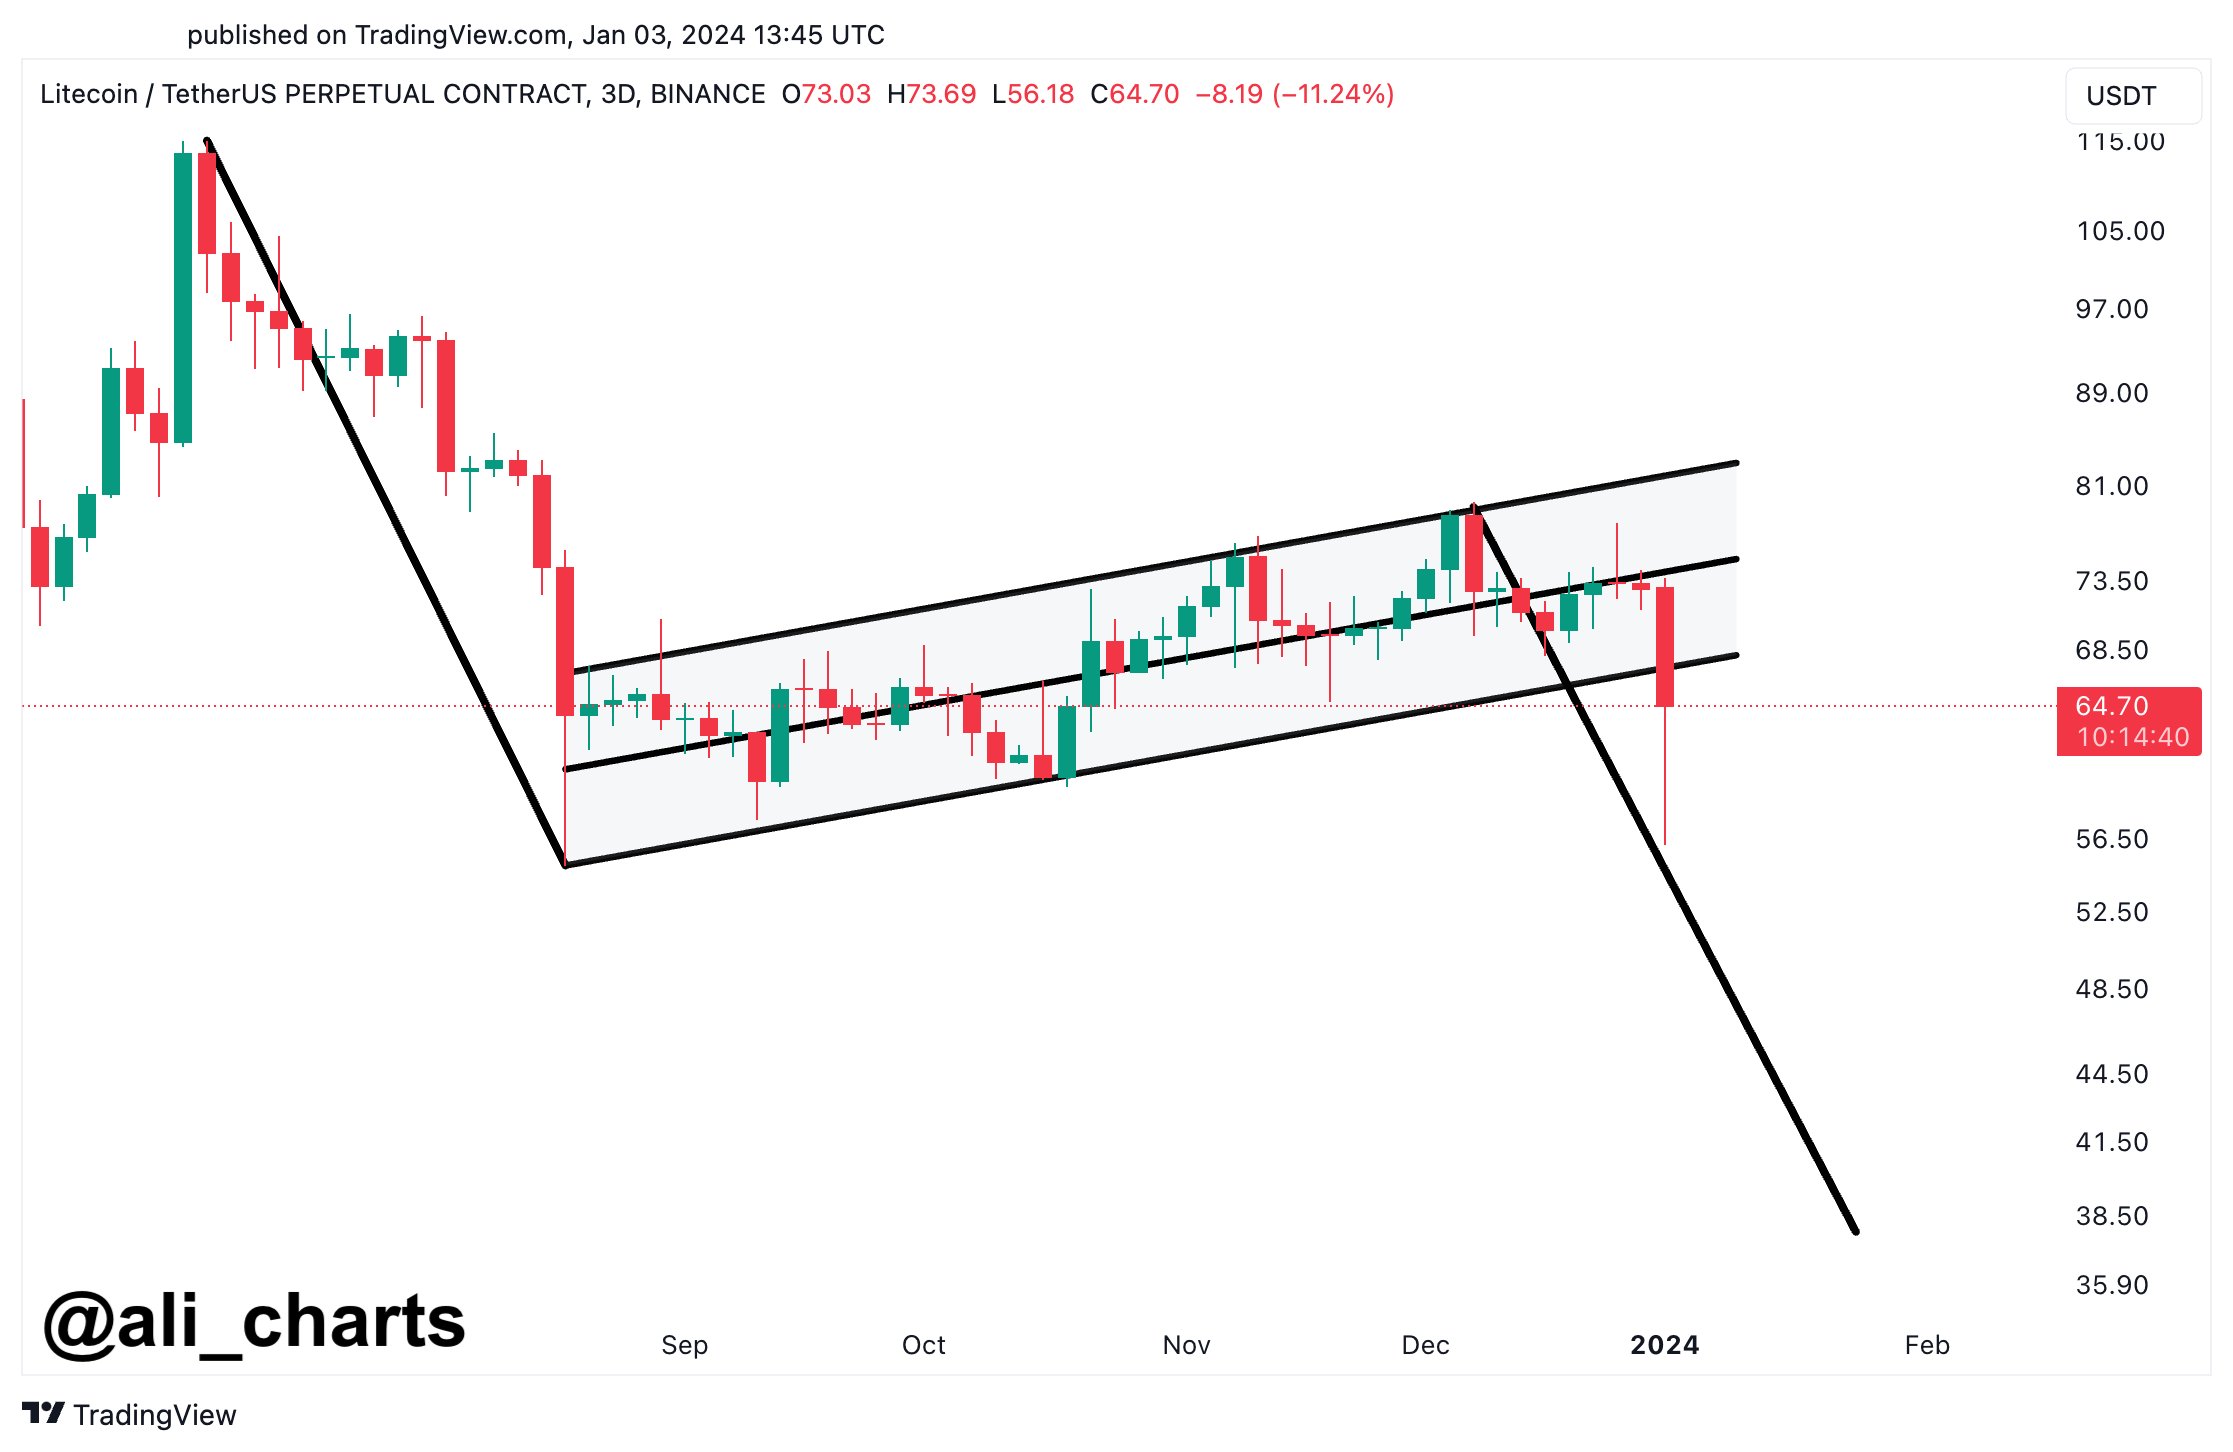
As the chart below displays, LTC plunged from above the $73 level to the $68 mark during its latest drop.

Litecoin Price Chart

Litecoin has registered a bit of a rebound since its low, though, as it has returned above $70. Despite this increase, however, the coin has still been down around 3% in the past 24 hours.

Given the timing of the Binance inflow transaction made by the whale, it’s possible the move was for selling after all, as it coincided with this rebound in the cryptocurrency.

The whale may be using this small surge to exit from the asset, potentially for moving into the greener pastures the rest of the market seems to be providing.

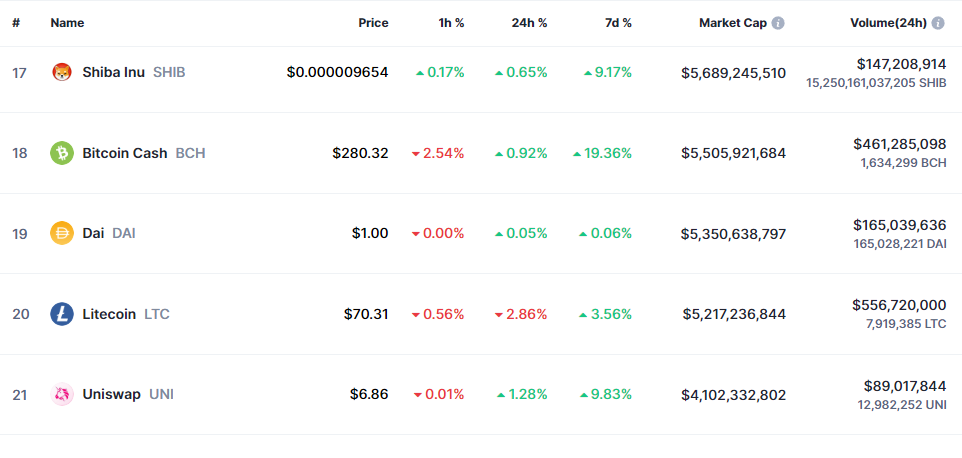
Regarding the market cap, Litecoin has fallen to just the 20th spot on the top cryptocurrencies list, meaning there are nineteen larger digital assets than it currently. There is still some gap between LTC and 21st-placed Uniswap (UNI), so the coin may not be at risk of slipping further, at least for now.

Litecoin Market Cap

Litecoin Bear Flag Could Cause 41% Crash To This Level, Analyst Explains

An analyst has explained that a bear flag is potentially forming for Litecoin, which, if confirmed, might cause a decline for LTC to this level.

Litecoin Could Be In Danger Of Deep Decline Due To This Bear Flag

In a post on X, analyst Ali has pointed out a possible bear flag taking form for Litecoin. A “bear flag” is a pattern in technical analysis that, as its name implies, looks like a flag on a pole.

The pattern takes shape when the asset observes a sharp downward move and follows it up with a period of consolidation. This consolidation happens toward a slight overall uptrend, meaning that its upper level is created by connecting higher highs, while the lower line joins together higher lows.

The downtrend prior to the consolidation makes up for the pole, while the channel looks like a flag. Inside the flag, the price is naturally likely to feel resistance at the upper level, while support is at the lower one.

The bear flag is popularly considered a continuation pattern, meaning that the downtrend would continue after the pattern forms. This continuation happens as the price finally ends its consolidation and crashes through the lower level of the flag.

Like the bear flag, there is also the “bull flag,” which forms in the opposite circumstances. In the case of this pattern, the price breaks out with a sharp upward move after the consolidation period toward the downside finishes.

Now, here is the chart shared by the analyst that sheds light on a possible bear flag forming in the 3-day price of Litecoin:

Litecoin Bear Flag

From the graph, it’s visible that Litecoin’s 3-day price has possibly been consolidating inside a bear flag during the last few months. With the latest crash in the asset, though, the price appears to finally be breaking out of the pattern towards the down direction.

This plunge in the coin has occurred as the rest of the cryptocurrency sector has also reverberated with a crash. Unlike many other assets, however, LTC never enjoyed any sharp rally to kickstart the year, so the plummet has been especially damaging for it.

“Post-recent dip, the outlook for Litecoin appears challenging,” notes Ali. “If the selling pressure continues, LTC might see a push down to $38, potentially confirming a bear flag formation.”

Generally, breakouts from any flag pattern are of about the same length as the preceding pole, which is why the analyst has selected this target. If Litecoin’s potential drawdown does play out in this fashion, then the asset would have seen a decrease of more than 41% from the current price levels.

LTC Price

Litecoin had been floating above the $73 mark just earlier, but following this 11% crash, the coin is now down to just $65.

Litecoin Price Chart

Litecoin’s MVRV Has Surged, Why This Is Bearish

On-chain data shows the Litecoin MVRV has been at relatively high levels recently, something that could be bearish for the cryptocurrency.

Both 30-Day & 365-Day Litecoin MVRV Ratios Are High Currently

According to data from the on-chain analytics firm Santiment, LTC traders are well above water at the moment. The “MVRV ratio” is an indicator that measures the ratio between the two main capitalization models for Litecoin: the market cap and the realized cap.

The market cap here is the usual cap that calculates the total value of the asset by simply taking the value of each coin in the circulating supply the same as the current spot price.

The realized cap, however, is a more special model as it assumes that the actual value of any coin in circulation is the price at which it was last transacted on the blockchain.

Since this model aims to estimate a sort of “true value” for Litecoin, its comparison with the market cap (that is, the spot price) in the MVRV can tell us whether the asset’s price is fair or not right now.

When the MVRV has a value greater than 1, it means the market cap is above the realized cap currently. During such times, the average investor is in a state of profit, so the incentive to sell for them increases. As such, the cryptocurrency could be considered overpriced in these conditions.

On the other hand,  the indicator having a value lower than this threshold implies the average holder is in a loss, and hence, the asset may be undervalued currently.

Now, here is a chart that shows the trend in the 30-day and 365-day moving averages (MAs) of the Litecoin MVRV ratio over the last few months:

Litecoin MVRV ratio

As displayed in the above graph, both the 30-day and 365-day MAs of Litecoin MVRV have risen above the baseline with the recent surge in the price beyond the $90 level. This may mean that the cryptocurrency could have become slightly overpriced.

Prior to this surge, when LTC had been visiting some lows, the 30-day version of the indicator had temporarily entered into the undervalued region. Coinciding with these values of the metric, the price formed its bottom and eventually built up towards the current surge.

Back in April, the MVRV MAs showed a similar behavior as right now, as they touched relatively high values when the asset had rallied above the $100 mark. The rally stopped before long in those overvalued conditions, and the asset took a plunge.

If a similar pattern as back then also follows with the current overpriced values of the indicator, then Litecoin may go on to observe a correction in the near future.

In the long term, however, the outlook of the asset could still remain bullish, as the much-awaited halving event, where the cryptocurrency’s block rewards will be permanently cut in half, will take place in August, which is just around the corner now.

LTC Price

At the time of writing, Litecoin is trading around $91, up 1% in the last week.

Litecoin Price Chart