Litecoin Bear Flag Could Cause 41% Crash To This Level, Analyst Explains

An analyst has explained that a bear flag is potentially forming for Litecoin, which, if confirmed, might cause a decline for LTC to this level.

Litecoin Could Be In Danger Of Deep Decline Due To This Bear Flag

In a post on X, analyst Ali has pointed out a possible bear flag taking form for Litecoin. A “bear flag” is a pattern in technical analysis that, as its name implies, looks like a flag on a pole.

The pattern takes shape when the asset observes a sharp downward move and follows it up with a period of consolidation. This consolidation happens toward a slight overall uptrend, meaning that its upper level is created by connecting higher highs, while the lower line joins together higher lows.

The downtrend prior to the consolidation makes up for the pole, while the channel looks like a flag. Inside the flag, the price is naturally likely to feel resistance at the upper level, while support is at the lower one.

The bear flag is popularly considered a continuation pattern, meaning that the downtrend would continue after the pattern forms. This continuation happens as the price finally ends its consolidation and crashes through the lower level of the flag.

Like the bear flag, there is also the “bull flag,” which forms in the opposite circumstances. In the case of this pattern, the price breaks out with a sharp upward move after the consolidation period toward the downside finishes.

Now, here is the chart shared by the analyst that sheds light on a possible bear flag forming in the 3-day price of Litecoin:

Litecoin Bear Flag

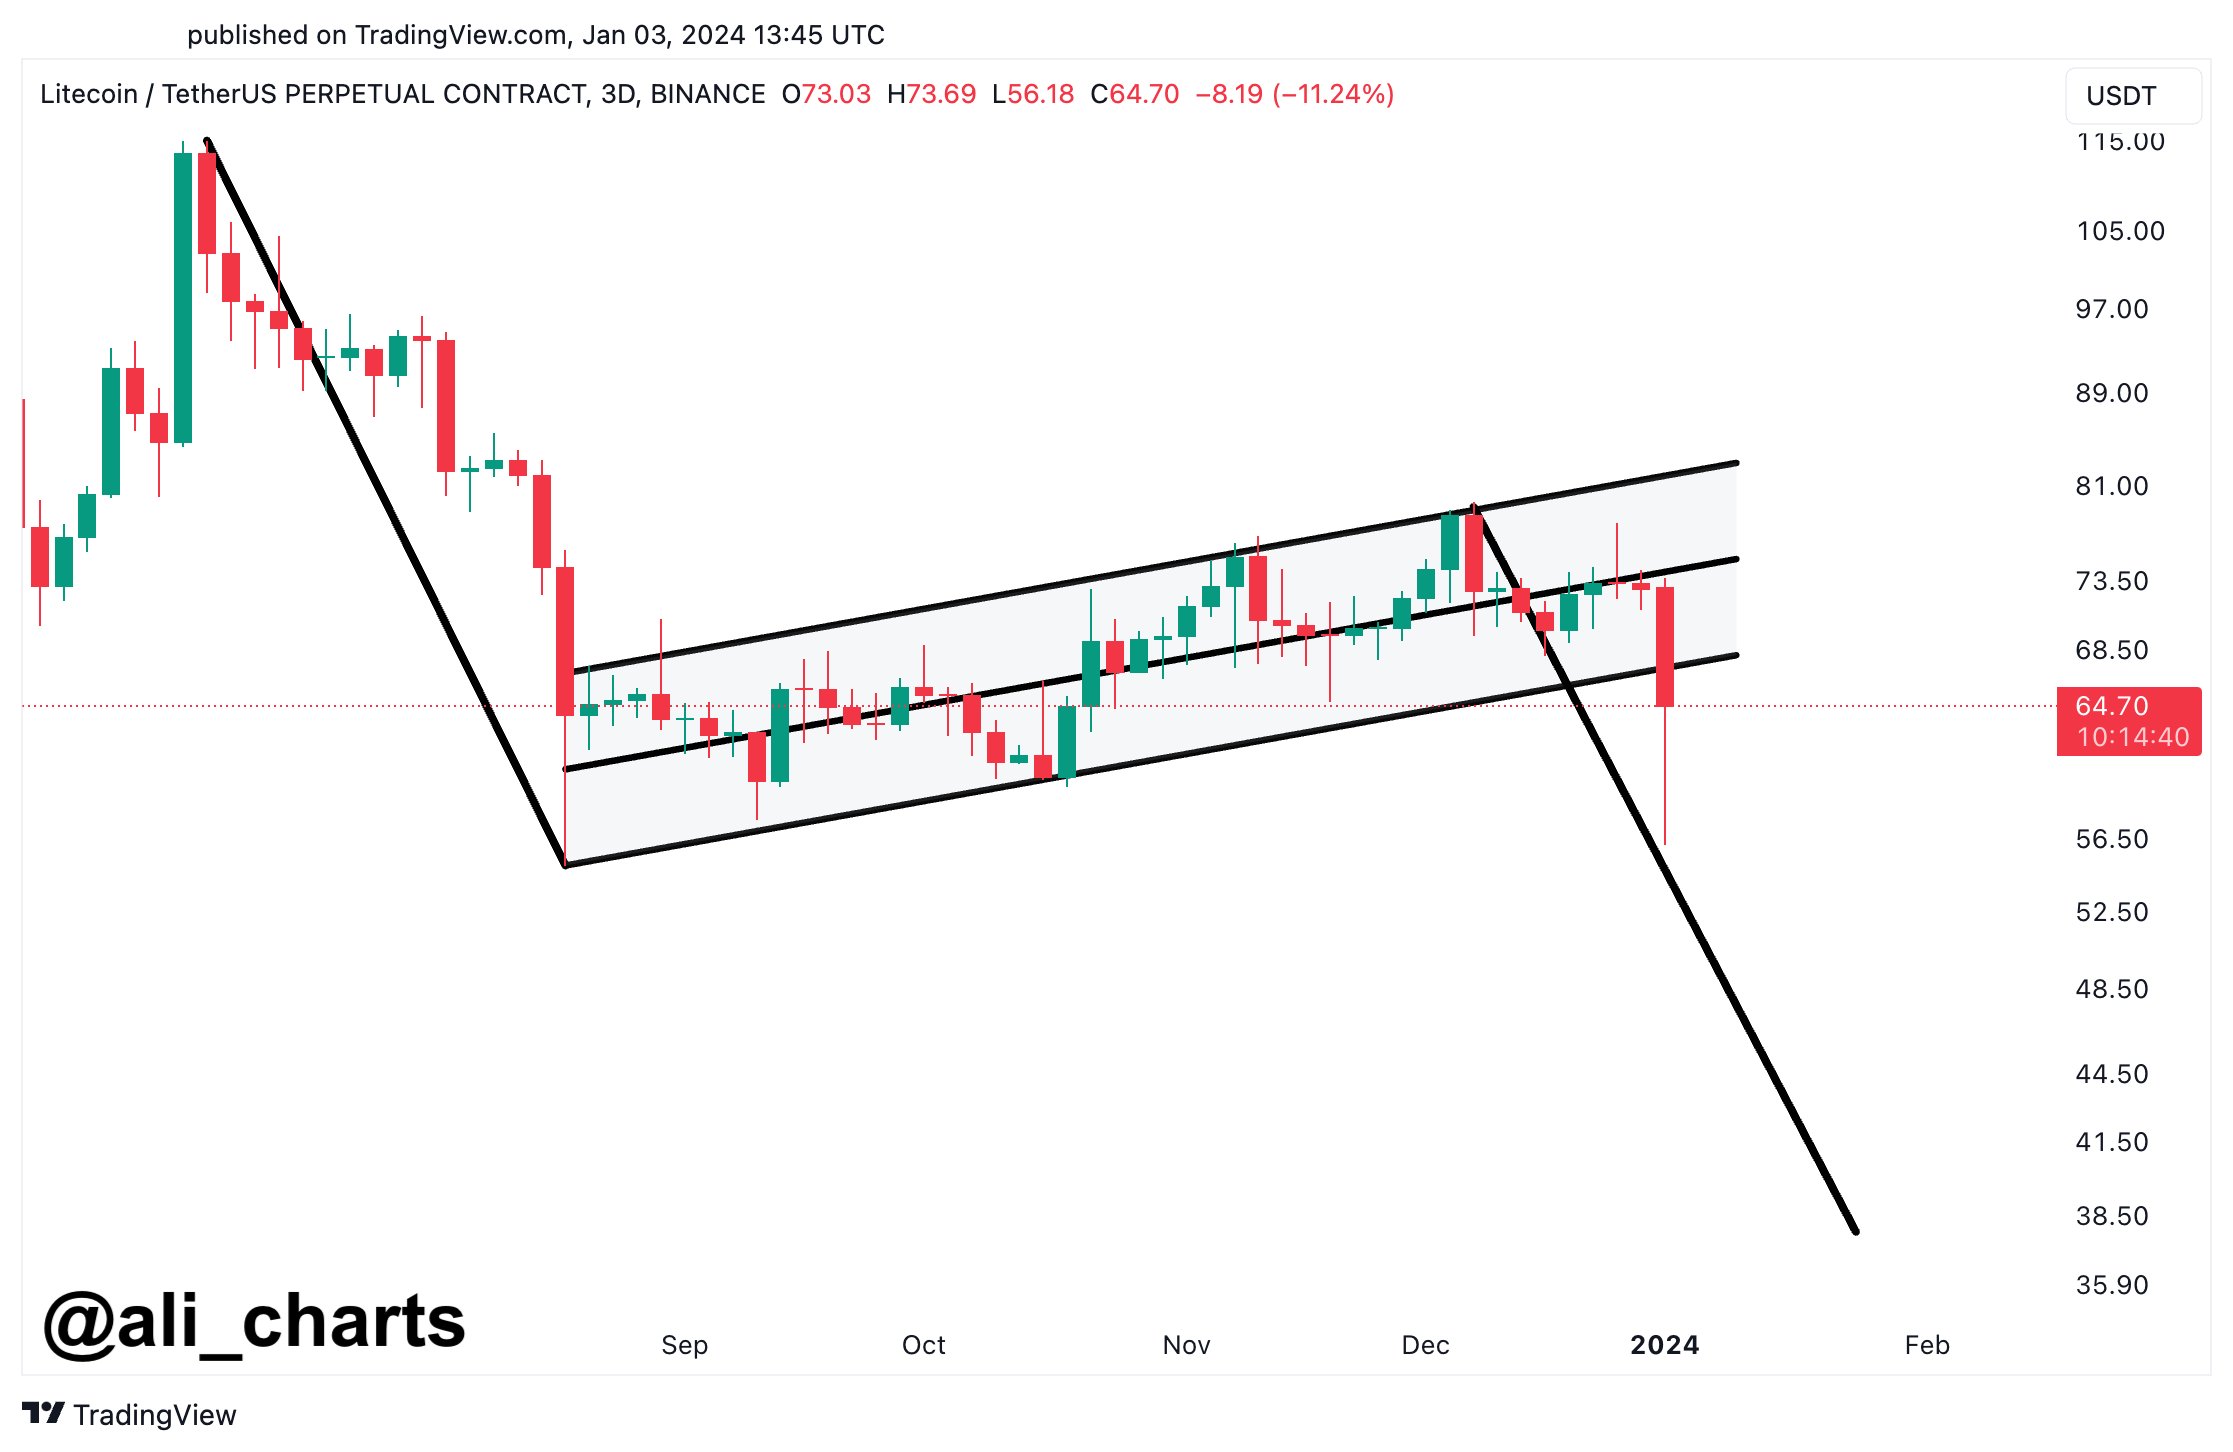
From the graph, it’s visible that Litecoin’s 3-day price has possibly been consolidating inside a bear flag during the last few months. With the latest crash in the asset, though, the price appears to finally be breaking out of the pattern towards the down direction.

This plunge in the coin has occurred as the rest of the cryptocurrency sector has also reverberated with a crash. Unlike many other assets, however, LTC never enjoyed any sharp rally to kickstart the year, so the plummet has been especially damaging for it.

“Post-recent dip, the outlook for Litecoin appears challenging,” notes Ali. “If the selling pressure continues, LTC might see a push down to $38, potentially confirming a bear flag formation.”

Generally, breakouts from any flag pattern are of about the same length as the preceding pole, which is why the analyst has selected this target. If Litecoin’s potential drawdown does play out in this fashion, then the asset would have seen a decrease of more than 41% from the current price levels.

LTC Price

Litecoin had been floating above the $73 mark just earlier, but following this 11% crash, the coin is now down to just $65.

Litecoin Price Chart

Crypto Analyst Puts Litecoin Price At $84, Here’s The Timeline

Since its third halving event was successfully completed in early August, the Litecoin price has fallen off the radar of crypto investors. This was mainly due to the price decline that LTC experienced after heavy profit-taking from investors who had invested leading up to the price surge triggered by the expectations around the halving. But it seems the tides are finally turning for the coin as one analyst predicts a more than 30% increase in price going forward.

Litecoin Price Shooting For The Stars

The current crypto market headwinds seem to be working in favor of the Litecoin price which one crypto analyst believes is gearing up for a run-up to $83. In the post, the pseudonymous analyst identified as P_S_trade points to the possibility of the crypto market continuing its growth trend. However, this would be null and void if the crypto market were to reverse back below $27,000.

For Litecoin, the analyst points out that the altcoin has usually been the first to start to see an upside in the crypto market. But this has not been the case, as previously mentioned since high levels of profit-taking have affected the LTC price.

Litecoin price chart from Tradingview.com

Even from the current level, the analyst’s chart points toward a possible retracement from here back down to $55. However, once this is completed, the bounce-off from there shows LTC reaching as high as $77 before succumbing to another correction.

This decline is also similar to the first instance where it falls to $55 in the fact that it signals another price surge. Following this second correction, the analyst puts the bottom somewhere around $67 before Litecoin continues its ascent once more.

The top of this second rally then lands just above $84 on the chart. Although there is no official timeline, the range of trades mentioned by the analyst is the medium term, which could see this run out for a couple of months.

Litecoin price chart from Tradingview.com (LTC prediction crypto analyst)

LTC Daily Transactions Continue To Decline

While the analyst foresees Litecoin price to surge, other metrics could be pointing in the opposite direction. For one, the daily transaction numbers for the altcoin have been steadily on the decline since the halving event in August.

According to data from BitInfoCharts, the number of daily LTC transactions has fallen from over 584,000 in May to just shy of 104,000 transactions by Tuesday, October 10. This points to a lack of interest from investors usually brought on by bear market headwinds.

Additionally, the daily transaction volumes, as shown by the token tracking website CoinMarketCap, show a 13.26% decline in the daily trading volume of Litecoin. These bearish metrics could thwart chances of reversal. However, they could also signal the bottom that triggers the start of another rally.