Litecoin ETF Rumors Fuel 10% Surge As Institutions Hint At Interest

Rumors regarding a potential spot Litecoin (LTC) Exchange-Traded Fund (ETF) have sparked a significant price surge, with the digital asset gaining 10% amid speculation of institutional interest. Fox Business journalist Eleanor Terrett, through a post on X (formerly Twitter), unveiled insights suggesting growing institutional intrigue towards a Litecoin ETF.

Terrett shared, “SCOOP: Hearing rumblings on the institutional level about possible interest in a Litecoin ETF. The logic is that because of LTC functional similarities to BTC, the SEC may be more inclined to approve it, possibly even more so than ETH.”

Why A Spot Litecoin ETF Could Be Possible

This statement comes at a pivotal time as the crypto market continues to navigate through regulatory uncertainties and growing interest from traditional financial institutions. Adding to the buzz, Terrett highlighted recent actions by the Coinbase Derivatives to launch futures contracts for Dogecoin, Litecoin, and Bitcoin Cash, all set to begin on April 1st, 2024.

These futures contracts, as detailed, are part of Coinbase’s strategic move to diversify its offerings, leveraging the self-certification approach under CFTC Regulation 40.2(a). This approach permits entities to launch new products without the explicit approval of the CFTC, provided they comply with the Commodity Exchange Act and accompanying regulations.

Moreover, the recent classification of Ethereum (ETH) and Litecoin (LTC) as commodities by the Commodity Futures Trading Commission (CFTC) in its lawsuit against KuCoin has added another layer of legitimacy to the discourse surrounding Litecoin’s regulatory standing. The CFTC’s action emphasizes its view of certain cryptocurrencies as commodities.

Amidst these regulatory clarifications and developments, discussions about the potential approval of a spot Litecoin ETF have intensified. Luke Martin, a renowned crypto analyst, echoed the sentiment, suggesting that the approval of an Ethereum ETF could pave the way for other “old altcoins,” like Litecoin, which may have a stronger case for not being classified as securities.

He stated, “When the ETH ETF launches and passes, the question then becomes especially with the SEC’s track record versus tokens […] there’s other dinosaur old altcoins which you can make almost a stronger case [that] they’re not a security, one that sounds ridiculous but if you think deeply about it, it’s true – Dogecoin you could probably prove easier is not a security than ETH. Why wouldn’t they launch Litecoin, Dogecoin?”

Adding to the momentum, Alan Austin, Managing Director at the Litecoin Foundation, expressed enthusiasm about the prospects of a spot Litecoin ETF, stating, “I’ll say it again, love or hate ETFs, the first company to launch a Litecoin ETF is going to crush it!”

LTC Price Is Lagging Behind

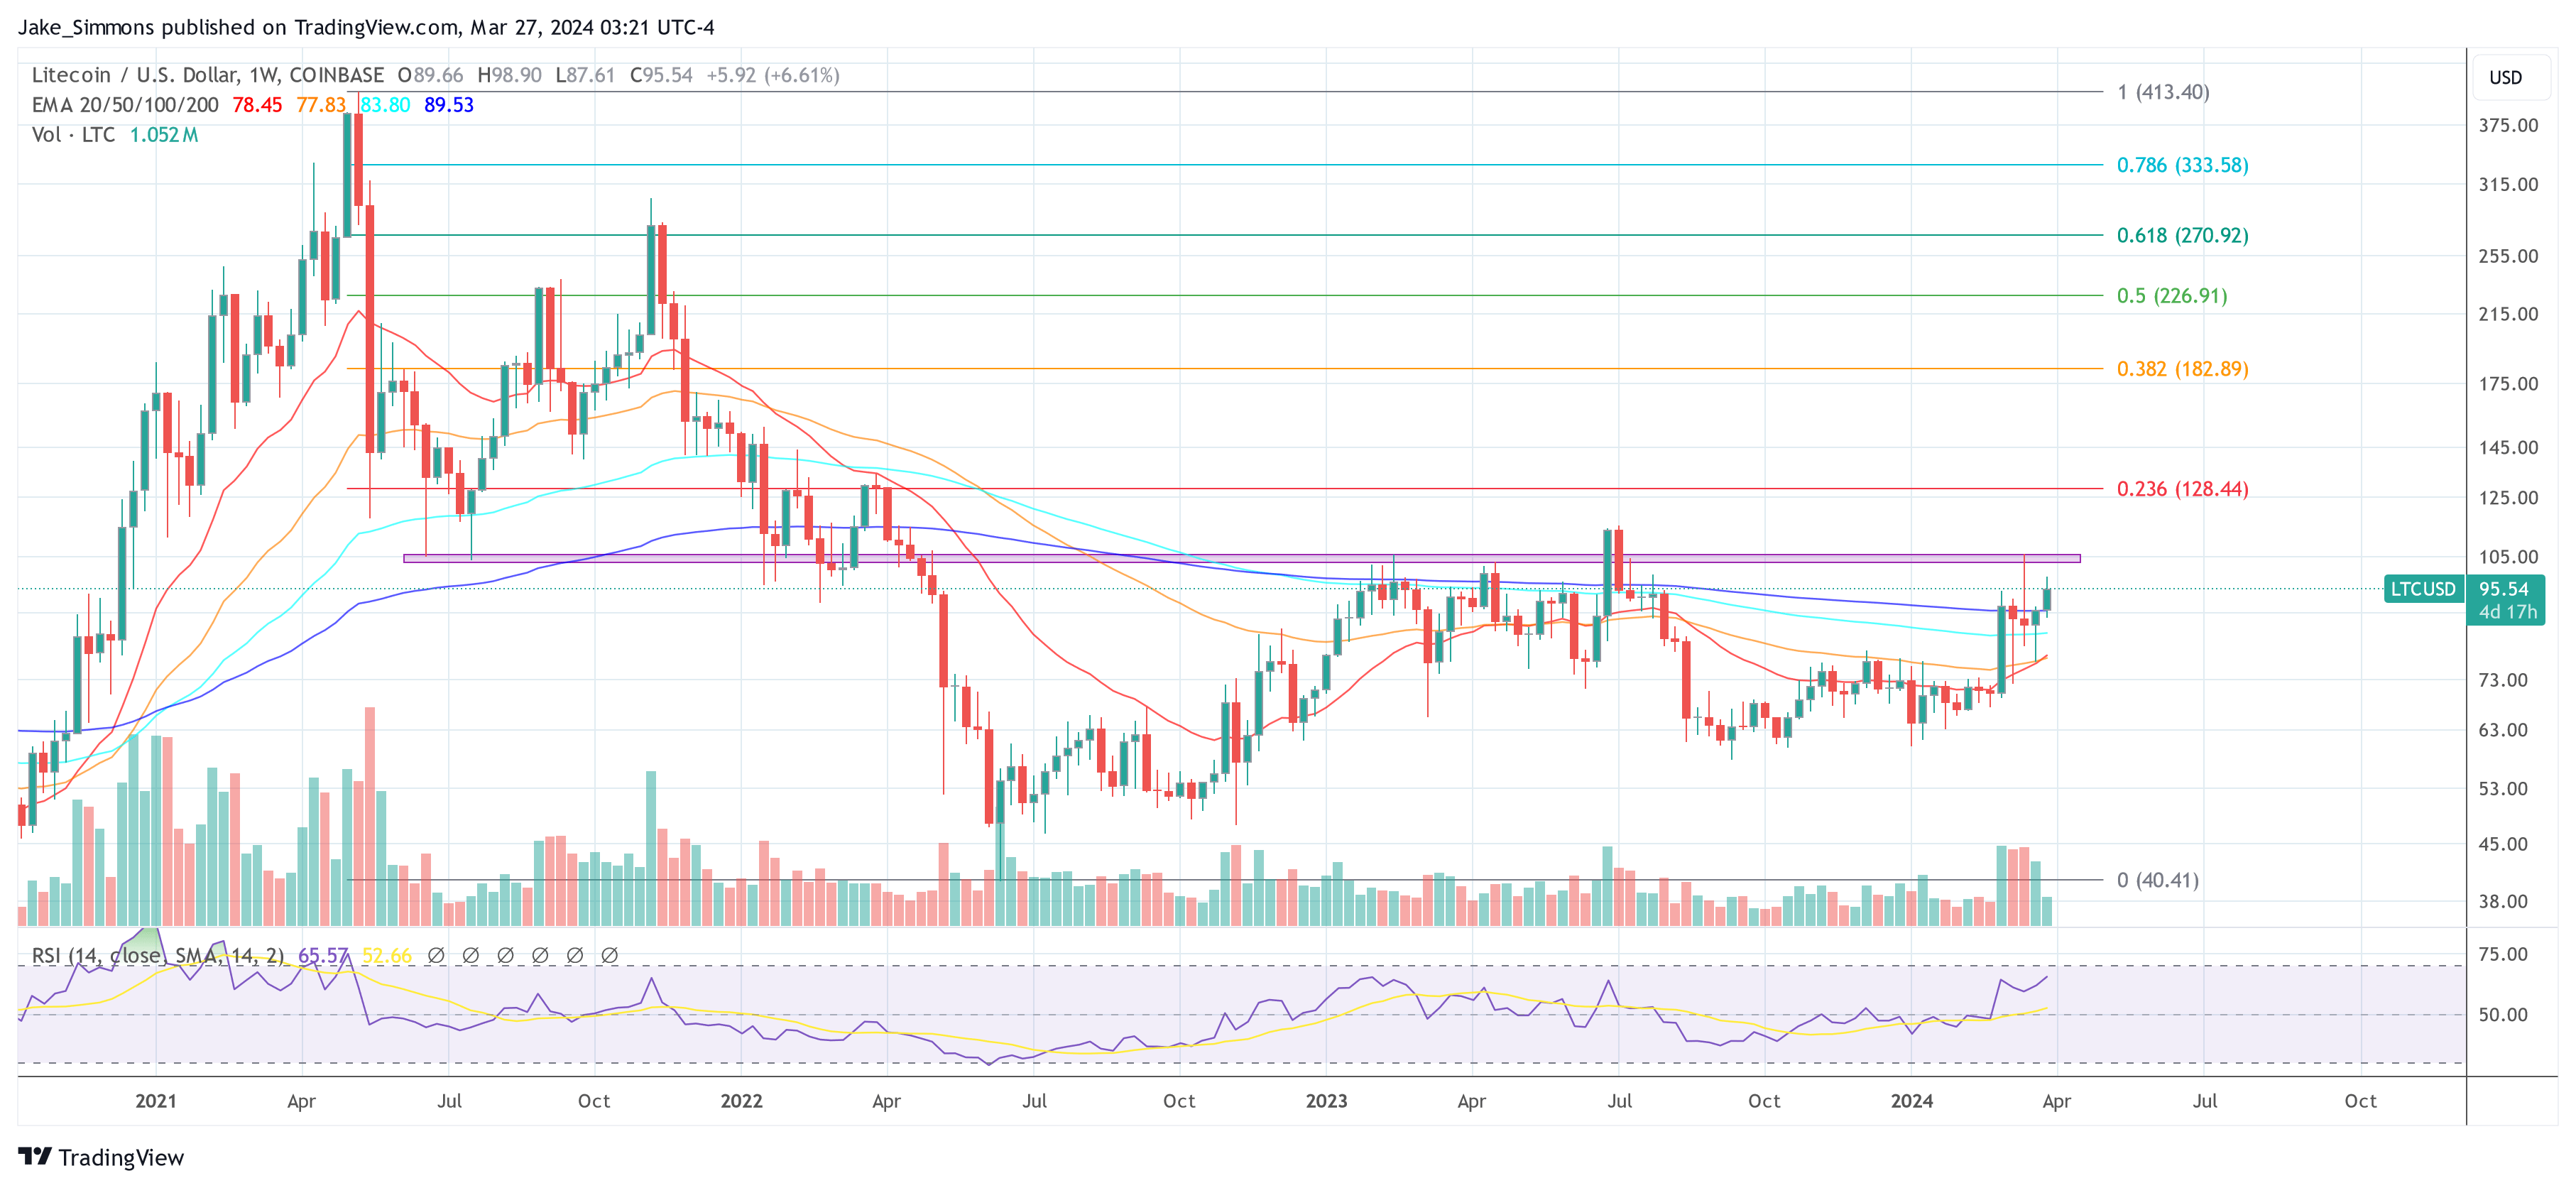
Despite the current buzz, Litecoin’s price analysis indicates that it is still down by 77% from it’s all-time high in May 2021, signaling a bearish trend in comparison to other cryptocurrencies that have already surpassed their 2021 peaks. Nevertheless, a recent break above the 200-week EMA has ignited a glimmer of bullish momentum.

Overcoming the red resistance zone between $102 and $106 could be critical for Litecoin to reach new heights, with the $128 mark (0.236 Fibonacci retracement level) as a potential near-term target.
Litecoin price

Litecoin About To Explode And Outperform Bitcoin? Analyst Is Super Bullish

Litecoin, a cryptocurrency often referred to as the “silver to Bitcoin’s gold,” is gaining traction among analysts who predict its potential to outperform Bitcoin shortly. 

Tony “the Bull,” a certified chartist and the Head of Research at NewsBTC, took to X on January 12, laying out a bullish outlook for the 18th most valuable cryptocurrency. Citing its monthly candlestick formations, the analyst said what’s panning out are signs of an imminent breakout that could propel the coin higher in the coming weeks.

Litecoin About To Rip Higher?

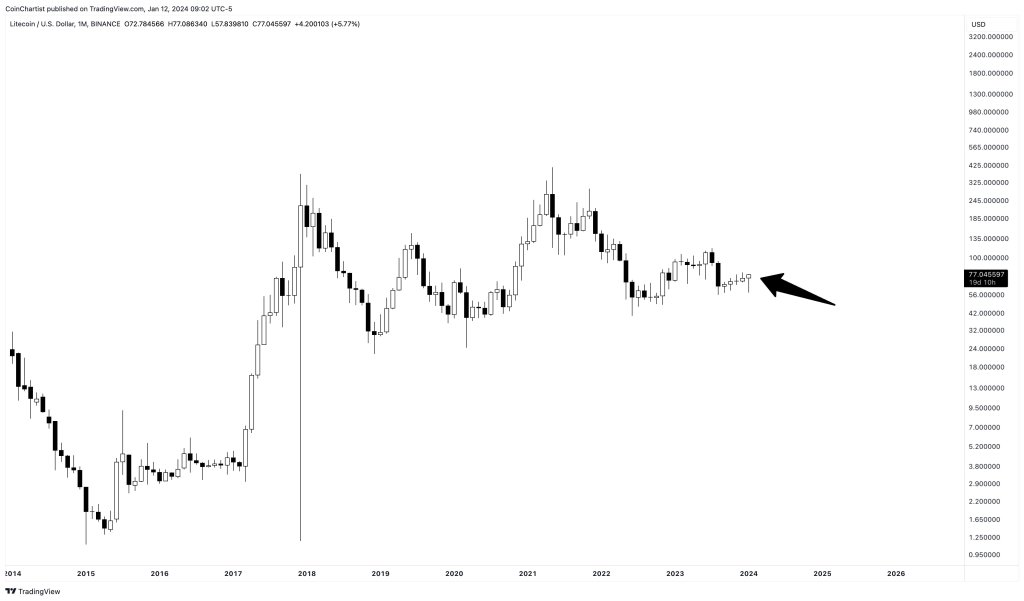
Specifically, Tony “The Bull” said what’s printing out in the monthly chart is “insanely bullish” for Litecoin. This outlook is warming for Litecoin Bulls, considering its drab performance in 2023 when prices consolidated before tanking in the second half. 

LTC bullish in monthly chart | Source: Tony "The Bull" via X

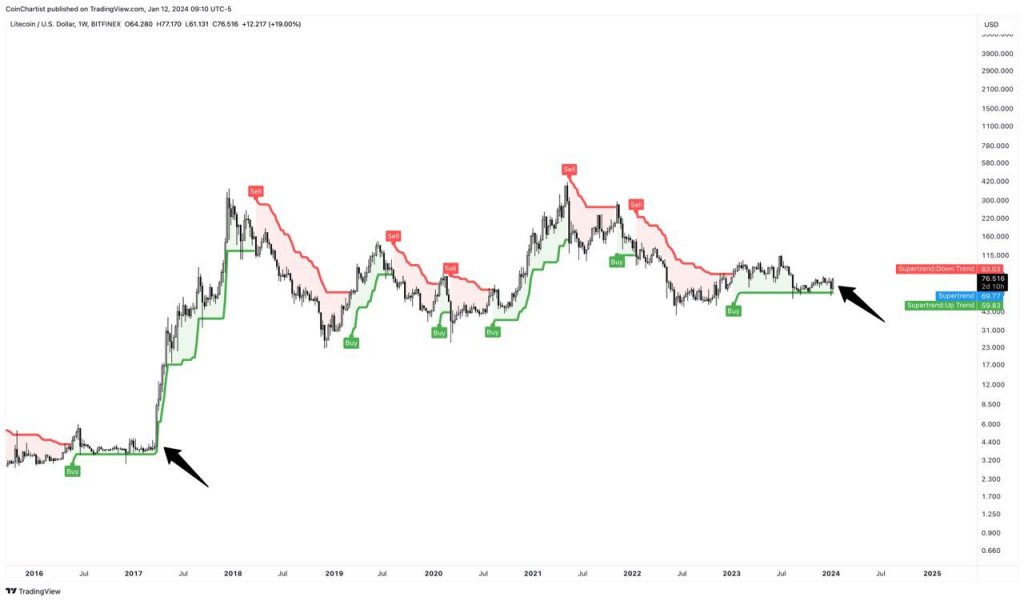
The researcher also shared another chart, predicting that the crypto community is “close to witnessing something impressive.” The analyst’s enthusiasm echoes earlier assessment of Litecoin’s “SuperTrend” indicator, which seems to suggest significant price gains for Litecoin in the coming sessions.

LTC supertrend | Source: Tony "The Bull" via X

Litecoin remains within a bearish formation, consolidating, as evident in the monthly chart. Of note, prices are still trending inside the bear bar of August 2023. Despite general optimism, Litecoin bulls have yet to reverse those losses and remain within a tight, flat-lining range, as evident in the monthly chart. 

Still, Litecoin might set a fresh trend depending on the breakout direction. Any upswing above $115 might ignite demand that may lift the coin towards May 2021 highs of around $400.

Spot Bitcoin ETF Didn’t Push BTC Above $50,000

Tony “The Bull”‘s bullish sentiment on Litecoin comes as Bitcoin, the world’s largest cryptocurrency, is trending lower, looking at the performance in the daily chart. Despite the US Securities and Exchange Commission (SEC) approving 11 spot Bitcoin ETFs, Bitcoin prices have failed to break above the $50,000 resistance level. 

For now, the crypto community remains bullish. Bitcoin supporters earlier claimed the approval of spot Bitcoin ETFs would trigger billions into the coin and broadly the sphere. The derivative product provides a legal channel for institutions to invest in Bitcoin. Still, the SEC chair Gary Gensler maintained that Bitcoin is a speculative asset despite the agency’s approval.

LTCBTC chart trending upward on the daily chart | Source: LTCBTC on Binance, TradingView

In contrast to Bitcoin’s lackluster performance, Litecoin has shown resilience, maintaining a firm stance amidst market volatility. This development suggests that Litecoin may be poised to outperform Bitcoin in the coming months. The LTCBTC chart shows Litecoin is up 21% versus Bitcoin, rallying from January lows. 

Liquidation Quandary: Litecoin Wallets Draining Fast – What’s Next For LTC Prices?

Litecoin (LTC) suffered a major fall after a week of consistent growth, posing possible difficulties going forward. According to recent data, a significant proportion of wallets have sold their Bitcoin holdings.

As of this writing, LTC is trading at $74.60, down 1.1% from its peak price over the previous day. This decline has also had an effect on LTC’s market capitalization.

With Litecoin’s market value falling by 55% compared to Bitcoin in just five months, the price chart for LTC presents a bleak image. This sharp decline in value is indicative of investors’ diminishing trust as they choose to sell off more and more of their holdings.

Litecoin Downturn: Small Investors Flee, Raising Long-Term Viability Concerns

Santiment claims that 199,000 wallets that contained Litecoin around 10 days ago are no longer in possession of the cryptocurrency. This pattern could explain why, in comparison to other prominent cryptocurrencies previously discussed, the coin has performed comparatively poorly over the last week and year.

Interestingly, small-scale holders account for the majority of the wallets that collapse, which contrasts with the tenacity exhibited by Sharks and Whales in the cryptocurrency space, according to Santiment.

It seems that small investors—who are frequently the most susceptible to market swings—are the main group selling their holdings, presumably because they are worried about the investments’ long-term sustainability and liquidity.

The significant departure of almost 199,000 wallets that previously contained LTC is a noteworthy phenomena that should not be disregarded. The significant decline in selling activity reflects a more widespread feeling of apprehension, uncertainty, and skepticism that has negatively impacted the asset.

Up to 2.13% of all Litecoin wallets have sold off their LTC since late November, according to the most recent data. On the Litecoin network, at least 9.11 million addresses now hold zero coins.

As some of the top cryptocurrencies have experienced incredible price increases—gaining over 100% in the year thus far—Litecoin has remained relatively stable, showing a growth of less than 4% year to date.

For about two weeks, the price of LTC has been consistently fluctuating between $70 and $75. In the second half of the month, there was a narrow trading range between $68 and $72.

LTC’s Resilience: Navigating Liquidation In Leveraged Trading

In order to forcefully end a trader’s leveraged position once a trader loses all or a portion of their initial margin, the exchange uses a process known as liquidation. It occurs when a trader doesn’t have enough money to maintain an open position in a leveraged position, or can’t meet the margin requirements for the position.

LTC maintained a high trading volume even as its price went sideways. Additionally, its MVRV ratio was higher, which is often an indication of good health.

However, even with a decline, its Relative Strength Index (RSI) stayed over the neutral threshold of 50. By doing this, the coin may be able to satisfy investors and continue its bull run.

Meanwhile, the biggest crypto payment processor in the world, BitPay, now accepts LTC as its preferred coin. Beyond Bitcoin [BTC] and Ethereum [ETH], it has demonstrated its supremacy in practical applications, accounting for 34% of BitPay’s payment count in cryptocurrency.

(This site’s content should not be construed as investment advice. Investing involves risk. When you invest, your capital is subject to risk).

Featured image from Shutterstock

Trading Guru John Bollinger Warns Of Buying Litecoin, Here’s Why

In his latest analysis, legendary trader John Bollinger has expressed concerns over Litecoin’s performance, particularly in comparison to Bitcoin. Bollinger, known for developing the popular technical analysis tool Bollinger Bands, highlighted a worrying pattern in the Litecoin market.

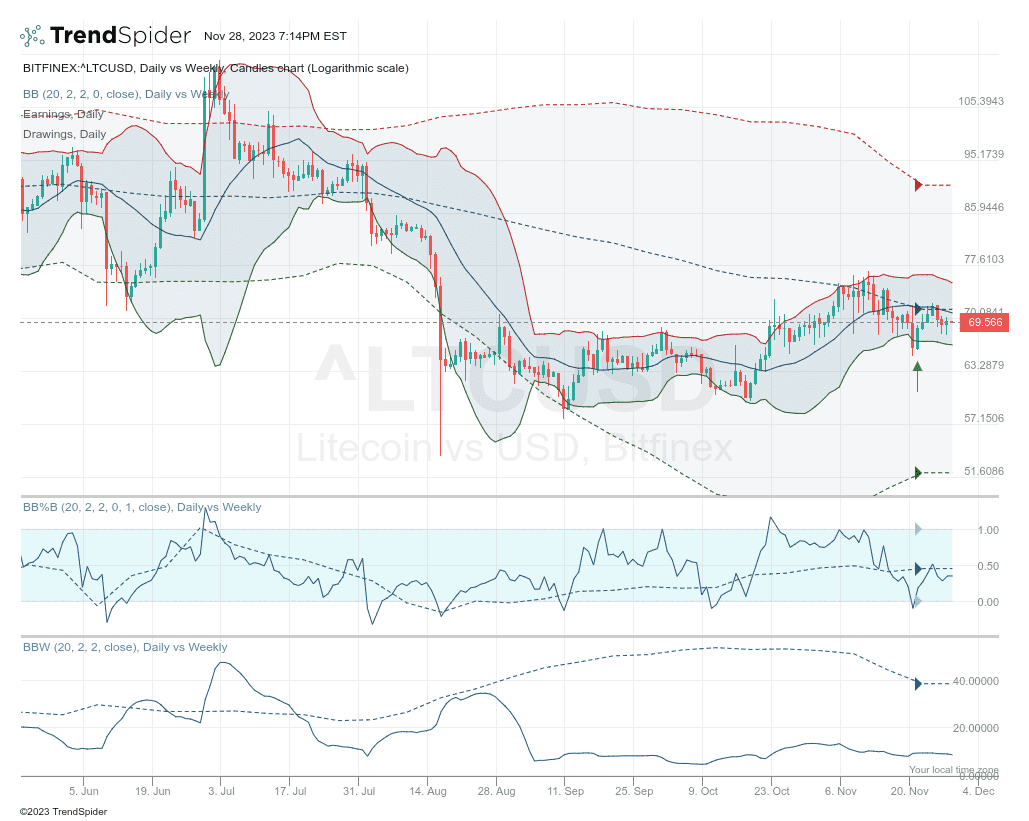
He remarked, “I was asked for an analysis of LTCBTC. The thing that concerns me the most is its underperformance vs Bitcoin. From a price perspective the controlling LTCUSD feature is the 2 bar reversal at the lower Bollinger Band which is typically considered a bearish signal by traders.”

Litecoin price analysis by John Bollinger

Bollinger’s Bearish Litecoin Prediction Explained

The chart of the LTC/USD pair provided by Bollinger on November 28, 2023, shows Litecoin’s price action in relation to its Bollinger Bands on both a daily and weekly scale. The price is currently hovering around $69.566, which is significantly lower than the upper Bollinger Band, suggesting a lack of bullish momentum.

The Bands form by plotting a range of standard deviations above and below a simple moving average, commonly enveloping the price action. In this chart, the daily vs. weekly candles chart shows that the LTC/USD price is struggling beneath the midpoint of these bands, which is a bearish indication. The price currently near $69.566 is substantially below the upper band level of around $90, which represents a potential resistance level.

The Bollinger Bands (BB) on the chart are set with a 20-period moving average with a 2 standard deviation range. Bollinger’s analysis points to a ‘2 bar reversal’ pattern at the lower band. This pattern emerges when a bar reaches a high above the preceding bar but then closes below the close of that same previous bar, hinting at a possible reversal from the uptrend. Such a pattern took place near the lower band, indicating that any effort to drive the price higher meets with resistance, and the prevailing selling pressure is taking hold.

The Bollinger %B indicator is also crucial here as it compares the price of Litecoin to the range defined by the Bollinger Bands. A %B value below 0.5 indicates that Litecoin’s price sits nearer to the lower band than to the upper band, potentially signaling weakness. The chart shows the indicator failing to cross the 0.5 level after a plunge toward 0, signifying that the price frequently touches or falls below the lower band.

LTC Price Under Pressure

The Bollinger Band Width (BBW) serves as another indicator, measuring volatility by assessing the Bollinger Bands’ width. A narrowing of the Bands, as seen in the latter part of the chart, suggests a decrease in volatility and often precedes a significant price movement. In this context, the BBW’s narrowing on the Litecoin chart might indicate that the market is tensing, possibly gearing up for an impending breakout or breakdown.

When Bollinger mentions Litecoin’s underperformance relative to Bitcoin, it’s important to note that Bitcoin often leads the crypto market trend. If Litecoin is not keeping up with Bitcoin’s movements, it could suggest a lack of confidence or interest from traders in altcoins (as the current rise in Bitcoin dominance shows) and Litecoin specifically.

In summary, Bollinger’s technical analysis indicates that Litecoin is in a precarious position. The price action at the lower Bollinger Band, the bearish ‘2 bar reversal’ pattern, the sub-0.5 Bollinger %B values, and the narrowing BBW all suggest that Litecoin may continue to see downward pressure in the near term.

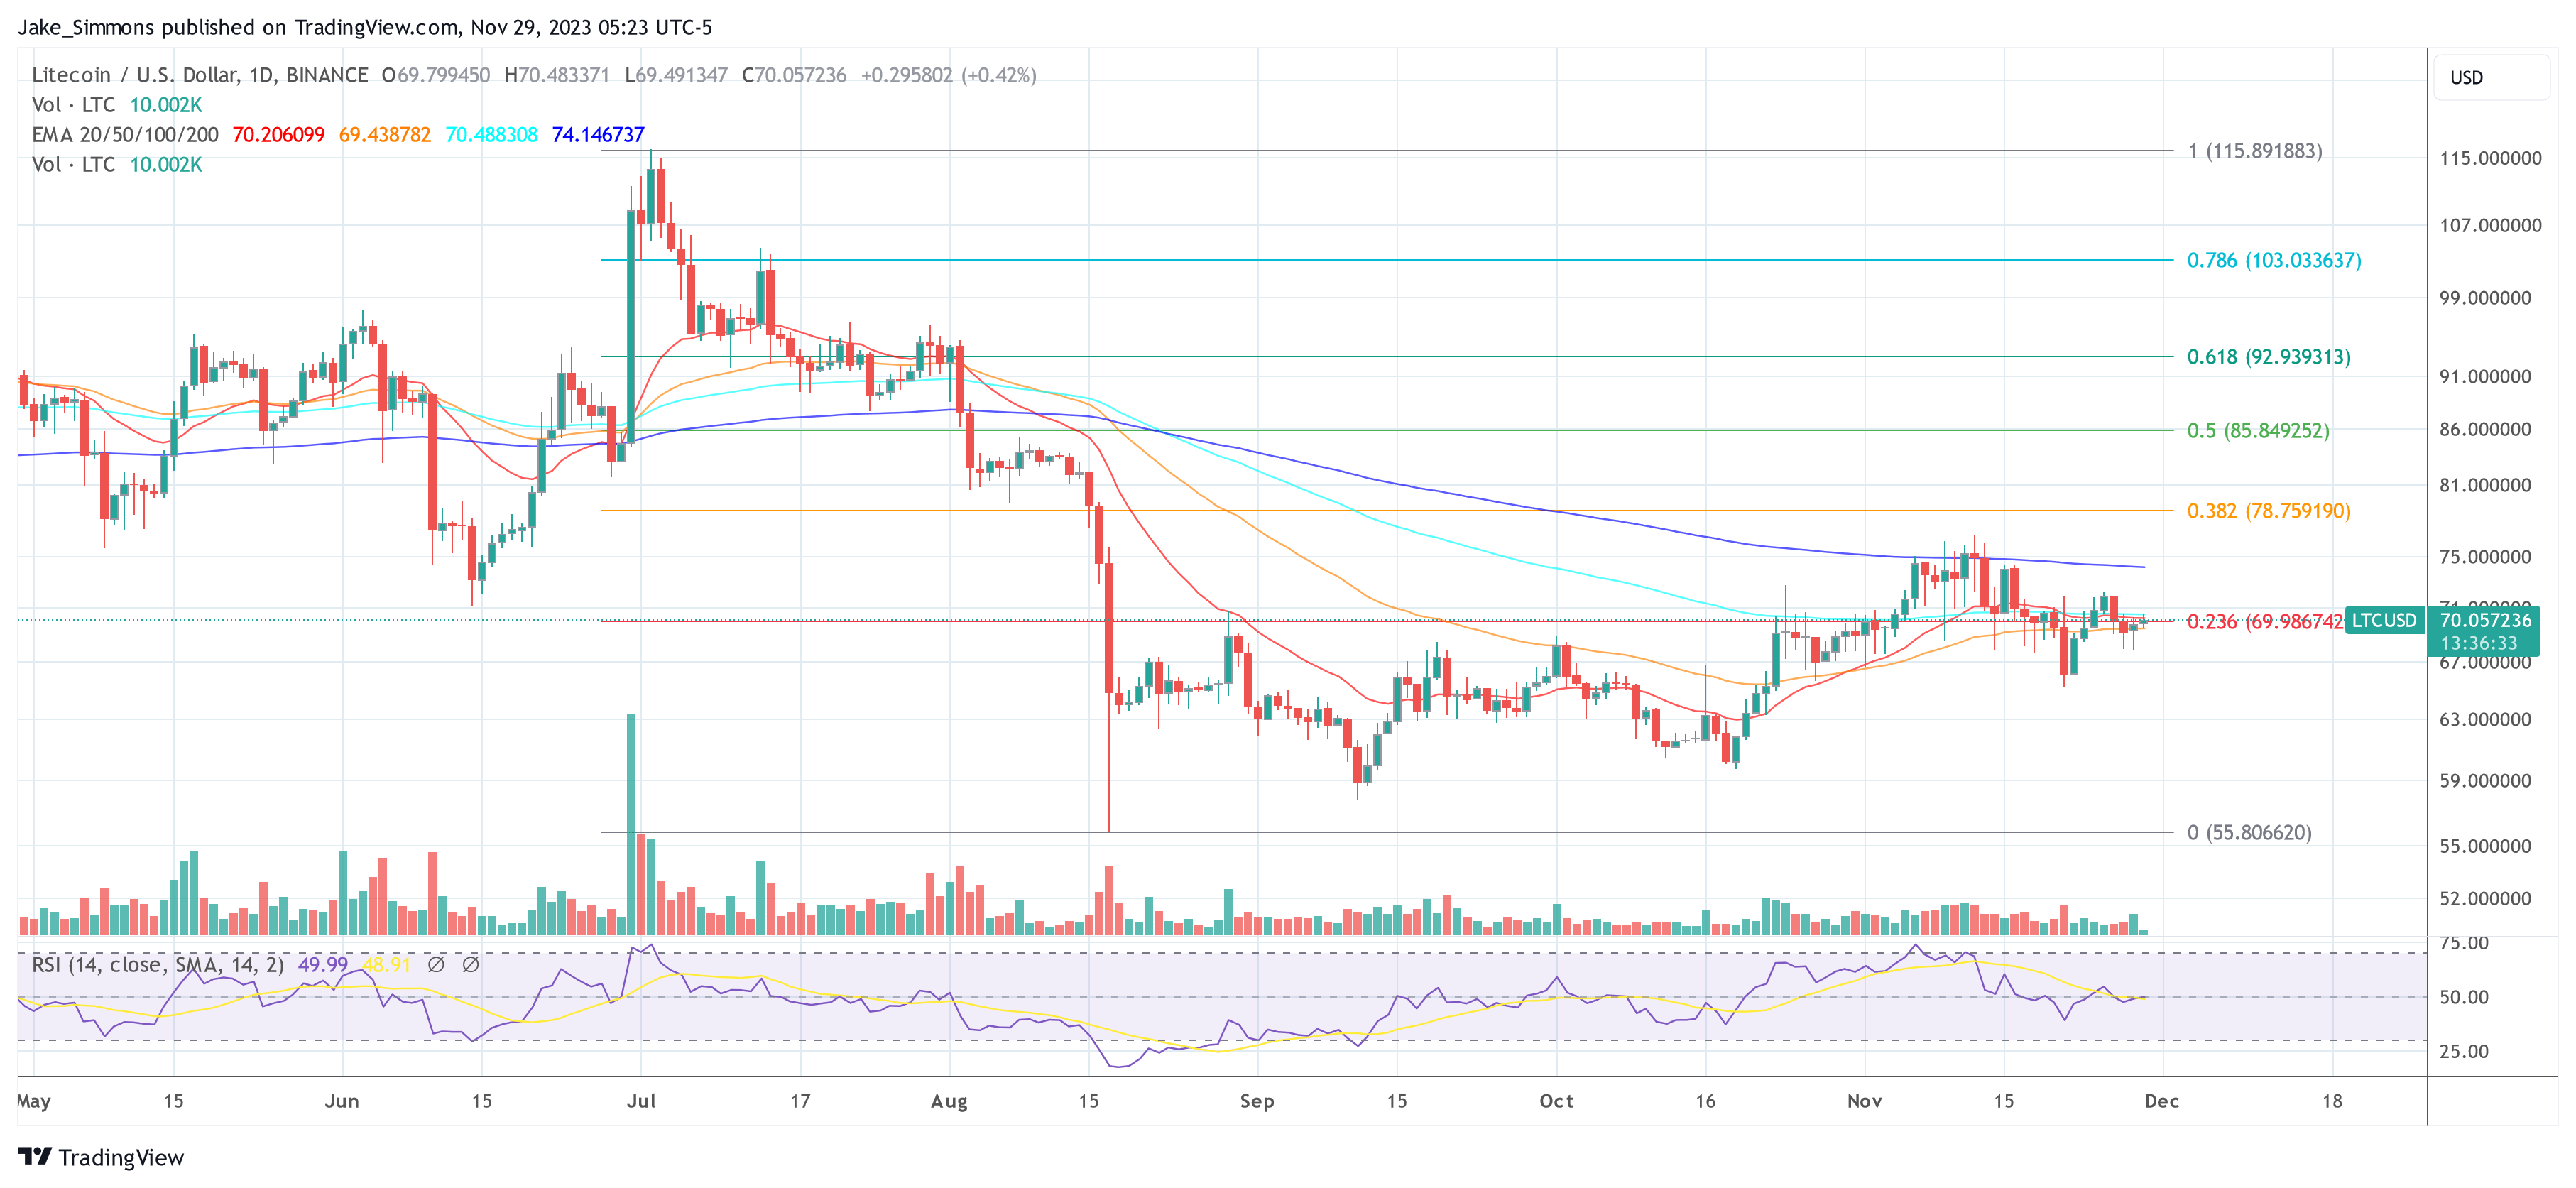
At press time, Litecoin traded at $70.05. The 1-day chart of LTC/USD shows that the altcoin fell below the key support of the 0.236 Fibonacci retracement level at $69.98 two days ago. A retest is currently taking place, a daily close above this is of utmost importance for the Litecoin price.

Litecoin price

Crypto Analyst Puts Litecoin Price At $84, Here’s The Timeline

Since its third halving event was successfully completed in early August, the Litecoin price has fallen off the radar of crypto investors. This was mainly due to the price decline that LTC experienced after heavy profit-taking from investors who had invested leading up to the price surge triggered by the expectations around the halving. But it seems the tides are finally turning for the coin as one analyst predicts a more than 30% increase in price going forward.

Litecoin Price Shooting For The Stars

The current crypto market headwinds seem to be working in favor of the Litecoin price which one crypto analyst believes is gearing up for a run-up to $83. In the post, the pseudonymous analyst identified as P_S_trade points to the possibility of the crypto market continuing its growth trend. However, this would be null and void if the crypto market were to reverse back below $27,000.

For Litecoin, the analyst points out that the altcoin has usually been the first to start to see an upside in the crypto market. But this has not been the case, as previously mentioned since high levels of profit-taking have affected the LTC price.

Litecoin price chart from Tradingview.com

Even from the current level, the analyst’s chart points toward a possible retracement from here back down to $55. However, once this is completed, the bounce-off from there shows LTC reaching as high as $77 before succumbing to another correction.

This decline is also similar to the first instance where it falls to $55 in the fact that it signals another price surge. Following this second correction, the analyst puts the bottom somewhere around $67 before Litecoin continues its ascent once more.

The top of this second rally then lands just above $84 on the chart. Although there is no official timeline, the range of trades mentioned by the analyst is the medium term, which could see this run out for a couple of months.

Litecoin price chart from Tradingview.com (LTC prediction crypto analyst)

LTC Daily Transactions Continue To Decline

While the analyst foresees Litecoin price to surge, other metrics could be pointing in the opposite direction. For one, the daily transaction numbers for the altcoin have been steadily on the decline since the halving event in August.

According to data from BitInfoCharts, the number of daily LTC transactions has fallen from over 584,000 in May to just shy of 104,000 transactions by Tuesday, October 10. This points to a lack of interest from investors usually brought on by bear market headwinds.

Additionally, the daily transaction volumes, as shown by the token tracking website CoinMarketCap, show a 13.26% decline in the daily trading volume of Litecoin. These bearish metrics could thwart chances of reversal. However, they could also signal the bottom that triggers the start of another rally.

Litecoin Stuck In A Rut: Will Bullish Momentum Or Bearish Pressure Prevail?

Litecoin (LTC) has spent the past week trading within a tight price range, with its value hovering steadily around the mid-range point of $64. The price action for LTC in September has remained primarily bearish, with sellers maintaining control over the market. 

While LTC has a history of volatile price swings, recent times have seen it mirroring the sideways movement of the overall market, largely influenced by Bitcoin’s fluctuations, which rose from $25,000 to $27,000 before dropping to $26,000.

As of the latest data from CoinGecko, Litecoin is currently trading at $64.63, with a 24-hour gain of 0.7%. However, over the past seven days, LTC has experienced a decline of 2.9%, reflecting the prevailing bearish sentiment in the market, according to a recent price report.

Chasing Litecoin Bulls and Avoiding The Bears

For those looking for a bullish revival in Litecoin’s price,  a price report notes that the key level to watch is the 23.6% Fibonacci retracement level, which stands at $69. Breaking above this level could open the door for further gains, with potential targets lying at $78 and $80.

On the other hand, if the flat trading volume persists, bears may exert further pressure, potentially leading to a drop in LTC’s price to the $60 mark.

Market speculators have not been particularly enthusiastic about Litecoin’s recent sideways movement. The Open Interest (OI) for LTC has continued to decline, with data from Coinalyze indicating a $9 million drop within the past 48 hours. This suggests that traders and investors are becoming increasingly cautious as they monitor the developments in the Litecoin market.

Litecoin’s Investment Appeal in Q3/Q4

Despite the recent lackluster performance, some analysts believe that Litecoin remains an attractive investment opportunity in the third and fourth quarters of this year. Litecoin’s established reputation, solid ecosystem, and upcoming halving events are factors that contribute to its appeal.

Halving events have historically had a positive impact on Litecoin’s price, reducing the rate at which new LTC coins are mined and potentially increasing scarcity.

Market participants are closely watching the 23.6% Fibonacci retracement level at $69 for signs of a bullish revival, while a continuation of flat trading volume could see LTC drop to $60.

Despite recent market concerns, Litecoin’s strong fundamentals and upcoming halving events make it an investment opportunity worth considering as we move into the later part of the year.

(This site’s content should not be construed as investment advice. Investing involves risk. When you invest, your capital is subject to risk).

Featured image from Invest Right

Litecoin Eliminates Pre-Halving Gains As Volume Drops, Is A Fall To $50 Coming?

In the months leading up to the Litecoin halving in August, the price of the blockchain’s native LTC token was continuously on the rise. This renewed interest in investors who rushed back into the token and eventually pushed its price above $100. That is until the actual halving event rolled around, turning it into a “buy the rumor, sell the news” scenario. Since then, it has been a downward spiral for the token and the pain may not be over.

Litecoin Volume Slumps Post-Halving

Litecoin volume since the halving was completed has been less than expected. While investors expected rising demand for the LTC token with the diminished supply rate, the opposite has been the case. Instead, the daily trading volume of the cryptocurrency continued to slump.

In the last day, the Litceoin daily trading volume fell another 23%. This brought its daily volume to $255 million, a significantly low figure compared to the $500 million daily volumes that the cryptocurrency was recording leading up to the halving.

Litecoin volume

Just like the trading volume, the price of LTC has also plunged significantly. From its pre-halving peak of $112, the altcoin has fallen over 50% to its current level just above $60. This means that the asset has lost all of its gains accumulated between June and July 2023, just one month after the halving was completed.

So rather than being a bullish event as initially expected, the halving has proven to be more bearish than most. It also did not help that it took place during the bear market and LTC has fallen rapidly alongside larger assets such as Bitcoin and Ethereum.

Litecoin price chart from Tradingview.com (Volume)

Will LTC Fall Continue To $50?

At the current rate, the forecast does not look too good for the LTC price. Litecoin has understandably seen a 3% increase in the past day as Bitcoin recovered above $26,000. But this does not look sustainable by its current metric.

The first indicator of this is that falling daily trading volume means that interest in the asset is waning. As investors move to other assets they believe provide better prospects, this will affect the LTC price and could trigger further downside from here. Add to this that the coin’s price is below its 50-day and 100-day moving averages and it spells a recipe for disaster.

If LTC bulls are unable to hold support above $60 and it falls once again as it did on September 11, then $50 becomes a very possible landing point. Such a decline would put it back at November 2022 levels and signal a prolonged bear trend for the digital asset.

At the time of writing, LTC price is still sitting above $62 but the tug-of-war for control between bulls and bears continues to rage on.

Litecoin Sharks Buy More Than 200,000 LTC Ahead Of Wednesday’s Halving

Over the last few months, Litecoin has emerged as one of the top trending cryptocurrencies due to its halving event happening in August. As this event drew closer, crypto investors began filling up their LTC bags in preparation for what is expected to be a very bullish event. And now, with less than two days left to go before the halving, sharks have made remarkable moves to position themselves for possible upside.

Litecoin Sharks Load Up Their Bags

A report shared by the on-chain tracking platform Santiment revealed how Litecoin investors are currently looking at the digital asset. The chart showed an impressive accumulation trend from dolphin and shark wallets, which have increased their holdings significantly in the last month.

Santiment’s report shows that these wallets holding between $9,500 and $950,000 worth of LTC have added over 200,00 coins to their balances since June 14. On this date, the total holdings of these wallets were sitting just slightly below 18 million. However, in the next two weeks, their balances grew above 18.1 million coins.

Litecoin sharks and Dolphins

There has also been a semi-constant uptrend among these investors. Although there were dips here and there in their holdings, they remained committed to the accumulation over this last two weeks, each time buying more coins than they sold.

What Is Driving The LTC Accumulation?

The current accumulation from the dolphin and shark wallets are not isolated and just like the whale acquisitions, they are being driven by the same thing. The Litecoin halving is expected to take place on Wednesday and since this event has been historically bullish, it has triggered active participation from investors looking to capitalize on it.

If the LTC halving plays out as expected, then it is possible that the price of the altcoin will climb above $100 once more. This would put the majority of the LTC accumulated by the dolphin and shark addresses over the last two weeks back in profit territory.

However, the days leading up to the event haven’t been as bullish as expected. Even though LTC’s price is still trading above $90, it has seen only single-digit daily gains over this time. Naturally, with less than two days to go, there should have already been some rapid increases for the cryptocurrency but there has been none.

This current trend suggests that the halving may already be priced into LTC’s price, especially given the fact that the crypto bear market has continued.

At the time of writing, LTC is changing hands at a price of $93.80, down 0.98%, according to data from Coinmarketcap.

Litecoin Price Prediction: This Resistance Could Trigger New Rally

Litecoin price remained well bid above the $60 support zone against the US Dollar. LTC is rising and might attempt a fresh rally above the $70 level.

  • Litecoin started a fresh decline below $80 support against the US Dollar.
  • The price is now trading below $70 and the 100 simple moving average (4-hours).
  • There is a key bearish trend line forming with resistance near $70.50 on the 4-hours chart of the LTC/USD pair (data feed from Kraken).
  • The price could start a decent increase if there is a clear move above the $72 resistance.

Litecoin Price Eyes Upside Break

Earlier this month, litecoin price saw a steady decline from well above the $80 level against the US Dollar. LTC price declined below the $75 support zone to move into a bearish zone, similar to bitcoin and ethereum.

The price gained pace below the $70 support and the 100 simple moving average (4-hours). A low was formed near $61.02 and the price is now attempting a recovery wave. There was a decent upside correction above the $63 and $65 levels.

There was a move above the 23.6% Fib retracement level of the key decline from the $79.80 swing high to $61.02 low. The price is now trading near the $70 resistance and 100 simple moving average (4-hours).

On the upside, an immediate resistance is near the $70.00 level. There is also a key bearish trend line forming with resistance near $70.50 on the 4-hours chart of the LTC/USD pair. The trend line is near the 50% Fib retracement level of the key decline from the $79.80 swing high to $61.02 low.

Litecoin Price

Source: LTCUSD on TradingView.com

If there is a clear break above the $70.50 resistance, the price could start a strong increase. In the stated case, the price is likely to continue higher towards the $72 and $75 levels. Any more gains might send ltc price towards the $80 resistance zone.

Fresh Decline in LTC?

If Litecoin price fails to clear the $70.00 resistance level, there could be a fresh decline. An initial support on the downside is near the $65.50 level.

The first major support is forming near the $64.00 level. Any further losses may perhaps send the price towards the $60.00 support in the coming sessions.

Technical indicators:

4-hours MACD – The MACD is slowly gaining pace in the bullish zone.

4-hours RSI (Relative Strength Index) – The RSI for LTC/USD is above the 50 level.

Major Support Levels – $65.50 followed by $60.00.

Major Resistance Levels – $70.00 and $75.00.

Litecoin Price Bleeds, Why The Bulls Could Stay On Sidelines

Litecoin price started a fresh decline from the $80 resistance against the US Dollar. LTC is struggling and remains at a risk of more losses towards the $55 support.

  • Litecoin started a fresh decline from the $85 resistance against the US Dollar.
  • The price is now trading below $70 and the 100 simple moving average (4-hours).
  • There was a break below a key contracting triangle with support near $75.00 on the 4-hours chart of the LTC/USD pair (data feed from Kraken).
  • The price could continue to move down towards $55 in the near term.

Litecoin Price Turns Red

This past month, litecoin price saw a strong increase above the $70 level against the US Dollar. LTC price was able to clear the $80 resistance level, outperforming both bitcoin and ethereum.

However, the bears remained active near the $85 zone. There was a topping pattern formed near the $85 level before the price started a fresh decline. There was a clear move below the $80 and $78 support levels. Besides, there was a break below a key contracting triangle with support near $75.00 on the 4-hours chart of the LTC/USD pair.

Litecoin price is now trading below $70 and the 100 simple moving average (4-hours). A low is formed near $61.67 and the price is now consolidating losses.

On the upside, an immediate resistance is near the $66.00 level. It is near 23.6% Fib retracement level of the recent decline from the $79.80 swing high to $61.67 low. The first major resistance is near the $70.00 level.

Litecoin Price

Source: LTCUSD on TradingView.com

The 50% Fib retracement level of the recent decline from the $79.80 swing high to $61.67 low is also near $70. If there is a clear break above the $70 resistance, the price could start a strong increase. In the stated case, the price is likely to continue higher towards the $75 and $78 levels. Any more gains might send ltc price towards the $80 resistance zone.

More Losses in LTC?

If Litecoin price fails to clear the $70.00 resistance level, there could be more losses. An initial support on the downside is near the $61.60 level.

The first major support is forming near the $60.00 level. Any further losses may perhaps send the price towards the $55.00 support in the coming sessions.

Technical indicators:

4-hours MACD – The MACD is slowly gaining pace in the bearish zone.

4-hours RSI (Relative Strength Index) – The RSI for LTC/USD is below the 50 level.

Major Support Levels – $60.00 followed by $55.00.

Major Resistance Levels – $70.00 and $75.00.

Litecoin Price Prediction: Why LTC’s Rally is Far From Over

Litecoin price started a strong increase above the $70 resistance against the US Dollar. LTC is currently consolidating and might aim more upsides above $85.

  • Litecoin started a strong increase above the $65 and $70 levels against the US Dollar.
  • The price is now trading above $70 and the 100 simple moving average (4-hours).
  • There is a major bullish trend line forming with support near $74.00 on the 4-hours chart of the LTC/USD pair (data feed from Kraken).
  • The price must clear the $83.20 and $84.65 to start another increase in the near term.

Litecoin Price Continues To Outperform

In the past few days, litecoin price started a steady increase above the $60 level against the US Dollar. LTC price was able to clear the $65 and $70 resistance levels to move into a bullish zone.

The bulls even pumped the price above the $80 level, outperforming both bitcoin and ethereum. However, the price faced sellers near the $85 zone. A high was formed near $85.08 and the price is now consolidating gains.

Litecoin price is now trading above $70 and the 100 simple moving average (4-hours). There was a minor decline below the 23.6% Fib retracement level of the upward move from the $70.57 swing low to $85.08 high. Besides, there is a major bullish trend line forming with support near $74.00 on the 4-hours chart of the LTC/USD pair.

Litecoin Price

Source: LTCUSD on TradingView.com

On the upside, an immediate resistance is near the $82.00 level. The first major resistance is near the $83.20 level. The main resistance is near $85. If there is a clear break above the $85 resistance, the price could start a strong increase. In the stated case, the price is likely to continue higher towards the $92 and $95 levels. Any more gains might send ltc price towards the $100 resistance zone.

Dips Supported in LTC?

If Litecoin price fails to clear the $82.00 resistance level, there could be a downside correction. An initial support on the downside is near the $80 level.

The first major support is forming near the $77.80 level. The stated level is near the 50% Fib retracement level of the upward move from the $70.57 swing low to $85.08 high. Any further losses may perhaps send the price towards the $74 support in the coming sessions.

Technical indicators:

4-hours MACD – The MACD is slowly losing pace in the bullish zone.

4-hours RSI (Relative Strength Index) – The RSI for LTC/USD is currently above the 50 level.

Major Support Levels – $78.00 followed by $74.00.

Major Resistance Levels – $82.50 and $85.00.

Litecoin Price Prediction: Why LTC Could Hit $100 and Outperform Bitcoin

Litecoin price started a steady increase above the $65 resistance against the US Dollar. LTC is currently rising and might rally further towards the $100 level.

  • Litecoin started a strong increase above the $55 and $65 levels against the US Dollar.
  • The price is now trading above $65 and the 100 simple moving average (4-hours).
  • There is a key bearish trend line forming with resistance near $77.50 on the 4-hours chart of the LTC/USD pair (data feed from Kraken).
  • The price must clear the $77.50 and $84 to rise towards the $100 resistance zone.

Litecoin Price Outperforms Bitcoin

In the past few days, litecoin price saw a decent increase above the $50 level against the US Dollar. LTC price rallied over 20% and outperformed both bitcoin and ethereum.

There was a move above the $65 and $75 resistance levels. The price even surpassed $80 and settled above the 100 simple moving average (4-hours). It traded as high as $83.35 before there was a downside correction. There was a move below the $80 and $75 support levels.

The price declined below the 23.6% Fib retracement level of the upward move from the $59.17 swing low to $83.35 high. However, litecoin price is now trading above $65 and the 100 simple moving average (4-hours).

It stayed above the 50% Fib retracement level of the upward move from the $59.17 swing low to $83.35 high. On the upside, an immediate resistance is near the $77.50 level.

Litecoin Price Outperforms Bitcoin

Source: LTCUSD on TradingView.com

There is also a key bearish trend line forming with resistance near $77.50 on the 4-hours chart of the LTC/USD pair. If there is a clear break above the $77.50 resistance, the price could start a strong increase. In the stated case, the price is likely to continue higher towards the $85 and $90 levels. Any more gains might send ltc price towards the $100 resistance zone.

Dips Limited in LTC?

If Litecoin price fails to clear the $77.50 resistance level, there could be another pullback. An initial support on the downside is near the $71.20 level.

The first major support is forming near the $68 level. Any further losses may perhaps send the price towards the $55 support in the coming sessions.

Technical indicators:

4-hours MACD – The MACD is slowly moving into the bullish zone.

4-hours RSI (Relative Strength Index) – The RSI for LTC/USD is currently above the 50 level.

Major Support Levels – $71.20 followed by $68.00.

Major Resistance Levels – $77.50 and $85.00.

How Litecoin (LTC) Is Able To Muster A 5-Day Straight Rally

Litecoin (LTC) is performing at its peak levels as seen in the past five days.

  • LTC exhibits the formation of a rising parallel channel pattern
  • LTC price is down by 0.69% as of this writing
  • LTC price on a 5-day straight rally registered a growth of 21.4%

LTC is having a bull run as validated by the formation of a rising parallel channel pattern touching the key resistance seen at $66.

The key resistance zone has been a major hurdle for LTC hindering any bullish growth for the past couple of months, hinting at a price reversal.

Nonetheless, even if the LTC price can break through the resistance zone, there are still more junctures in the road.

Litecoin Manages To Hold Above $53.5 Support

The crypto market has been taking the low blows with major corrections going on that further toppled down BTC and other major altcoins in 2022.

Even though Litecoin did suffer through a retracement, the support of buyers has allowed the altcoin to hold above the key support zone of $53.5.

According to CoinMarketCap, LTC price has plunged by 0.69% or trading at $82.59 as of press time.

The support level has been retested multiple times which allowed the bulls to come back stronger on September 7.

Moreover, the bullish reversal also helped with sustaining the buying momentum and the rising parallel pattern which hoisted the recovery of LTC in the past three months.

LTC price has been on a surge for the fifth straight day, tapping on the growth of as much as 21.4%.

The bullish streak has touched the monthly key resistance of $66 and showing some difficulty to climb further. Any signs of bearish reversal at this point will trigger a price decline back to hoist the trendline.

LTC To Experience Corrections

On the other hand, if the coin buyers can successfully break the barriers of the overhead key resistance zone, the LTC price could potentially spike 6.8% higher before it can touch the trendline.

Further, the LTC price may revert from the resistance level and start a bearish trend.

Additionally, the rising channel patterns formed are presumed to trigger further downtrends. With that in mind, the LTC price has a strong tendency to breach the key support line, strengthening the bearish momentum.

Hence, until LTC prices fail to breach the key resistance level, Litecoin may encounter corrections.

The 20- and 50-day EMAs are spotted swerving sideways showing that the bearish momentum could be faltering.

More so, the bearish crossover seen sliced between these slopes strengthens the $66 resistance. Litecoin’s RSI is also seen to spike higher and look bullish showing growth in investor and buyer confidence.

LTC total market cap at $4.4 billion on the daily chart | Source: TradingView.com

Featured image from Blogtienao, Chart from TradingView.com

Litecoin Surges 30% In One Hour Following News Of Walmart Partnership

Litecoin has recorded massive price movement in the past hour. The coin started to rally after Reuters had reported that retail giant Walmart would begin accepting the cryptocurrency as payment for purchases. The news broke on Monday with a press release that stated Walmart had partnered with Litecoin to allows customers to make payments with LTC.

The news triggered a price surge that saw the price of Litecoin grow 30% in a single hour, breaking a three-month high of $237. Before the news broke, Litecoin has been trading in the mid-$170s at $175. News of the Walmart partnership over $60 in one hour to put it this current high. With a customer base that Walmart possesses, it is no surprise that the news triggered such a reaction from the market.

Related Reading | U.K. Post Office Now Allows Users Purchase Bitcoin Through Its App

Fake Press Release?

The press release from Reuters has been shared widely as the news broke throughout the industry. Major crypto media outlets had reported on the news, with the official Twitter account of Litecoin also tweeting a link to the move. The press release from Reuters had featured a quote, seemingly from Walmart’s CEO Doug McMillon, which read; “Starting October 1st, all eCommerce stores will have implemented a ‘Pay with Litecoin Option’.

Related Reading | Led By Litecoin, Mid-Cap Altcoins Bleed With Bitcoin

In a move that has so far triggered a cascade of deleted tweets and stories, the news of the Litecoin-Walmart partnership has now been debunked. Apparently, the legit-looking press release from Reuters had been a fake press release. The sources which reported on this news have since backtracked. Litecoin’s official Twitter handle deleted the link to the news report.

Community members have now moved forward to call this a cheap pump and dump scheme. The coin has dumped with confirmations of the Walmart partnership being fake, with the price returning back to previous levels before the 30% price surge.

Litecoin Price Movements

Litecoin has so far lost all of its gained value from the pump caused by the Walmart news. As of the time of writing, the coin had lost over $60 in a downwards correction, landing back in the mid-$170s that it was trading at before the news broke. The charts show a sharp upward and downward movement in the space of one hour.

LTC price pumps and dumps with Walmart news | Source: LTCUSD on TradingView.com

For a brief moment, the digital asset looked ready to test the $140 resistance point which it had not been able to break since peaking in May. The hour following the 30% price surge has seen Litecoin struggling to hold on to some of the momenta it had gained with the move. Currently trading at around $180, the digital asset is none the worse for wear following the debacle.

Regardless of whether the news is fake or not, the asset has benefitted from the increased interest in it. Social media platforms like Twitter and Reddit are abuzz with the [fake] news of the integration with Walmart. The current publicity will no doubt have some positive effect on the price of the asset.

Featured image from CMC Markets, chart from TradingView.com