Much has changed since Litecoin launched in 2011 with a maximum supply of 84 million LTC as a silver to Bitcoin’s gold. The crypto recently completed its third halving in August, finally reducing the number of LTC miners receive as a reward for mining a block from 12.5 LTC to 6.25 LTC.
Over the past 12 years, much of this supply has been distributed to miners as block rewards for verifying Litecoin transactions. At the time of writing, there are 73.76 million LTC in circulation, with data showing this supply concentrated among large holders.
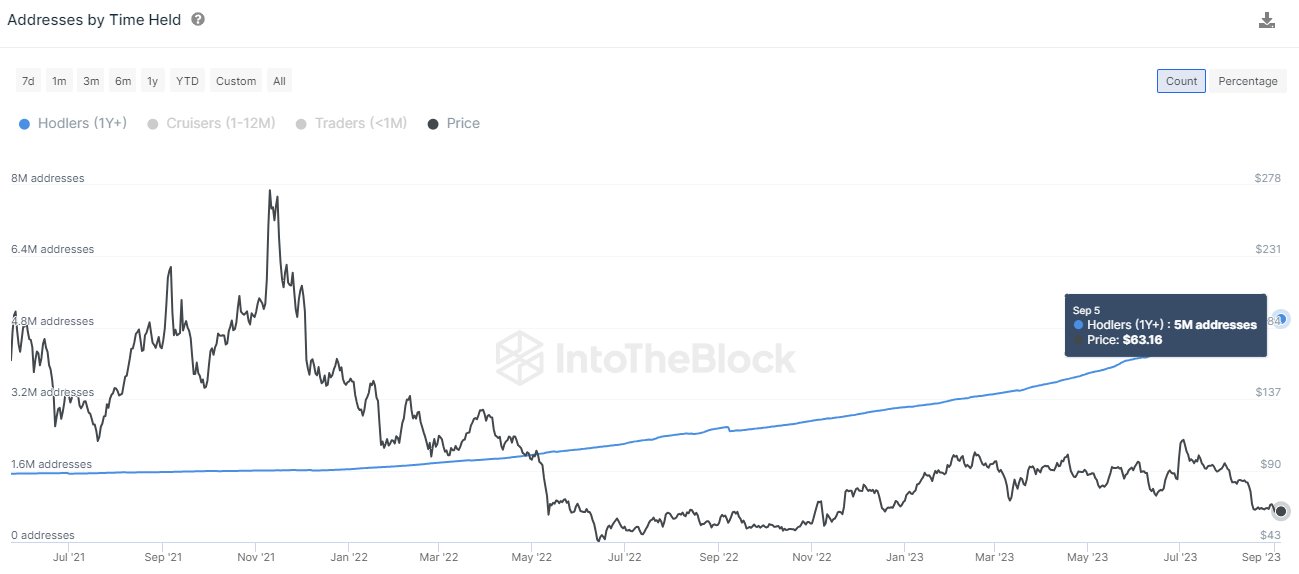
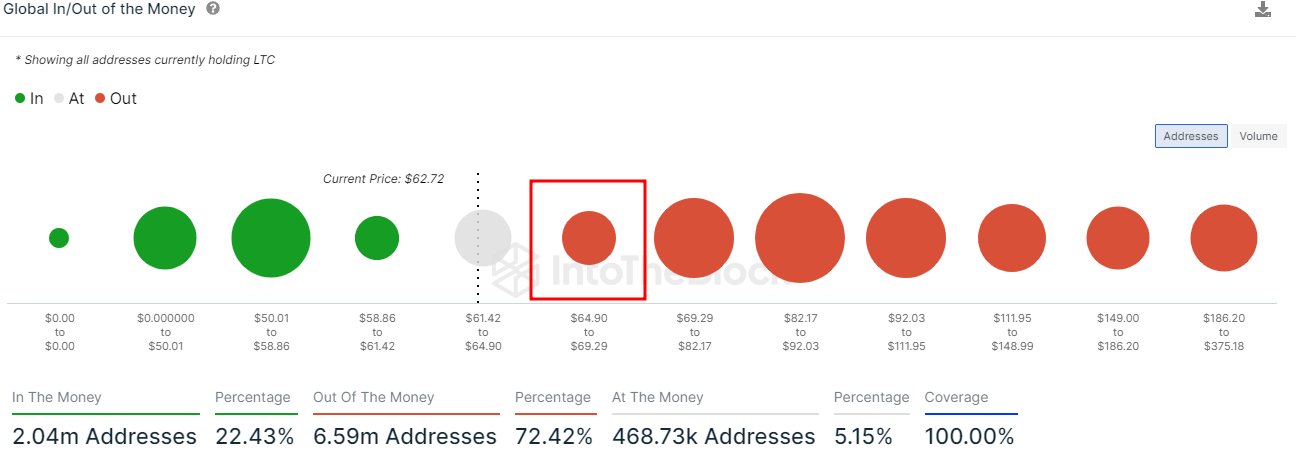
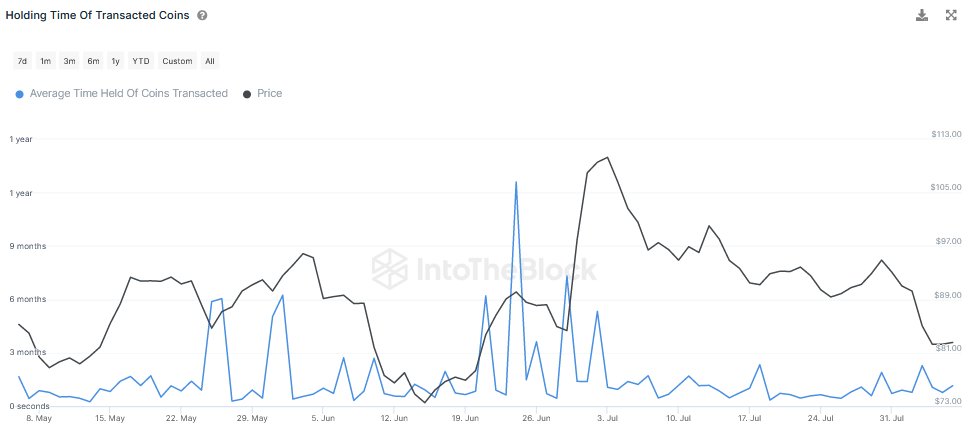
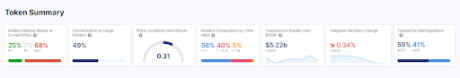
Estimates from the crypto analysis platform IntoTheBlock show that over 49% of LTC is held by accounts with more than 0.1% of the circulating supply. BitInfoCharts also puts addresses with more than 100,000 LTC having 38.01% of the total supply.
Source: IntoTheBlock
Who Are the Biggest Litecoin Wallet Holders Today?
Litecoin’s 84 million total supply has been distributed over the past 12 years through mining rewards and market trading. The biggest wallet addresses include large miners that have accumulated Litecoin from years of mining and crypto exchanges. Charlie Lee, its creator, claims to have sold or donated all LTC tokens in his collection.
The honor of the biggest Litecoin wallet address belongs to “M8T1B”, accounting for 3.34% of the entire supply in circulation. This wallet holds 2,504,667 LTC worth $158,105,141 at the current market price.
Next is “ltc1qr” holding 2,225,000 LTC worth $140,451,374. Wallet addresses “MQd1f” and “ltc1qn” comes third and fourth in rankings, holding 1,344,464 LTC and 1,097,050 LTC worth $84,868,217 and $69,250,423 respectively. According to data from BitInfoCharts, these top four addresses hold 8.18% of the total coins in circulation.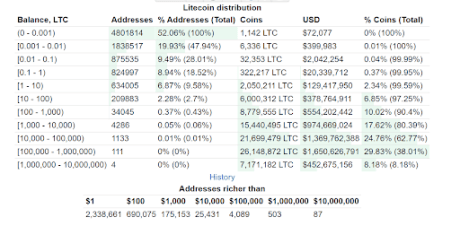
Other top-ranking whales include addresses “ltc1q2” and “MQSs1,” with 927,542 LTC ($58,550,373) and 745,000 LTC ($47,027,540), respectively. Looking through the data shows these six addresses are the Litecoin blockchain whales holding more than 1% of the circulating supply. Metrics from IntoTheBlock put the total concentration of these whales at 11.88% (8.84 million LTC).
Wallets “MB8nnF”, “MFULdM,” “MESruS,” and “LZEjck” complete the top 10 rankings with 513,259 LTC, 472,674 LTC, 416,688 LTC, and 394,044 LTC, respectively.
What Does Litecoin’s Supply Distribution Mean for the Future?
There seems to be a dull market movement with the whales as sellers continue to maintain control over the market. As a result, the inflow to wallets holding at least 0.1% of the circulating supply has decreased by 91.07% in the past three months.
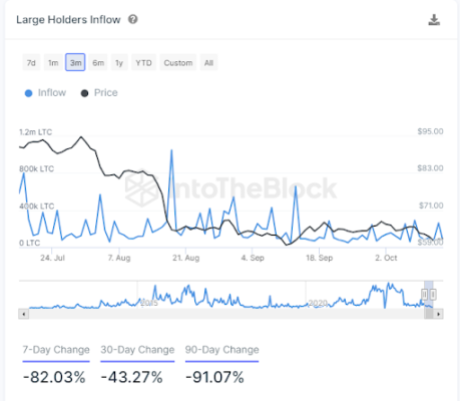
Source: IntoTheBlock
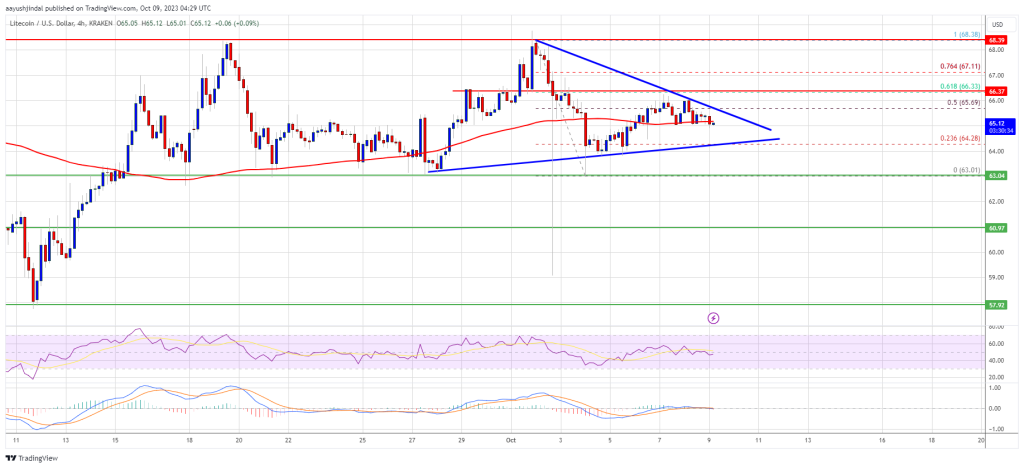
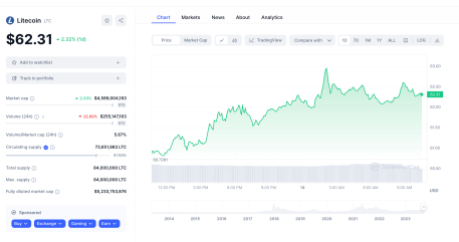
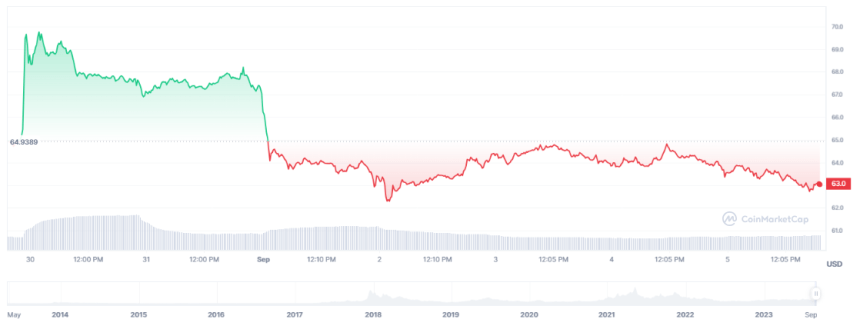
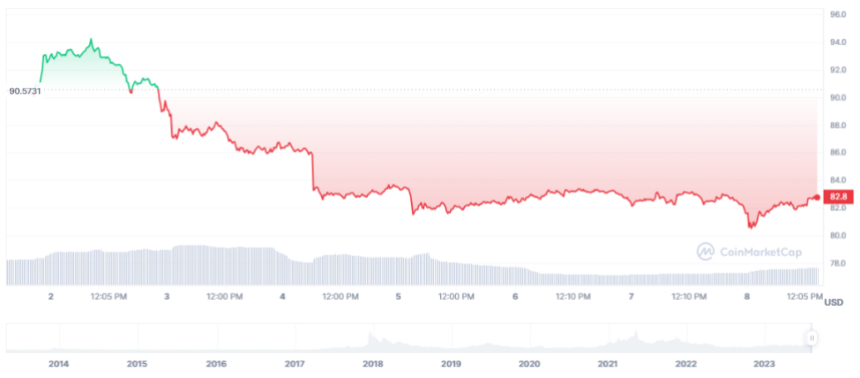
With 87% of LTC already mined, the rate of new supply will slow down over time. This could support price stability and sustainability. Litecoin is currently trading at $63.07, and like all cryptocurrencies, and pseudonymous crypto analyst P_S_trade predicts Litecoin can push up to $84 very soon.
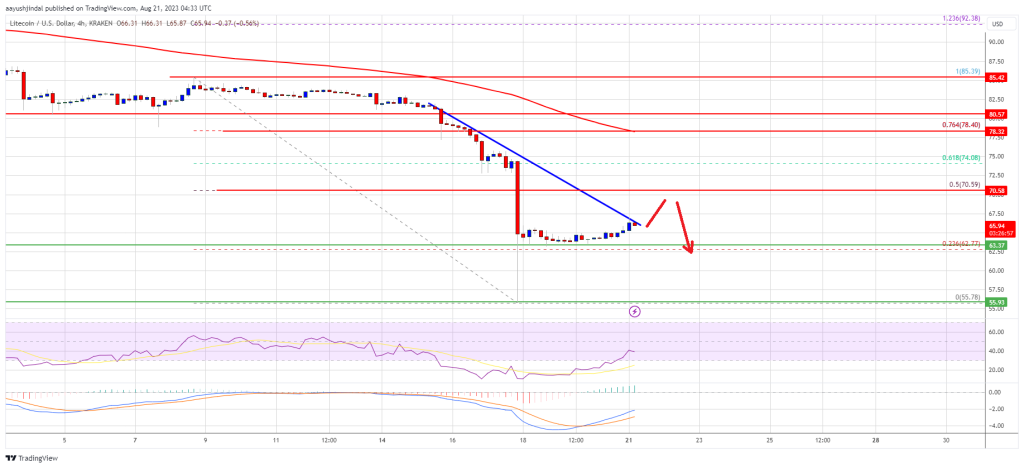
According to historical data compiled by crypto analyst Tony “The Bull”, Litecoin has always retraced 70% in the weeks following its past halvings. However, the recently concluded halving event may present a different narrative.
Litecoin is currently trading in a range since last week and is seeking to extend its gains of 2.35% over the past 24 hours.