Litecoin ETF Rumors Fuel 10% Surge As Institutions Hint At Interest

Rumors regarding a potential spot Litecoin (LTC) Exchange-Traded Fund (ETF) have sparked a significant price surge, with the digital asset gaining 10% amid speculation of institutional interest. Fox Business journalist Eleanor Terrett, through a post on X (formerly Twitter), unveiled insights suggesting growing institutional intrigue towards a Litecoin ETF.

Terrett shared, “SCOOP: Hearing rumblings on the institutional level about possible interest in a Litecoin ETF. The logic is that because of LTC functional similarities to BTC, the SEC may be more inclined to approve it, possibly even more so than ETH.”

Why A Spot Litecoin ETF Could Be Possible

This statement comes at a pivotal time as the crypto market continues to navigate through regulatory uncertainties and growing interest from traditional financial institutions. Adding to the buzz, Terrett highlighted recent actions by the Coinbase Derivatives to launch futures contracts for Dogecoin, Litecoin, and Bitcoin Cash, all set to begin on April 1st, 2024.

These futures contracts, as detailed, are part of Coinbase’s strategic move to diversify its offerings, leveraging the self-certification approach under CFTC Regulation 40.2(a). This approach permits entities to launch new products without the explicit approval of the CFTC, provided they comply with the Commodity Exchange Act and accompanying regulations.

Moreover, the recent classification of Ethereum (ETH) and Litecoin (LTC) as commodities by the Commodity Futures Trading Commission (CFTC) in its lawsuit against KuCoin has added another layer of legitimacy to the discourse surrounding Litecoin’s regulatory standing. The CFTC’s action emphasizes its view of certain cryptocurrencies as commodities.

Amidst these regulatory clarifications and developments, discussions about the potential approval of a spot Litecoin ETF have intensified. Luke Martin, a renowned crypto analyst, echoed the sentiment, suggesting that the approval of an Ethereum ETF could pave the way for other “old altcoins,” like Litecoin, which may have a stronger case for not being classified as securities.

He stated, “When the ETH ETF launches and passes, the question then becomes especially with the SEC’s track record versus tokens […] there’s other dinosaur old altcoins which you can make almost a stronger case [that] they’re not a security, one that sounds ridiculous but if you think deeply about it, it’s true – Dogecoin you could probably prove easier is not a security than ETH. Why wouldn’t they launch Litecoin, Dogecoin?”

Adding to the momentum, Alan Austin, Managing Director at the Litecoin Foundation, expressed enthusiasm about the prospects of a spot Litecoin ETF, stating, “I’ll say it again, love or hate ETFs, the first company to launch a Litecoin ETF is going to crush it!”

LTC Price Is Lagging Behind

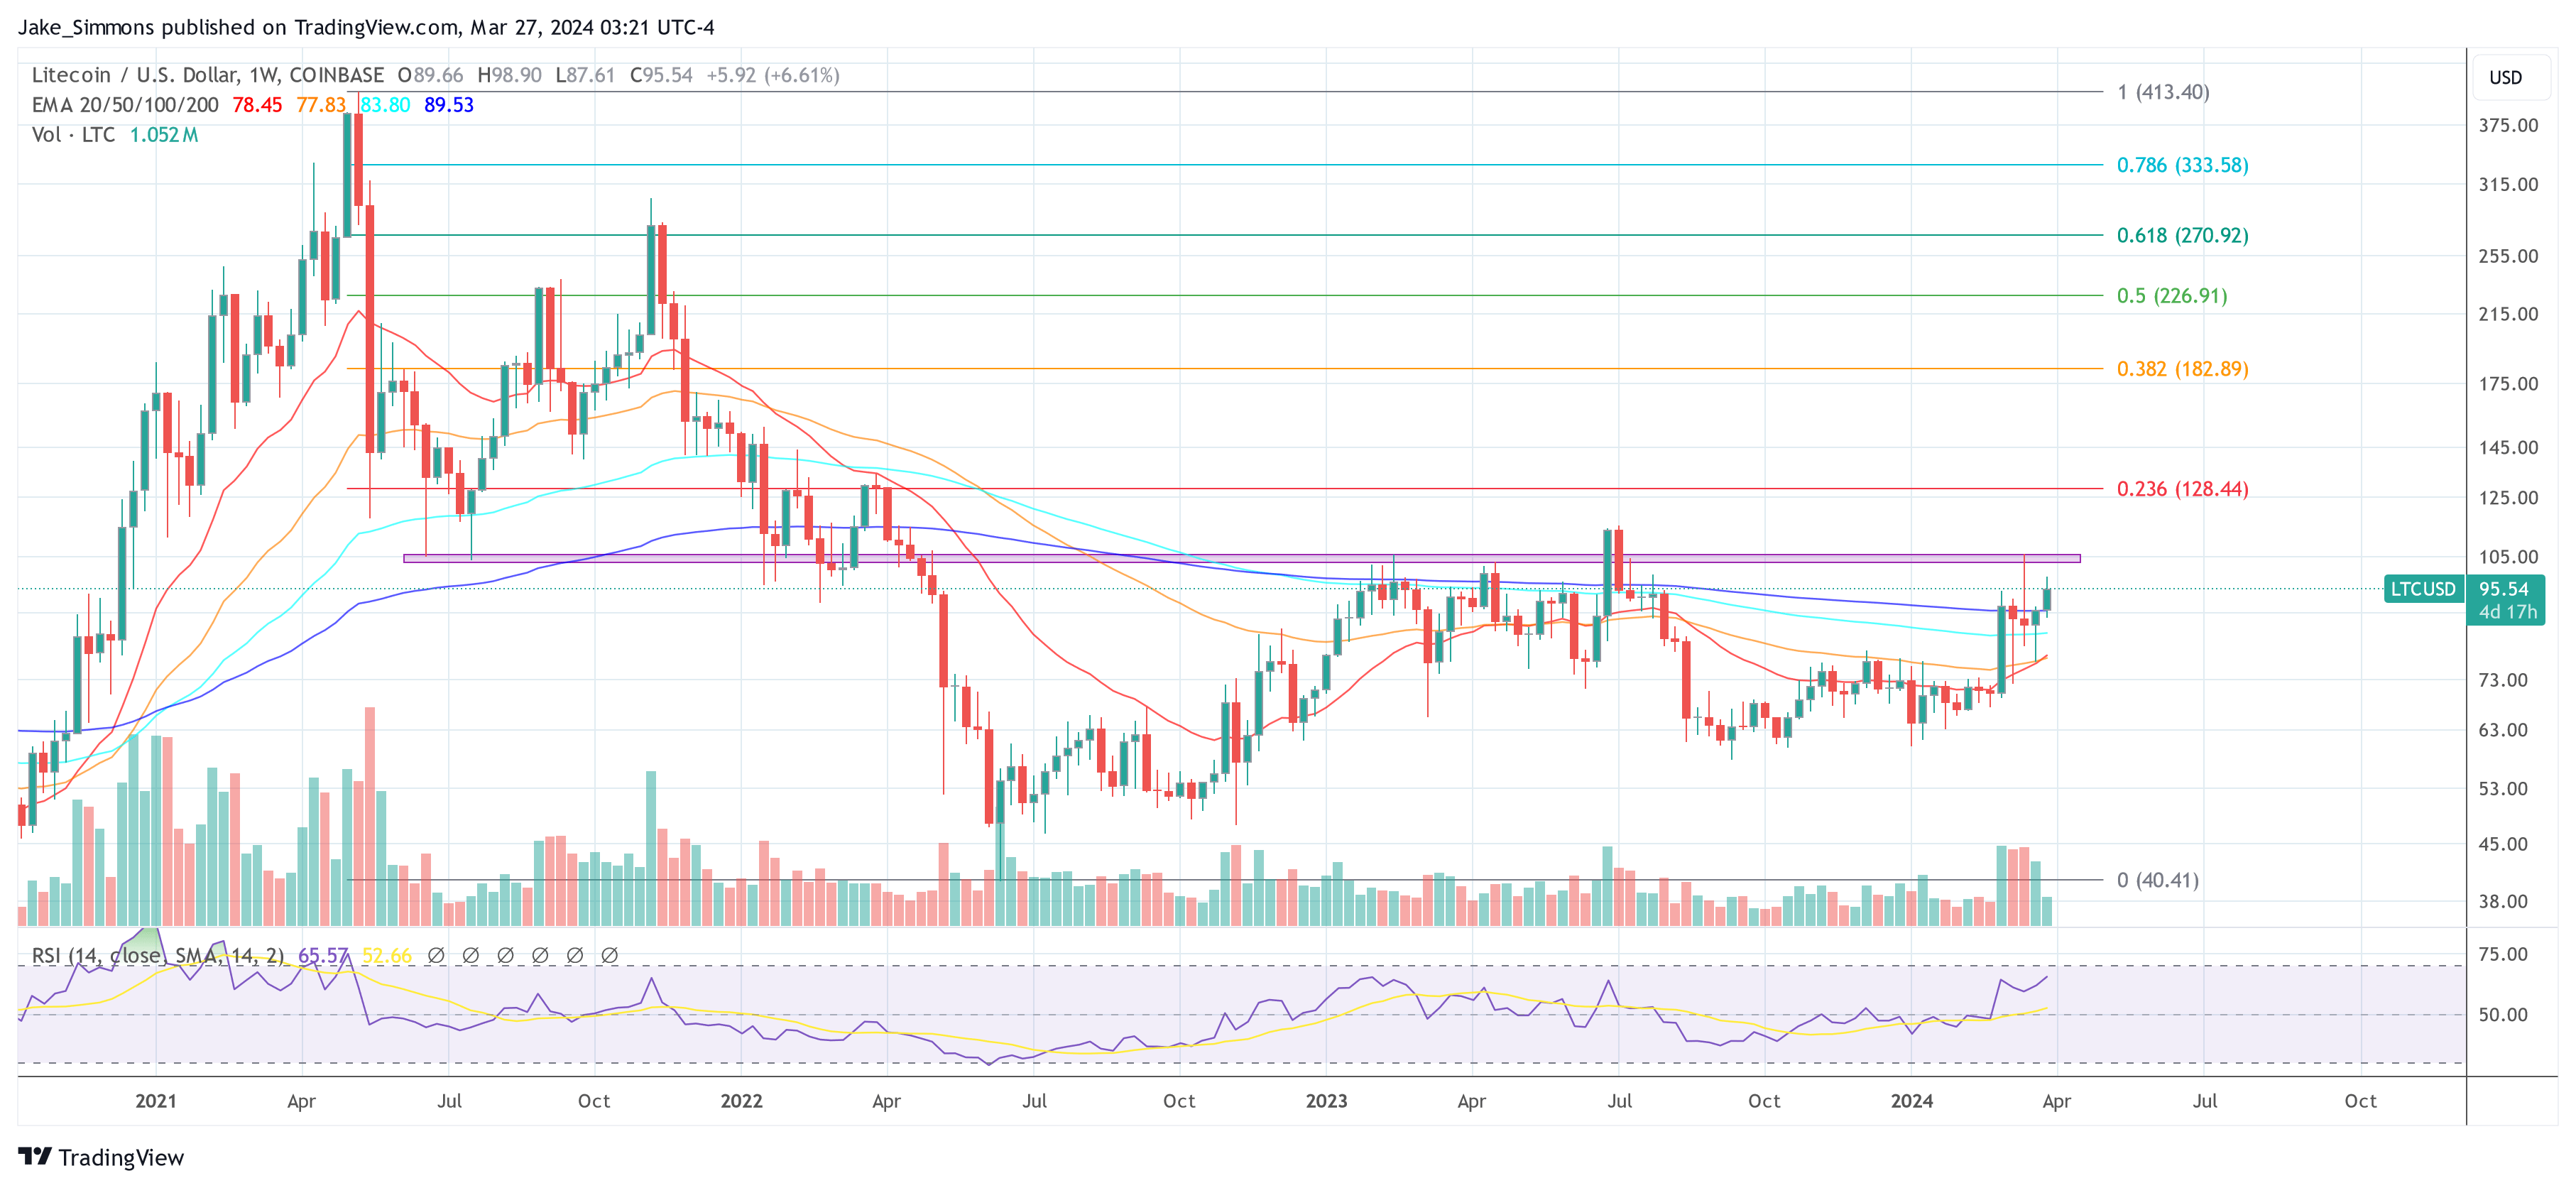
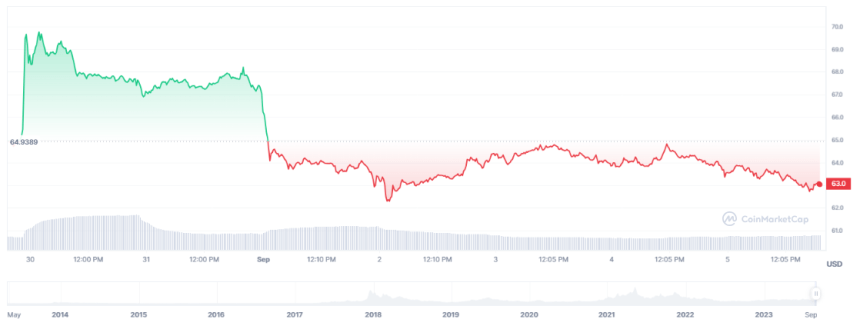
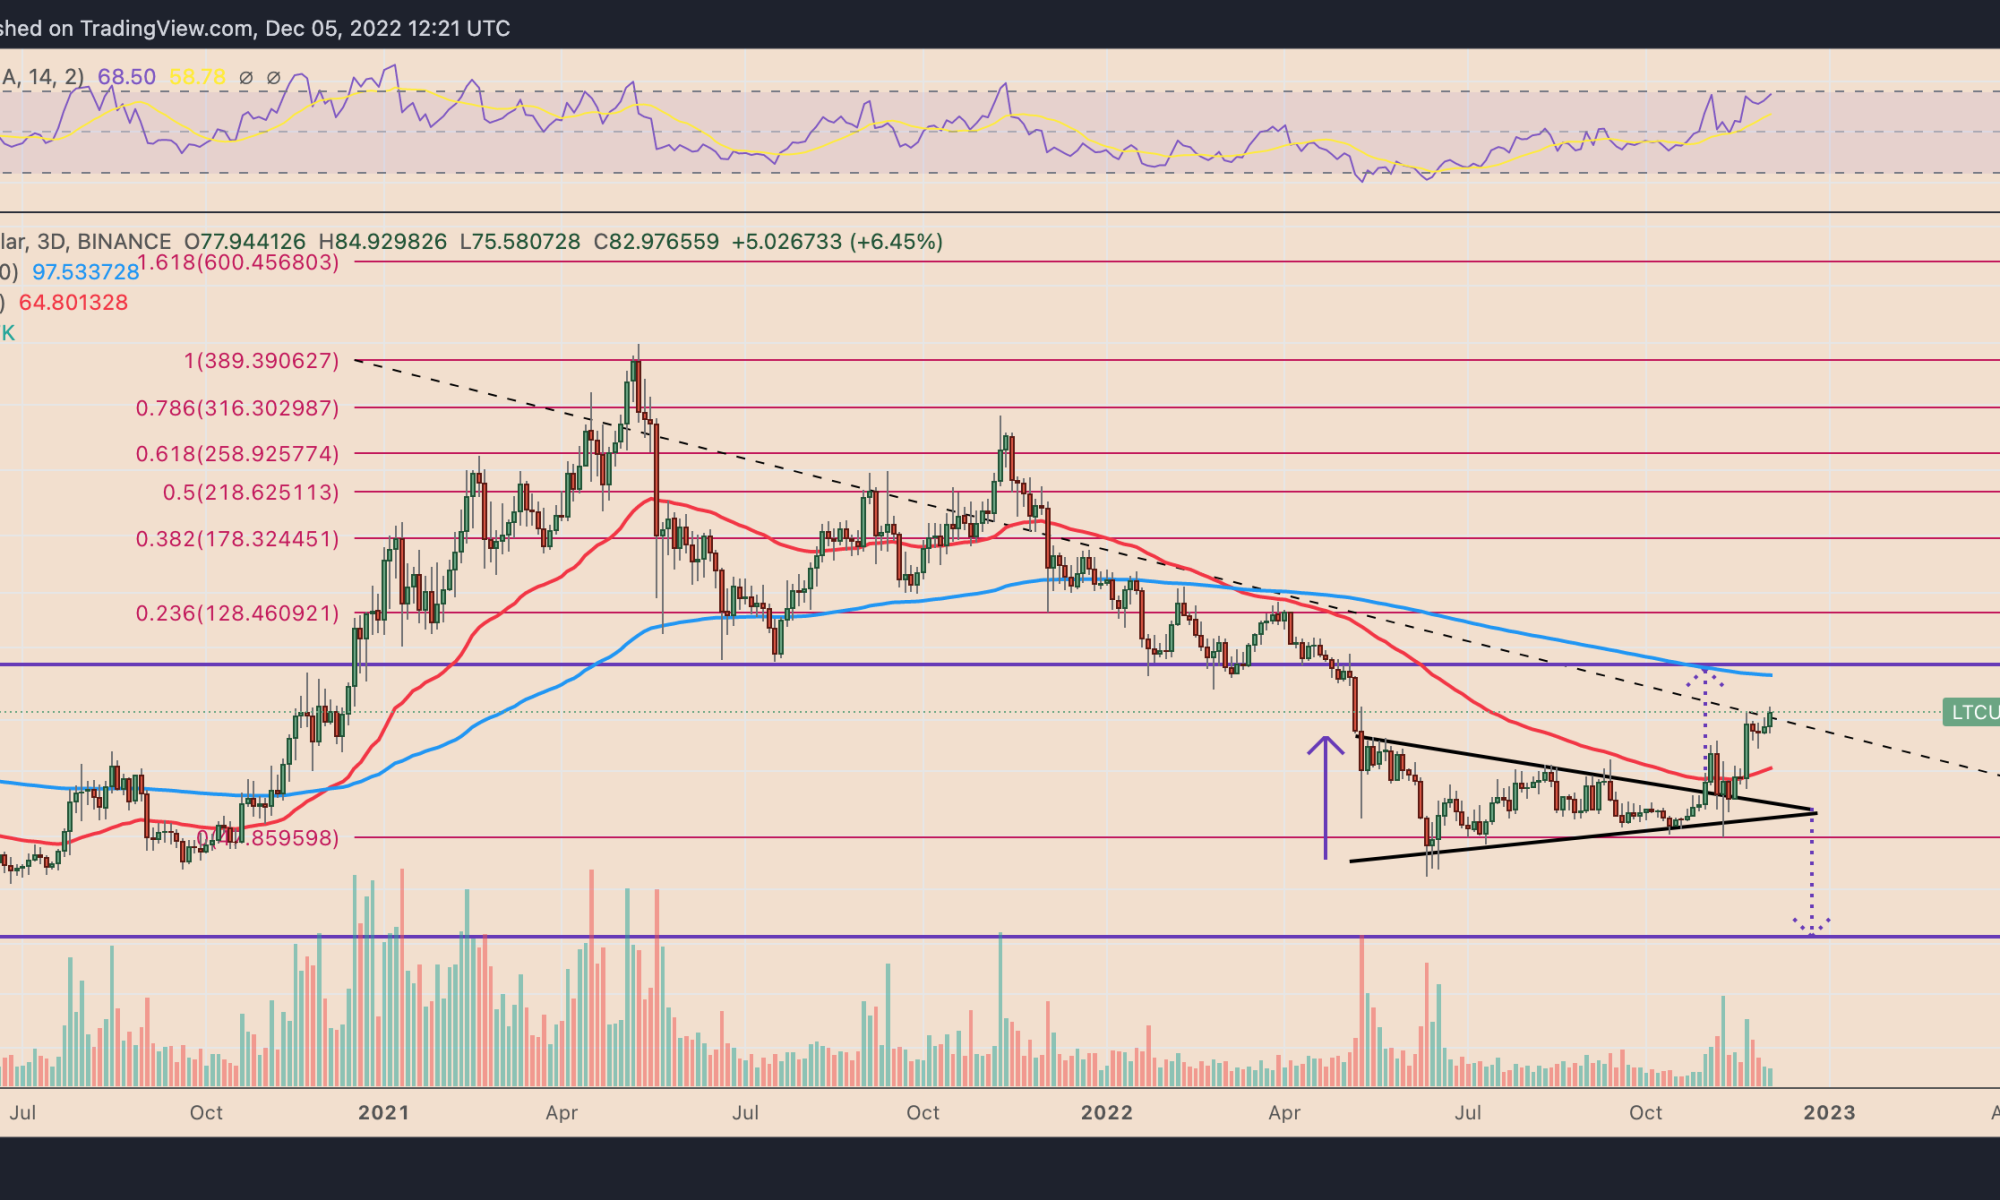
Despite the current buzz, Litecoin’s price analysis indicates that it is still down by 77% from it’s all-time high in May 2021, signaling a bearish trend in comparison to other cryptocurrencies that have already surpassed their 2021 peaks. Nevertheless, a recent break above the 200-week EMA has ignited a glimmer of bullish momentum.

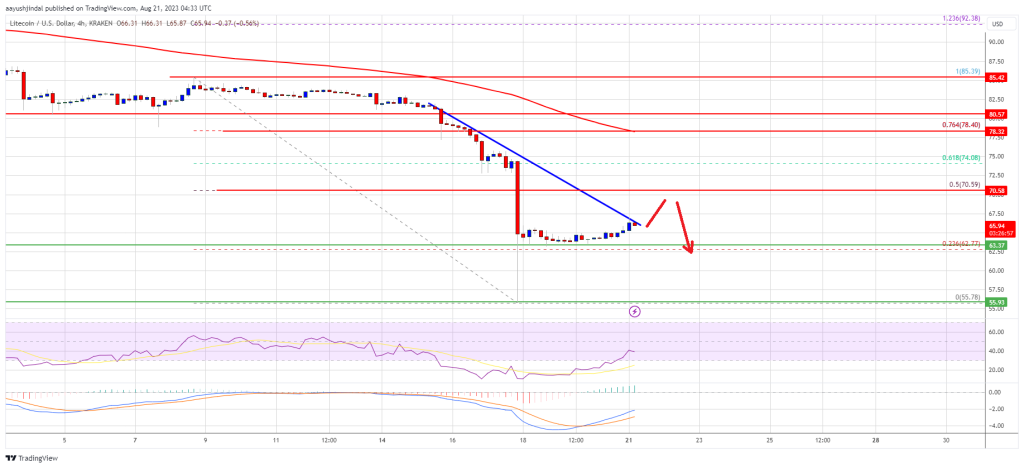
Overcoming the red resistance zone between $102 and $106 could be critical for Litecoin to reach new heights, with the $128 mark (0.236 Fibonacci retracement level) as a potential near-term target.

Litecoin price

Trading Guru John Bollinger Warns Of Buying Litecoin, Here’s Why

In his latest analysis, legendary trader John Bollinger has expressed concerns over Litecoin’s performance, particularly in comparison to Bitcoin. Bollinger, known for developing the popular technical analysis tool Bollinger Bands, highlighted a worrying pattern in the Litecoin market.

He remarked, “I was asked for an analysis of LTCBTC. The thing that concerns me the most is its underperformance vs Bitcoin. From a price perspective the controlling LTCUSD feature is the 2 bar reversal at the lower Bollinger Band which is typically considered a bearish signal by traders.”

Litecoin price analysis by John Bollinger

Bollinger’s Bearish Litecoin Prediction Explained

The chart of the LTC/USD pair provided by Bollinger on November 28, 2023, shows Litecoin’s price action in relation to its Bollinger Bands on both a daily and weekly scale. The price is currently hovering around $69.566, which is significantly lower than the upper Bollinger Band, suggesting a lack of bullish momentum.

The Bands form by plotting a range of standard deviations above and below a simple moving average, commonly enveloping the price action. In this chart, the daily vs. weekly candles chart shows that the LTC/USD price is struggling beneath the midpoint of these bands, which is a bearish indication. The price currently near $69.566 is substantially below the upper band level of around $90, which represents a potential resistance level.

The Bollinger Bands (BB) on the chart are set with a 20-period moving average with a 2 standard deviation range. Bollinger’s analysis points to a ‘2 bar reversal’ pattern at the lower band. This pattern emerges when a bar reaches a high above the preceding bar but then closes below the close of that same previous bar, hinting at a possible reversal from the uptrend. Such a pattern took place near the lower band, indicating that any effort to drive the price higher meets with resistance, and the prevailing selling pressure is taking hold.

The Bollinger %B indicator is also crucial here as it compares the price of Litecoin to the range defined by the Bollinger Bands. A %B value below 0.5 indicates that Litecoin’s price sits nearer to the lower band than to the upper band, potentially signaling weakness. The chart shows the indicator failing to cross the 0.5 level after a plunge toward 0, signifying that the price frequently touches or falls below the lower band.

LTC Price Under Pressure

The Bollinger Band Width (BBW) serves as another indicator, measuring volatility by assessing the Bollinger Bands’ width. A narrowing of the Bands, as seen in the latter part of the chart, suggests a decrease in volatility and often precedes a significant price movement. In this context, the BBW’s narrowing on the Litecoin chart might indicate that the market is tensing, possibly gearing up for an impending breakout or breakdown.

When Bollinger mentions Litecoin’s underperformance relative to Bitcoin, it’s important to note that Bitcoin often leads the crypto market trend. If Litecoin is not keeping up with Bitcoin’s movements, it could suggest a lack of confidence or interest from traders in altcoins (as the current rise in Bitcoin dominance shows) and Litecoin specifically.

In summary, Bollinger’s technical analysis indicates that Litecoin is in a precarious position. The price action at the lower Bollinger Band, the bearish ‘2 bar reversal’ pattern, the sub-0.5 Bollinger %B values, and the narrowing BBW all suggest that Litecoin may continue to see downward pressure in the near term.

At press time, Litecoin traded at $70.05. The 1-day chart of LTC/USD shows that the altcoin fell below the key support of the 0.236 Fibonacci retracement level at $69.98 two days ago. A retest is currently taking place, a daily close above this is of utmost importance for the Litecoin price.

Litecoin price

Litecoin Whales Are Back In The Game, Can Price Reach $100?

Litecoin (LTC) whales are making their way back into the market once more as the bull market establishes itself. A number of large transactions have been flagged which suggests that these millionaire accounts are coming out to play.

Litecoin On-Chain And Whale Activity Hit 4-Month High

The Litecoin on-chain and whale activity has been on the rise recently, as reported by the on-chain analytics platform Santiment. In the report posted to X (formerly Twitter), Santiment revealed that there had been a big spike in the Litecoin on-chain activity.

The chart shared by the tracker showed the spike taking place in line with the price recovery, which would be the reason why investors are awakening once more. Santiment noted that this recovery in on-chain activity saw address activity on the blockchain, as well as whale activity reaching levels not seen since June, representing a 4-month high in this metric.

Litecoin whales

A total of 319,000 daily addresses were active on the network after this metric dropped drastically in the last few months Additionally, weekly whale transactions, that is transactions carrying more than $100,000 rose and touched a new 4-month high of 7,418.

These are not the only metrics that saw a spike as the dormant LTC address started seeing movement again. These addresses which had previously not seen movement for a while began to move coins around, adding to the current number of coins in circulation.

LTC Ready For A Shoot To $100?

The revival of on-chain activity for Litecoin is a welcome development for the network but it is not exactly bullish. The reason for this is how the LTC price has reacted since this activity commenced, which is not very encouraging.

As the dormant LTC started to move once more, the price began to decline. This suggests that this subset of holders may be selling their coins after holding and waiting for better prices. In this case, the selling pressure has outweighed the demand for the coin.

A continuation of this will likely see the price continue to fall further, and a recovery to $100 is still far off on the horizon. So this recent bout of activity may just be investors choosing to sell rather than coming back to participate in buying.

The LTC price already fell from its $69 level on Thursday to as low as $67 on Friday before mounting a small recovery. Presently, the Litecoin price is sitting at $67.8, representing a 2.14% decrease in the last day.

Litecoin price chart from Tradingview.com

Crypto Analyst Puts Litecoin Price At $84, Here’s The Timeline

Since its third halving event was successfully completed in early August, the Litecoin price has fallen off the radar of crypto investors. This was mainly due to the price decline that LTC experienced after heavy profit-taking from investors who had invested leading up to the price surge triggered by the expectations around the halving. But it seems the tides are finally turning for the coin as one analyst predicts a more than 30% increase in price going forward.

Litecoin Price Shooting For The Stars

The current crypto market headwinds seem to be working in favor of the Litecoin price which one crypto analyst believes is gearing up for a run-up to $83. In the post, the pseudonymous analyst identified as P_S_trade points to the possibility of the crypto market continuing its growth trend. However, this would be null and void if the crypto market were to reverse back below $27,000.

For Litecoin, the analyst points out that the altcoin has usually been the first to start to see an upside in the crypto market. But this has not been the case, as previously mentioned since high levels of profit-taking have affected the LTC price.

Litecoin price chart from Tradingview.com

Even from the current level, the analyst’s chart points toward a possible retracement from here back down to $55. However, once this is completed, the bounce-off from there shows LTC reaching as high as $77 before succumbing to another correction.

This decline is also similar to the first instance where it falls to $55 in the fact that it signals another price surge. Following this second correction, the analyst puts the bottom somewhere around $67 before Litecoin continues its ascent once more.

The top of this second rally then lands just above $84 on the chart. Although there is no official timeline, the range of trades mentioned by the analyst is the medium term, which could see this run out for a couple of months.

Litecoin price chart from Tradingview.com (LTC prediction crypto analyst)

LTC Daily Transactions Continue To Decline

While the analyst foresees Litecoin price to surge, other metrics could be pointing in the opposite direction. For one, the daily transaction numbers for the altcoin have been steadily on the decline since the halving event in August.

According to data from BitInfoCharts, the number of daily LTC transactions has fallen from over 584,000 in May to just shy of 104,000 transactions by Tuesday, October 10. This points to a lack of interest from investors usually brought on by bear market headwinds.

Additionally, the daily transaction volumes, as shown by the token tracking website CoinMarketCap, show a 13.26% decline in the daily trading volume of Litecoin. These bearish metrics could thwart chances of reversal. However, they could also signal the bottom that triggers the start of another rally.

Litecoin Eliminates Pre-Halving Gains As Volume Drops, Is A Fall To $50 Coming?

In the months leading up to the Litecoin halving in August, the price of the blockchain’s native LTC token was continuously on the rise. This renewed interest in investors who rushed back into the token and eventually pushed its price above $100. That is until the actual halving event rolled around, turning it into a “buy the rumor, sell the news” scenario. Since then, it has been a downward spiral for the token and the pain may not be over.

Litecoin Volume Slumps Post-Halving

Litecoin volume since the halving was completed has been less than expected. While investors expected rising demand for the LTC token with the diminished supply rate, the opposite has been the case. Instead, the daily trading volume of the cryptocurrency continued to slump.

In the last day, the Litceoin daily trading volume fell another 23%. This brought its daily volume to $255 million, a significantly low figure compared to the $500 million daily volumes that the cryptocurrency was recording leading up to the halving.

Litecoin volume

Just like the trading volume, the price of LTC has also plunged significantly. From its pre-halving peak of $112, the altcoin has fallen over 50% to its current level just above $60. This means that the asset has lost all of its gains accumulated between June and July 2023, just one month after the halving was completed.

So rather than being a bullish event as initially expected, the halving has proven to be more bearish than most. It also did not help that it took place during the bear market and LTC has fallen rapidly alongside larger assets such as Bitcoin and Ethereum.

Litecoin price chart from Tradingview.com (Volume)

Will LTC Fall Continue To $50?

At the current rate, the forecast does not look too good for the LTC price. Litecoin has understandably seen a 3% increase in the past day as Bitcoin recovered above $26,000. But this does not look sustainable by its current metric.

The first indicator of this is that falling daily trading volume means that interest in the asset is waning. As investors move to other assets they believe provide better prospects, this will affect the LTC price and could trigger further downside from here. Add to this that the coin’s price is below its 50-day and 100-day moving averages and it spells a recipe for disaster.

If LTC bulls are unable to hold support above $60 and it falls once again as it did on September 11, then $50 becomes a very possible landing point. Such a decline would put it back at November 2022 levels and signal a prolonged bear trend for the digital asset.

At the time of writing, LTC price is still sitting above $62 but the tug-of-war for control between bulls and bears continues to rage on.

Litecoin Price Momentum: Will It Sustain Above The $63 Mark?

Litecoin (LTC) has found itself in a tight consolidation phase, firmly locked within the $60 to $70 range since mid-August. Despite several attempts to break above the $70 resistance level, bulls seem to be running low on aggressiveness.

As of the latest data from CoinGecko, LTC is trading at $62.99, reflecting a 1.8% decline over the past 24 hours and a seven-day slump of 3.1%.

In recent weeks, LTC bulls have diligently defended the August 2022 range-high of $63, preventing a drop below this crucial support level. However, their efforts to push the price beyond $70 have proved futile. 

Litecoin Bulls Defend Key Levels But Face Technical Challenges

A closer look at the technical indicators reveals that the H12 bearish order book and the 50-day Exponential Moving Average (EMA) are posing significant challenges for the bulls.

Analysts believe that Litecoin could continue its consolidation above the $63 range-high in the coming hours or days. Still, the prevailing bearish pressure could hinder any substantial upward movement in the near term.

LTC’s Struggle Amid Growing On-Chain Activity

Surprisingly, despite Litecoin’s price consolidation, its on-chain data has shown increased activity in its ecosystem. According to a separate report, over the past four months, the share of Litecoin in global cryptocurrency payments has surged by an impressive 21%. 

This suggests that despite the stagnant price, Litecoin remains a popular choice for transactions.

Sell Limit Orders And Bearish Sentiments

To complicate matters further for LTC, order flow tracking platform Mobchart cited in an analysis significant sell limit orders at $66 (3.11k LTC) and $70 (3.26k LTC) on Binance Exchange’s spot market. 

These levels are strategically positioned between the H4 50-EMA and the H12 bearish order book, effectively forming a formidable barrier for Litecoin’s price to overcome. This adds to the growing challenges faced by LTC bulls in their quest to push the price higher.

Moreover, sentiment around Litecoin has been increasingly bearish in recent times, as indicated by a separate report revealing that LTC bears have strengthened by 19% in the past week. This surge in bearish sentiment has likely contributed to the current downward pressure on LTC’s price.

Litecoin (LTC) remains trapped within the $60 to $70 range, with technical indicators and significant sell orders acting as obstacles to any substantial price movement.

Despite on-chain activity showing promise, growing bearish sentiments continue to weigh on LTC’s price, making it a challenging period for Litecoin investors and enthusiasts.

(This site’s content should not be construed as investment advice. Investing involves risk. When you invest, your capital is subject to risk).

Featured image from CMC Markets

Grayscale’s Win Breathes Life Into Litecoin, Post-Halving Rally On?

In a refreshing ruling on August 29, the United States District of Columbia Court of Appeals said the stringent Securities and Exchange Commission (SEC) was, after all, wrong in denying Grayscale to convert their over-the-counter (OTC) Bitcoin Trust (GBTC) into a Bitcoin spot exchange-traded fund (ETF). 

The regulator had previously barred the conversion of the GBTC to an ETF, citing an alleged absence of measures to prevent price manipulation, forcing Grayscale to sue. Before this ruling, the presiding judge said SEC needed to elaborate on why they denied Grayscale’s application.

Litecoin Rebounds

Following today’s court statement, Bitcoin prices soared, and the aftermath of this pump has positively impacted Litecoin. As it is, BTC is up roughly 10%, sharply rebounding from around $25,800 support recorded last week. Meanwhile, LTC, the bitcoin “silver,” is up 7% when writing, aiming to reverse losses of August 17. 

Litecoin price on August 29| Source: LTCUSDT on Binance, TradingView

Litecoin is changing hands at around $70, with a noticeable increment in trading volumes. Typically, in crypto trading, a spike in volumes, regardless of trend direction, can point to engagement and provide a “hint” of traders’ sentiment.

With rising volumes and expanding prices, it could suggest that bulls are positioning themselves for even more gains in the sessions ahead. Meanwhile, sharp losses with increasing volumes may mean bears are unloading, and prices may drop.

Post-Halving Rally On?

The expansion in LTC trading volumes, as visible in the daily chart, could translate to a possible bottom for the digital asset that has been under pressure in the past few sessions. To illustrate, LTC is down 26% in August 2023 alone. This dump is despite news of the Litecoin network halving its miner rewards to 6.25 LTC in early August. 

In crypto, halving events has historically been associated with fresh cycles of increasing demand for the underlying coin. For Bitcoin, past performances indicate that the coin tends to rally months after the halving event. Meanwhile, in Litecoin, it has been mixed, but spot prices are generally higher than in 2019 when it halved.

With Grayscale igniting demand in Bitcoin and other proof-of-work altcoins like Litecoin, it is yet to be seen whether bulls will build on this and push prices, especially of LTC, higher. LTC prices are currently trending inside the August 17 bear candlestick.

Technically, this is bearish from volume analysis. A sharp reversal and rally, ideally above $75, peeling back August 17 losses, might catalyze more demand, potentially setting the base for a relieving post-halving rally. 

If this is the case, August 17’s losses could be the climactic end of the leg down as LTC establishes a triple bottom at around the $60 and $65 support zone. Previously, LTC found support in this region in March 2023 and December 2022.

Litecoin Price Prediction: LTC Faces Uphill Task Near $70

Litecoin price declined heavily below $80 and $70 against the US Dollar. LTC is attempting a recovery wave but upsides might be limited above $70.

  • Litecoin is correcting losses from the $56 support zone against the US Dollar.
  • The price is now trading below $70 and the 100 simple moving average (4 hours).
  • There is a key bearish trend line forming with resistance near $66.00 on the 4-hour chart of the LTC/USD pair (data feed from Kraken).
  • The price could recover above $66 but the bears might remain active near $70.

Litecoin Price Starts Recovery

This past week, there was a sharp decline in Bitcoin, Ethereum, Litecoin, and other altcoins against the US Dollar. LTC price formed a top near $85 before it started a fresh decline.

There was a sharp decline below $80 and $70. The price even declined below $60. It traded as low as $55.78 and recently started an upside correction. There was a minor increase above the $60 resistance level. The price climbed above the 23.6% Fib retracement level of the downward move from the $85.39 swing high to the $55.78 low.

Litecoin is now trading below $70 and the 100 simple moving average (4 hours). There is also a key bearish trend line forming with resistance near $66.00 on the 4-hour chart of the LTC/USD pair.

On the upside, immediate resistance is near the $66 zone. The next major resistance is near the $70 level. It is close to the 50% Fib retracement level of the downward move from the $85.39 swing high to the $55.78 low. If there is a clear break above the $70 resistance, the price could start another strong increase.

Litecoin Price Prediction

Source: LTCUSD on TradingView.com

In the stated case, the price is likely to continue higher toward the $75 and $78 levels. Any more gains might send LTC’s price toward the $85 resistance zone.

Fresh Decline in LTC?

If Litecoin price fails to clear the $70 resistance level, there could be a fresh decline. Initial support on the downside is near the $63.50 level.

The next major support is forming near the $60 level, below which there is a risk of a move toward the $56.00 support. Any further losses may perhaps send the price toward the $52 support.

Technical indicators:

4-hour MACD – The MACD is now gaining pace in the bullish zone.

4-hour RSI (Relative Strength Index) – The RSI for LTC/USD is still below the 50 level.

Major Support Levels – $63.50 followed by $60.00.

Major Resistance Levels – $66.00 and $70.00.

Litecoin Price Plunges To Sub-$70 Territory – What Traders Should Expect

Litecoin (LTC), the altcoin often dubbed as “silver to Bitcoin’s gold,” has found itself caught in the downward spiral of the cryptocurrency market, mirroring the struggles of its larger counterpart.

While LTC’s association with Bitcoin has long been a double-edged sword, the recent price crash is putting on the spotlight the intricate interplay between these digital assets.

As Bitcoin (BTC) grapples with a precipitous decline, currently trading below $26,000, the impact reverberates across the broader crypto landscape. LTC, trading at $64.15 according to CoinGecko, has encountered a 1.5% drop over the last 24 hours, contributing to a week-long slump of 23.2%.

Litecoin Loses Grip On The $70 Handle

This downturn prompted a cascade of over $1 billion worth of position liquidations within a 24-hour window, a testament to the market’s heightened volatility.

In the midst of intraday trading, Litecoin momentarily dipped to the $60 mark before staging a recovery. This decline has pushed LTC to year-to-date lows, ominously edging toward the lows witnessed in December 2022.

Yet, understanding the dynamics behind LTC’s struggle requires delving into its intricate relationship with the alpha coin

Litecoin Price Dependence On Bitcoin

The intrinsic connection between Litecoin and Bitcoin has both bolstered and hampered LTC’s journey. Historically positioned as a complementary alternative to Bitcoin, Litecoin carved its niche by embracing faster transaction speeds and a different mining algorithm.

However, the symbiotic relationship between these two cryptocurrencies also makes Litecoin susceptible to Bitcoin’s market movements.

Litecoin’s recent setback underscores this interdependence. Analysts contend that Litecoin’s price trajectory has often mirrored Bitcoin’s, with downturns accentuated by its role as a secondary asset.

While Litecoin offers distinct utility, its fate remains intertwined with the broader market sentiment and Bitcoin’s performance. This connection has led to LTC’s price behavior echoing Bitcoin’s, both in its drops and potential recoveries.

Navigating The Path Ahead: Key Levels To Watch

As Litecoin navigates this challenging terrain, crucial support and resistance levels come into play. Analysts are closely monitoring a potential consolidation of losses within the range of $56 to $70, contingent on Bitcoin’s further losses. The $70 mark represents a pivotal point, indicating bullish intent if breached, and an edge for the bulls only above $75.

Litecoin

Key resistance levels lie at $70 and $78.5, acting as hurdles on LTC’s potential recovery journey. Conversely, essential support levels rest at $50.5 and $42, indicating the critical junctures that could either exacerbate LTC’s downturn or potentially pave the way for resilience.

As the market continues to evolve, the lessons from these fluctuations offer valuable insights into the evolving nature of digital assets and the nuanced relationships that underpin their value fluctuations.

(This site’s content should not be construed as investment advice. Investing involves risk. When you invest, your capital is subject to risk).

Featured image from Coin Insider

Can Litecoin Bulls Turn The Tide On Recent Declines? A Closer Look

Litecoin (LTC) has recently faced a period of bearish pressure that has taken a toll on its market performance. The months of July and August have witnessed a shift in sentiment, as bearish forces began to dominate the crypto market. 

As of the latest update, LTC finds itself trading within a critical support zone, prompting discussions among traders and analysts about its potential trajectory.

With the value of LTC hovering just below the $80 mark, market observers are closely monitoring whether this level will hold against the prevailing bearish sentiment.

Litecoin Vital Support Zone Tested

A recent price analysis has underscored the significance of the $80 threshold, suggesting that a breach below this point could potentially trigger an extended downtrend for Litecoin.

The current market figures reflect a small 24-hour uptick of 0.2% and a seven-day decline of 8.5% with a current price of $82.57 on CoinGecko, painting a cautious picture for LTC’s short-term performance.

The fluctuations in price during this period have sparked discussions about the factors contributing to Litecoin’s recent struggles.

Halving Event And Its Impact

The crypto community is no stranger to the phenomenon of halving, an event embedded in the genes of cryptocurrencies like Litecoin. In 2019, Litecoin underwent its second halving, a pre-programmed event that occurs approximately every four years.

This event, characterized by a reduction in block rewards issued to miners, has historically carried significant implications for price trends.

The halving event in 2019 witnessed a fascinating sequence of events. In the lead-up to the halving, Litecoin’s price experienced a rally, generating excitement among investors. However, the post-halving scenario took an unexpected turn as an extended downtrend followed, lasting for over 500 days.

This downtrend was succeeded by a period of consolidation, marking the complexity of crypto market dynamics and the interplay between halving events and price trends.

LTC’s Third Halving Event And Network Fundamentals

Fast-forward to August 2, 2023, and Litecoin’s blockchain has just experienced its third halving event. Occurring at block 2,520,000, this event has effectively slashed mining rewards to 6.25 LTC per block. Despite the prevailing lull in price action, Litecoin’s network fundamentals remain robust. 

Meanwhile, Litecoin’s hashrate is poised to achieve an all-time high, exemplifying the network’s resilience and ongoing miner participation.

Presently boasting a difficulty level of 933.2 TH/s, Litecoin inches closer to establishing a new record, highlighting its secure and decentralized network infrastructure. 

The strengthening hashrate and its associated positive network indicators underline Litecoin’s capacity to withstand market fluctuations and continue to evolve in the face of external pressures.

(This site’s content should not be construed as investment advice. Investing involves risk. When you invest, your capital is subject to risk).

Featured image from The Currency Analytics

The Litecoin $95 Question: Is A Bullish Breakout In The Pipeline?

Litecoin (LTC) is facing a critical juncture in its price surge, with its value hovering just above $89.52 on CoinGecko, showcasing a modest 0.3% increase in the last 24 hours. However, LTC has endured a slump of 3.6% over the past seven days. 

As the price continues to hover below the crucial resistance level of $95, investors are wondering if the muted performance of Bitcoin (BTC) will hinder LTC’s upward trajectory. Furthermore, all eyes are on the upcoming August halving event to determine if it will catalyze significant price action.

Understanding Litecoin Halving

In the context of cryptocurrencies like Litecoin, a halving is a programmed event that occurs when a specific number of blocks are mined on the blockchain. Litecoin, similar to Bitcoin, has a fixed supply cap and new coins are introduced into the market through mining. 

Approximately every four years, the mining reward for each block is cut in half, reducing the rate at which new coins enter circulation. This process is known as “halving” and is intended to control inflation by gradually limiting the supply of new coins.

LTC’s price surge beyond $95 has encountered significant resistance, as this level had previously acted as support in early July. However, as BTC’s performance weakened, the support flipped to resistance, creating an obstacle to Litecoin’s advancement.

The fate of LTC’s price action remains closely intertwined with Bitcoin’s performance, as the latter serves as a bellwether for the broader cryptocurrency market.

Impact Of BTC’s Performance

Being the most dominant and influential cryptocurrency, Bitcoin often dictates the market’s direction. If BTC remains weak, with its price currently at $29,414 at CoinGecko, Litecoin’s ability to break past the immediate $95 resistance level could be hindered. 

A retest of the 38.2% Fibonacci retracement level at $88 might be possible in such a scenario. On the other hand, a solid and decisive move by Bitcoin could have a positive knock-on effect on Litecoin, propelling it past the resistance and potentially sparking a more significant price rally.

As the Litecoin halving approaches, investors are speculating whether this event will drive a significant price surge. Historically, halvings have been associated with bull markets in cryptocurrencies, as the reduced supply of new coins can create a supply-demand imbalance, leading to higher prices.

However, it’s essential to recognize that the market’s sentiment, overall health, and broader macroeconomic factors also play crucial roles in determining price movements.

(This site’s content should not be construed as investment advice. Investing involves risk. When you invest, your capital is subject to risk).

Featured image from PublishOx

Bullish Case For Litecoin Grows Stronger As LTC Halving Draws Close

Litecoin (LTC) is still trending low like the rest of the cryptocurrency market but one thing that separates the altcoin from the others is its obvious bullish case. Unlike the rest of the market, Litecoin looks set for another rally which will likely be propelled forward by the next halving.

Litecoin Halving Presents Bullish Scenario

Just like Bitcoin, the Litecoin halving happens every four years and cuts block rewards by 50%. The aim of this halving is to reduce the amount of new supply flowing into the market. And as demand rises, there is less supply to meet this demand, thus leading to scarcity and a surge in prices.

The next Litecoin halving is now around the corner with only about three months left to go. This halving, like the ones before it, carries the same promise of a rally for the digital asset. The last halving in 2019 saw LTC’s price bottom out around $62 and then rally to a local peak of $80 in the same month.

Litecoin halving

If this year’s halving stays true to this trend, then the digital asset should be seeing some upside in the coming months. This could result in LTC clearing the $100 level once more as investors prep for the next leg-up.

A 20% upside is attainable at this point, especially with the halving expected to happen in early August. So more than likely, the buyers will dominate the market for the next two months, leading to rising prices for Litecoin.

LTC Outlook For 2023

Presently, the crypto market is seeing muted momentum as investors remain indecisive. For Litecoin, the upcoming halving remains a bullish event but the prospects for the months following the halving event do not look good given historical performances.

Litecoin price chart from TradingView.com

After each halving, LTC has seen a reversal in sentiment following the initial surge and the subsequent crashes have been more brutal than the uptrends. For example in 2019, LTC’s price crashed almost 50% in the month of September, one month after the halving was completed. This was because the bull market was yet to begin and the cryptocurrency fell back into lockstep with the rest of the market again.

Going by this historical performance, it would seem the best time to take profits would be toward the end of August after the asset has rallied around 30%. The window of opportunity closes with the month of September which has historically been a bearish month for cryptocurrencies.

At the time of writing, LTC is trading at $87.11, up 3.22% in the last day.

Litecoin (LTC) Tops List Of Christmas Gainers, Is $100 Still Possible?

Litecoin (LTC) emerged as the top gainer over Christmas Day with an impressive performance. This put it ahead of market leaders such as bitcoin and ethereum in terms of performance, solidifying its position as the market leader through the first half of the holidays.

Litecoin Tops List Of Gainers

Over the last 24 hours, Litecoin has been on an upward rally that put its price firmly above $65, turning resistance into support for it. The digital asset saw upwards of a 6% increase in price over the last day. The rally stopped just below $70 before a slight downward correction took place.

Given that most of the crypto market remained muted through Christmas, this put Litecoin right at the top of the gainers’ list. It also saw a significant jump in trading volume, rising more than 180% over the 24-hour period to be sitting at $437.7 million at the time of this writing. Its market cap crossed $4.9 and this saw it surpass Shiba Inu to reclaim its spot as the 14th largest cryptocurrency by market cap.

Other cryptocurrencies that made the gainers list was GRT with more than a 4.20% increase in price over the one-day period. ICP was third on the list with 3.56% gains, while CSPR followed closely behind at 3.21%. Terra Classic (LUNC) featured as 5th on the list, rising about 3% on Christmas to be sitting at $0.0001486.

Can LTC Reach $100?

Litecoin’s recent bullish movement can be attributed to CNBC’s Jim Cramer saying during an interview that holders of the cryptocurrency are “idiots.” Following this, the digital asset had begun to trend on social media, resulting in an upward rally on Christmas Day.

Litecoin (LTC) price chart from TradingView.com

However, LTC hit a roadblock just before reaching $70. Even though this put it above its 50 and 100-day moving averages, there was still enough resistance from the bears to keep it from reclaiming this position in the short term. This means that successfully beating $70 will likely see a rapid rise to $80 for LTC. But $100 remains a long way off for LTC.

The recent rally does not carry enough momentum to see it through to $100. Add in the fact that the crypto winter is still in full swing and it becomes improbable that the digital asset would be able to reach this price level in the short term. If bitcoin were to fall further and hit $10,000, then LTC could reach a low of $30 before the next bull market begins.

One important event to look towards that could mark a bullish trend for Litecoin, though, would be the next halving event happening in August 2023. When this happens, the block reward could drop another 50% to 6.25 LTC. This decrease in supply could end up pushing the price upwards, as long as demand remains high.

Featured image from GoBankingRates, chart from TradingView.com

Litecoin (LTC) Breaks Above $75 As Price Eyes $90; Here Are Levels To Watch

  • LTC’s price shows strength as price bounces off from a weekly low of $50 to trend higher, giving bulls some relief. 
  • LTC’s price continues to look strong as bearish sentiment for the market lingers, with things looking uncertain for most traders and investors. 
  • LTC’s price rallies high on the daily timeframe as the price moves towards $90 above the 50 and 200 Exponential Moving Averages (EMA)

Litecoin (LTC) price has held strong above $60, showing good bullish signs of rallying to a high of $90-$100 if the market conditions remain favorable for prices. With many looking for a major dump in Bitcoin (BTC) price, the price of Bitcoin (BTC) bounced from $15,500 as price rallied to a high of $16,500, leaving bears on the sidelines as the price of Litecoin (LTC) gains more momentum to rally. The price action displayed by Litecoin (LTC) in recent times has been encouraging compared to many altcoins battling for survival. The Domino effect of the FTX saga and other huge investors involved has left the market at a standstill as the market is yet to make a major move after previous weeks. (Data from Binance)

Litecoin (LTC) Price Analysis On The Weekly Chart

The past few days haven’t been the best of times for most crypto traders and investors, with many becoming worried as to where the market could be headed after so much turbulence in the crypto space as many altcoins have struggled to show strength, losing their key support in a bid to survive. 

The current uncertainty surrounding the market has resulted in reluctance on the part of traders and investors to make altcoin purchases, as there is no assurance if they would be heading up any time soon.

The price of LTC has been a standout performer of the market as prices continue to show immersed strength holding up well above $60 despite the persistent FUD (fear of uncertainty and doubt). LTC saw its price traded in a region of $60 on the weekly chart, but the price bounced from this region to a rally high of $80, showing some great strength. The price of LTC faced resistance to trade higher to a region of $90-$100. LTC price needs to break above $80 for more signs of a rally. 

Weekly resistance for the price of LTC – $80.

Weekly support for the price of LTC – $60.

Price Analysis Of LTC On The Daily (1D) Chart

Daily LTC Price Chart | Source: LTCUSDT On Tradingview.com

The price of LTC remains considerably strong in the daily timeframe as the price trades above $70 support after breaking up nicely from its daily range movement showing some great price action to trend higher to a region of $80. 

If the price of LTC breaks and holds above $80, we could see more rallies for the LTC price to a region of $90-$100; a break below a region of $70 would send the price back to a region of $60.  

Daily resistance for the LTC price – $80.

Daily support for the LTC price – $75-$70.

Featured Image From zipmex, Charts From Tradingview