Litecoin Price Prediction: LTC Could Rally If It Clears This Barrier

Litecoin price is recovering higher from the $75.00 zone against the US Dollar. LTC could continue to rise if it clears the $84.00 resistance zone.

  • Litecoin is showing positive signs from the $75 support zone against the US Dollar.
  • The price is now trading below $85 and the 100 simple moving average (4 hours).
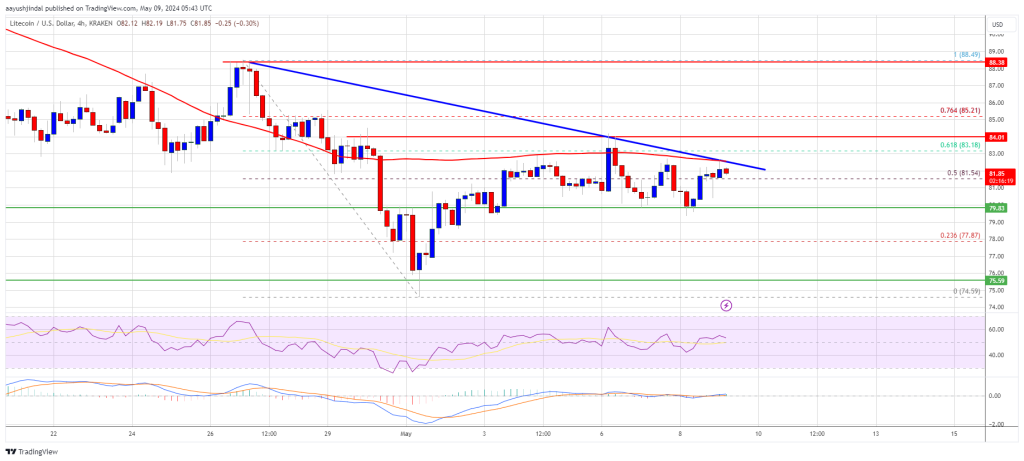
  • There is a key bearish trend line forming with resistance at $83.00 on the 4-hour chart of the LTC/USD pair (data feed from Kraken).
  • The price could gain bullish momentum if it clears the $83-$84 resistance zone.

Litecoin Price Aims Higher

After a steady decline, Litecoin found support near the $75.00 resistance zone, like Bitcoin and Ethereum. LTC price started a recovery wave above the $78.00 and $80.00 resistance levels.

It even cleared the 50% Fib retracement level of the downward move from the $88.49 swing high to the $74.59 low. The bulls even pumped the price above $82.00, but the bears were active near the 100 simple moving average (4 hours).

There is also a key bearish trend line forming with resistance at $83.00 on the 4-hour chart of the LTC/USD pair. Litecoin is now trading below $85 and the 100 simple moving average (4 hours).

On the upside, immediate resistance is near the $83.00 zone or the 61.8% Fib retracement level of the downward move from the $88.49 swing high to the $74.59 low. The next major resistance is near the $84 level. If there is a clear break above the $84 resistance, the price could start another strong increase.

Litecoin Price Prediction

Source: LTCUSD on TradingView.com

In the stated case, the price is likely to continue higher toward the $88.50 and $90.00 levels. Any more gains might send LTC’s price toward the $95.00 resistance zone.

Are Dips Supported in LTC?

If Litecoin price fails to clear the $84 resistance level, there could be a downside correction. Initial support on the downside is near the $80.00 level.

The next major support is forming near the $77.80 level, below which there is a risk of a move toward the $75.00 support. Any further losses may perhaps send the price toward the $70.00 support.

Technical indicators:

4-hour MACD – The MACD is now gaining pace in the bullish zone.

4-hour RSI (Relative Strength Index) – The RSI for LTC/USD is above the 65 level.

Major Support Levels – $80.00 followed by $77.80.

Major Resistance Levels – $83.00 and $84.00.
Litecoin Price Prediction: LTC Rally Could Extend To $120

Litecoin price is up over 10% and trading above $105 against the US Dollar. LTC could continue to rise toward the $120 resistance zone in the near term.

  • Litecoin is showing positive signs from the $95 support zone against the US Dollar.
  • The price is now trading above $105 and the 100 simple moving average (4 hours).
  • There is a key bullish trend line forming with support at $101.50 on the 4-hour chart of the LTC/USD pair (data feed from Kraken).
  • The price could continue to rise toward the $120 level unless it breaks the $100 support.

Litecoin Price Gains Bullish Momentum

In the past couple of days, Litecoin gained pace and outperformed Bitcoin and Ethereum. LTC price formed a base above the $80 level and started a decent increase.

There was a break above the $88 and $95 resistance levels. The bulls even pushed the price above $100. There was a clear move above the 76.4% Fib retracement level of the downward move from the $105.71 swing high to the $77.00 low. A new multi-week high was formed at $112.49 and the price is now consolidating gains.

top near $68.40 before it started a fresh decline.

Litecoin is now trading above $10 and the 100 simple moving average (4 hours). There is also a key bullish trend line forming with support at $101.50 on the 4-hour chart of the LTC/USD pair.

On the upside, immediate resistance is near the $112.50 zone. It is near the 1.236 Fib extension level of the downward move from the $105.71 swing high to the $77.00 low. The next major resistance is near the $115 level. If there is a clear break above the $115 resistance, the price could start another strong increase.

Litecoin Price Prediction

Source: LTCUSD on TradingView.com

In the stated case, the price is likely to continue higher toward the $120 and $122 levels. Any more gains might send LTC’s price toward the $132 resistance zone.

Are Dips Supported in LTC?

If Litecoin price fails to clear the $105 resistance level, there could be a downside correction. Initial support on the downside is near the $105 level.

The next major support is forming near the $100 level, below which there is a risk of a move toward the $95 support. Any further losses may perhaps send the price toward the $88 support.

Technical indicators:

4-hour MACD – The MACD is now gaining pace in the bullish zone.

4-hour RSI (Relative Strength Index) – The RSI for LTC/USD is above the 65 level.

Major Support Levels – $105 followed by $100.

Major Resistance Levels – $115 and $120.

Litecoin Whale Deposits Big To Binance, LTC’s 3% Drop To Extend?

On-chain data shows a Litecoin whale has made a large deposit to cryptocurrency exchange Binance, which could add to the coin’s decline.

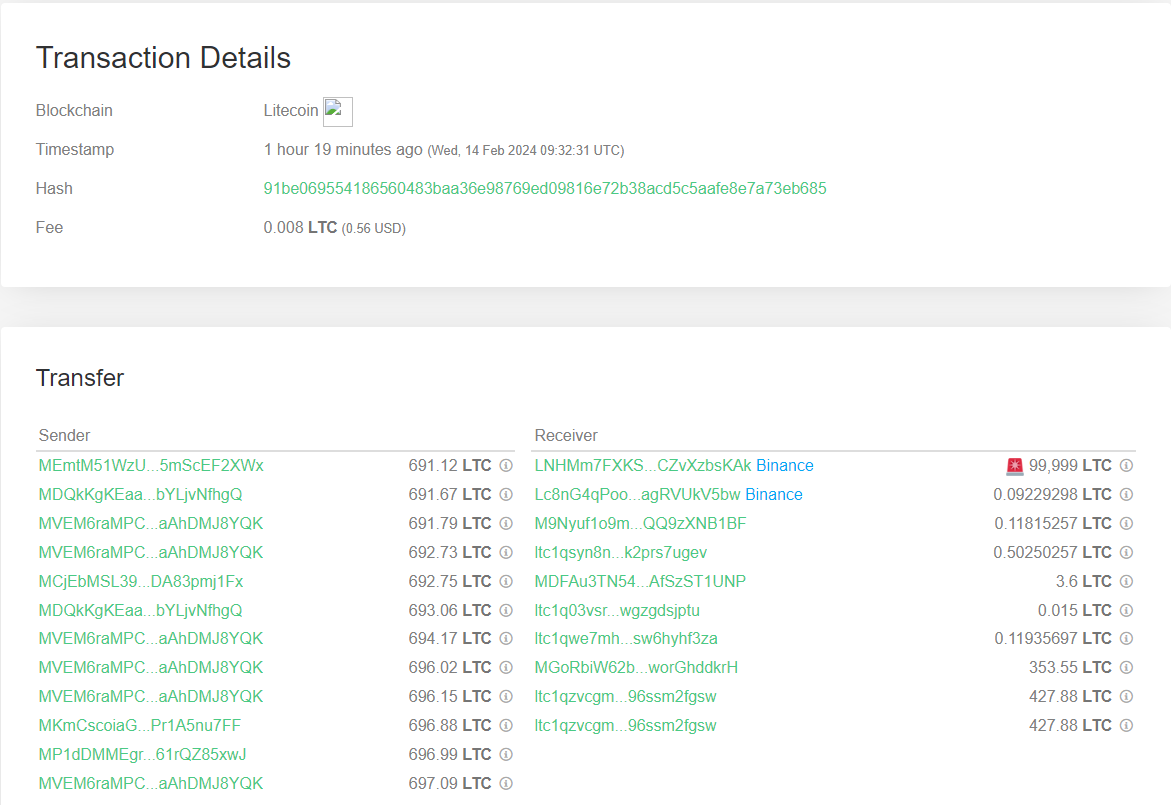
Litecoin Whale Has Transferred 100,000 LTC To Binance Today

According to data from the cryptocurrency transaction tracker service Whale Alert, a large transfer has been spotted on the Litecoin network during the past day.

This transaction involved the movement of 100,000 LTC across the blockchain, worth more than 7 million US Dollars at the time of the move. Since the transfer scale is so large, a whale entity was likely behind it.

Generally, the transfers of whales can be something worth watching out for, as they may end up causing ripples in the market. How a move from such a humongous holder would affect the asset, though, depends on the intent behind it.

Here are some additional details regarding the latest Litecoin whale transfer that may provide a hint about why the investor made the move:

Litecoin Whale

As displayed above, the whale transferred 100,000 LTC to wallets associated with the cryptocurrency exchange Binance in this move. The sending addresses were all unknown wallets that were unattached to any centralized platforms.

Such wallets are usually the investors’ addresses. Transactions like this, where coins move from self-custodial wallets towards exchanges, are called “exchange inflows.”

The latest exchange inflow from the Whale suggests that the investor wanted to use one of the platform’s services, which can include selling. As such, the transfer can be bad news for Litecoin.

LTC Has Gone Down 3% In Past 24 Hours Despite Market Surge

While most cryptocurrency sectors have enjoyed profits during the last day, Litecoin has been the odd one as it has registered negative returns.

As the chart below displays, LTC plunged from above the $73 level to the $68 mark during its latest drop.

Litecoin Price Chart

Litecoin has registered a bit of a rebound since its low, though, as it has returned above $70. Despite this increase, however, the coin has still been down around 3% in the past 24 hours.

Given the timing of the Binance inflow transaction made by the whale, it’s possible the move was for selling after all, as it coincided with this rebound in the cryptocurrency.

The whale may be using this small surge to exit from the asset, potentially for moving into the greener pastures the rest of the market seems to be providing.

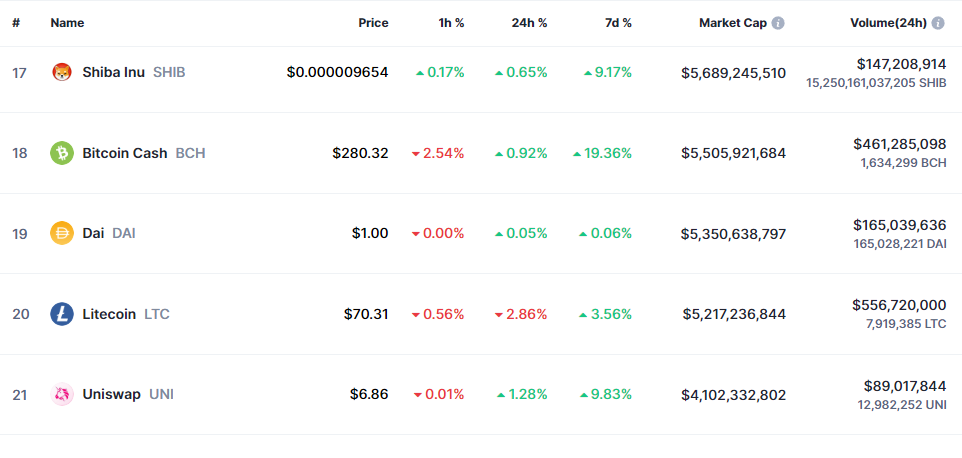
Regarding the market cap, Litecoin has fallen to just the 20th spot on the top cryptocurrencies list, meaning there are nineteen larger digital assets than it currently. There is still some gap between LTC and 21st-placed Uniswap (UNI), so the coin may not be at risk of slipping further, at least for now.

Litecoin Market Cap

Litecoin Bear Flag Could Cause 41% Crash To This Level, Analyst Explains

An analyst has explained that a bear flag is potentially forming for Litecoin, which, if confirmed, might cause a decline for LTC to this level.

Litecoin Could Be In Danger Of Deep Decline Due To This Bear Flag

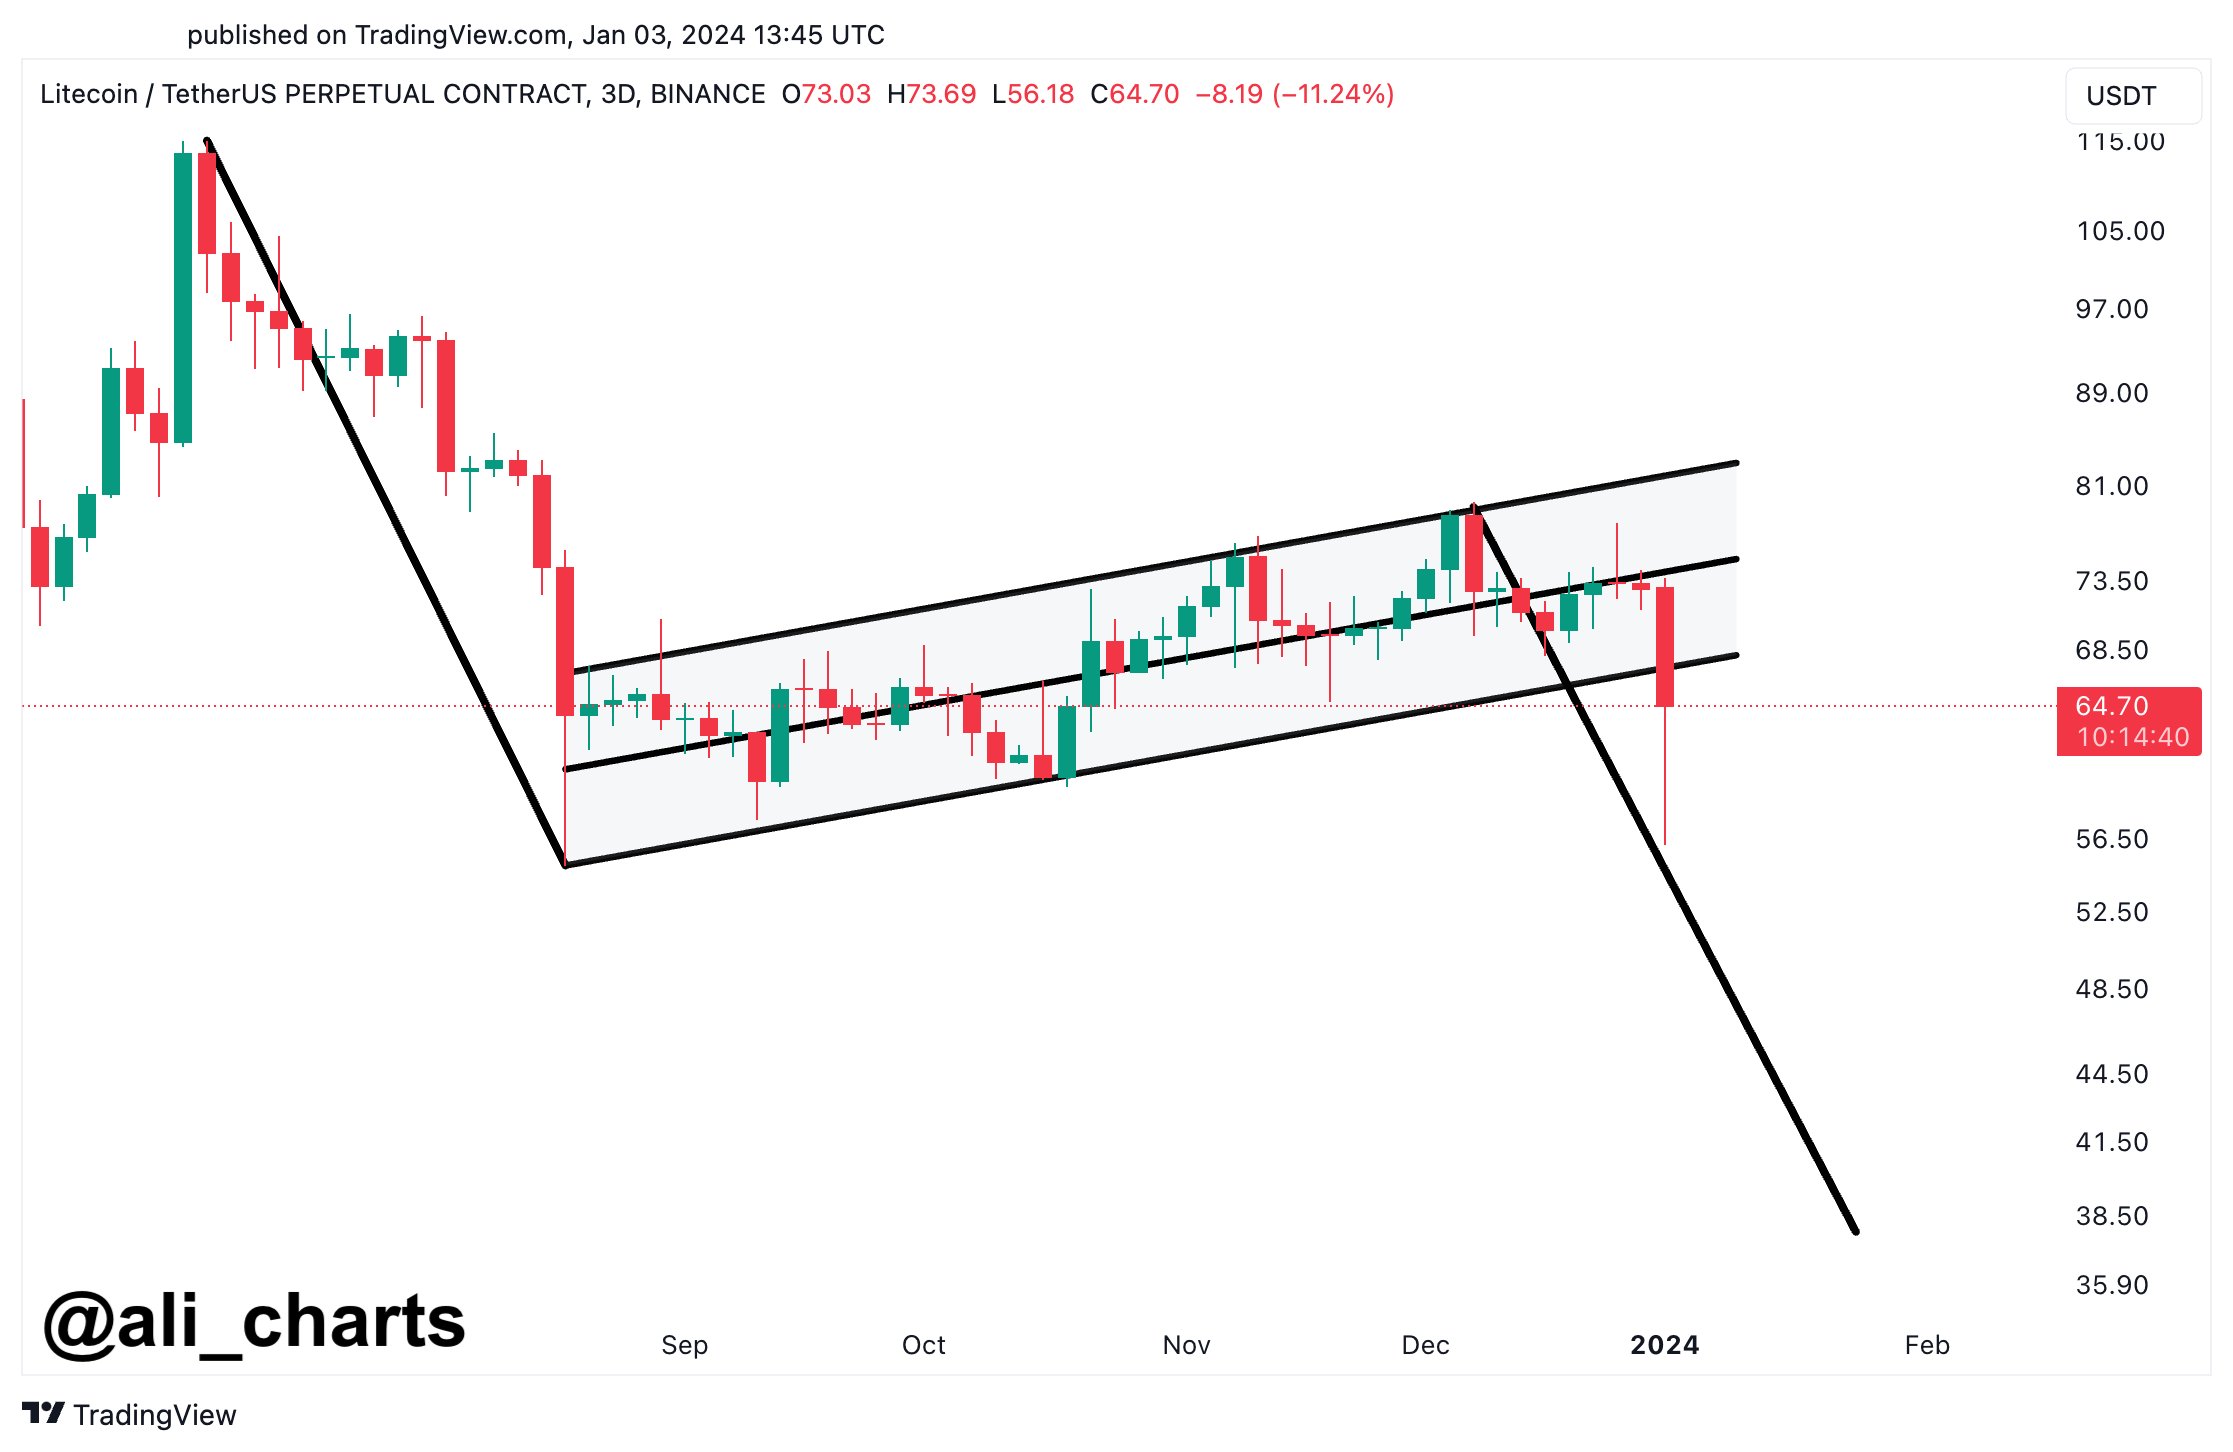
In a post on X, analyst Ali has pointed out a possible bear flag taking form for Litecoin. A “bear flag” is a pattern in technical analysis that, as its name implies, looks like a flag on a pole.

The pattern takes shape when the asset observes a sharp downward move and follows it up with a period of consolidation. This consolidation happens toward a slight overall uptrend, meaning that its upper level is created by connecting higher highs, while the lower line joins together higher lows.

The downtrend prior to the consolidation makes up for the pole, while the channel looks like a flag. Inside the flag, the price is naturally likely to feel resistance at the upper level, while support is at the lower one.

The bear flag is popularly considered a continuation pattern, meaning that the downtrend would continue after the pattern forms. This continuation happens as the price finally ends its consolidation and crashes through the lower level of the flag.

Like the bear flag, there is also the “bull flag,” which forms in the opposite circumstances. In the case of this pattern, the price breaks out with a sharp upward move after the consolidation period toward the downside finishes.

Now, here is the chart shared by the analyst that sheds light on a possible bear flag forming in the 3-day price of Litecoin:

Litecoin Bear Flag

From the graph, it’s visible that Litecoin’s 3-day price has possibly been consolidating inside a bear flag during the last few months. With the latest crash in the asset, though, the price appears to finally be breaking out of the pattern towards the down direction.

This plunge in the coin has occurred as the rest of the cryptocurrency sector has also reverberated with a crash. Unlike many other assets, however, LTC never enjoyed any sharp rally to kickstart the year, so the plummet has been especially damaging for it.

“Post-recent dip, the outlook for Litecoin appears challenging,” notes Ali. “If the selling pressure continues, LTC might see a push down to $38, potentially confirming a bear flag formation.”

Generally, breakouts from any flag pattern are of about the same length as the preceding pole, which is why the analyst has selected this target. If Litecoin’s potential drawdown does play out in this fashion, then the asset would have seen a decrease of more than 41% from the current price levels.

LTC Price

Litecoin had been floating above the $73 mark just earlier, but following this 11% crash, the coin is now down to just $65.

Litecoin Price Chart

Trading Guru John Bollinger Warns Of Buying Litecoin, Here’s Why

In his latest analysis, legendary trader John Bollinger has expressed concerns over Litecoin’s performance, particularly in comparison to Bitcoin. Bollinger, known for developing the popular technical analysis tool Bollinger Bands, highlighted a worrying pattern in the Litecoin market.

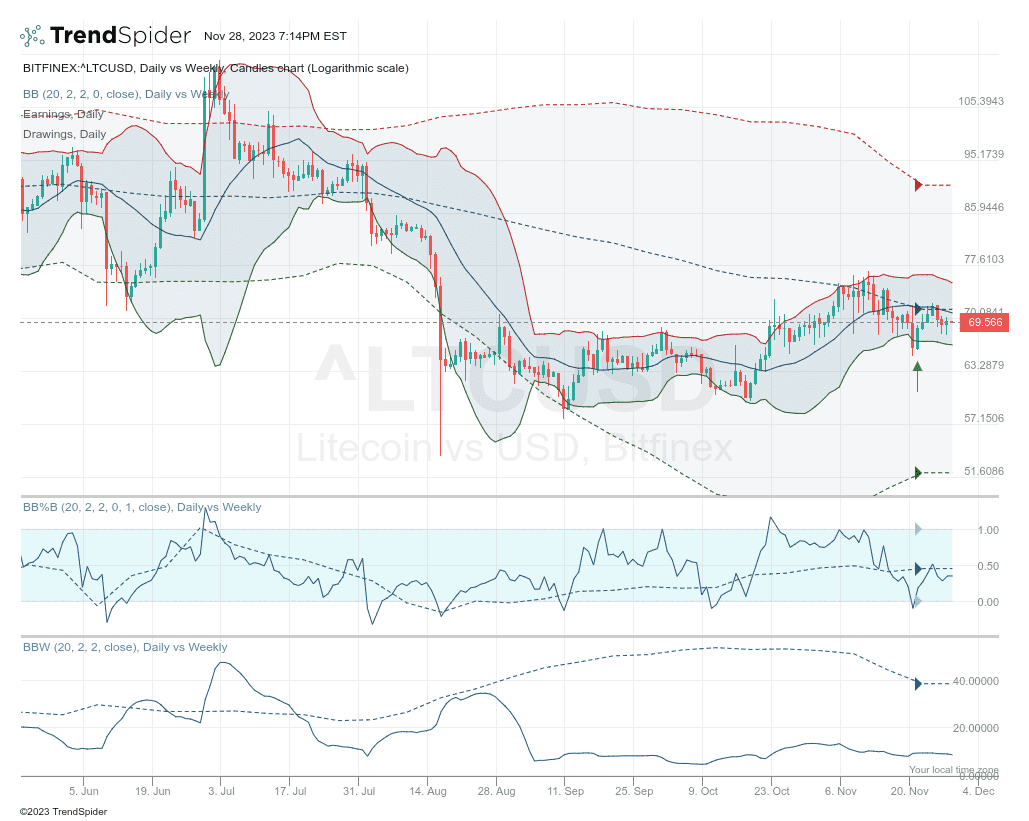
He remarked, “I was asked for an analysis of LTCBTC. The thing that concerns me the most is its underperformance vs Bitcoin. From a price perspective the controlling LTCUSD feature is the 2 bar reversal at the lower Bollinger Band which is typically considered a bearish signal by traders.”

Litecoin price analysis by John Bollinger

Bollinger’s Bearish Litecoin Prediction Explained

The chart of the LTC/USD pair provided by Bollinger on November 28, 2023, shows Litecoin’s price action in relation to its Bollinger Bands on both a daily and weekly scale. The price is currently hovering around $69.566, which is significantly lower than the upper Bollinger Band, suggesting a lack of bullish momentum.

The Bands form by plotting a range of standard deviations above and below a simple moving average, commonly enveloping the price action. In this chart, the daily vs. weekly candles chart shows that the LTC/USD price is struggling beneath the midpoint of these bands, which is a bearish indication. The price currently near $69.566 is substantially below the upper band level of around $90, which represents a potential resistance level.

The Bollinger Bands (BB) on the chart are set with a 20-period moving average with a 2 standard deviation range. Bollinger’s analysis points to a ‘2 bar reversal’ pattern at the lower band. This pattern emerges when a bar reaches a high above the preceding bar but then closes below the close of that same previous bar, hinting at a possible reversal from the uptrend. Such a pattern took place near the lower band, indicating that any effort to drive the price higher meets with resistance, and the prevailing selling pressure is taking hold.

The Bollinger %B indicator is also crucial here as it compares the price of Litecoin to the range defined by the Bollinger Bands. A %B value below 0.5 indicates that Litecoin’s price sits nearer to the lower band than to the upper band, potentially signaling weakness. The chart shows the indicator failing to cross the 0.5 level after a plunge toward 0, signifying that the price frequently touches or falls below the lower band.

LTC Price Under Pressure

The Bollinger Band Width (BBW) serves as another indicator, measuring volatility by assessing the Bollinger Bands’ width. A narrowing of the Bands, as seen in the latter part of the chart, suggests a decrease in volatility and often precedes a significant price movement. In this context, the BBW’s narrowing on the Litecoin chart might indicate that the market is tensing, possibly gearing up for an impending breakout or breakdown.

When Bollinger mentions Litecoin’s underperformance relative to Bitcoin, it’s important to note that Bitcoin often leads the crypto market trend. If Litecoin is not keeping up with Bitcoin’s movements, it could suggest a lack of confidence or interest from traders in altcoins (as the current rise in Bitcoin dominance shows) and Litecoin specifically.

In summary, Bollinger’s technical analysis indicates that Litecoin is in a precarious position. The price action at the lower Bollinger Band, the bearish ‘2 bar reversal’ pattern, the sub-0.5 Bollinger %B values, and the narrowing BBW all suggest that Litecoin may continue to see downward pressure in the near term.

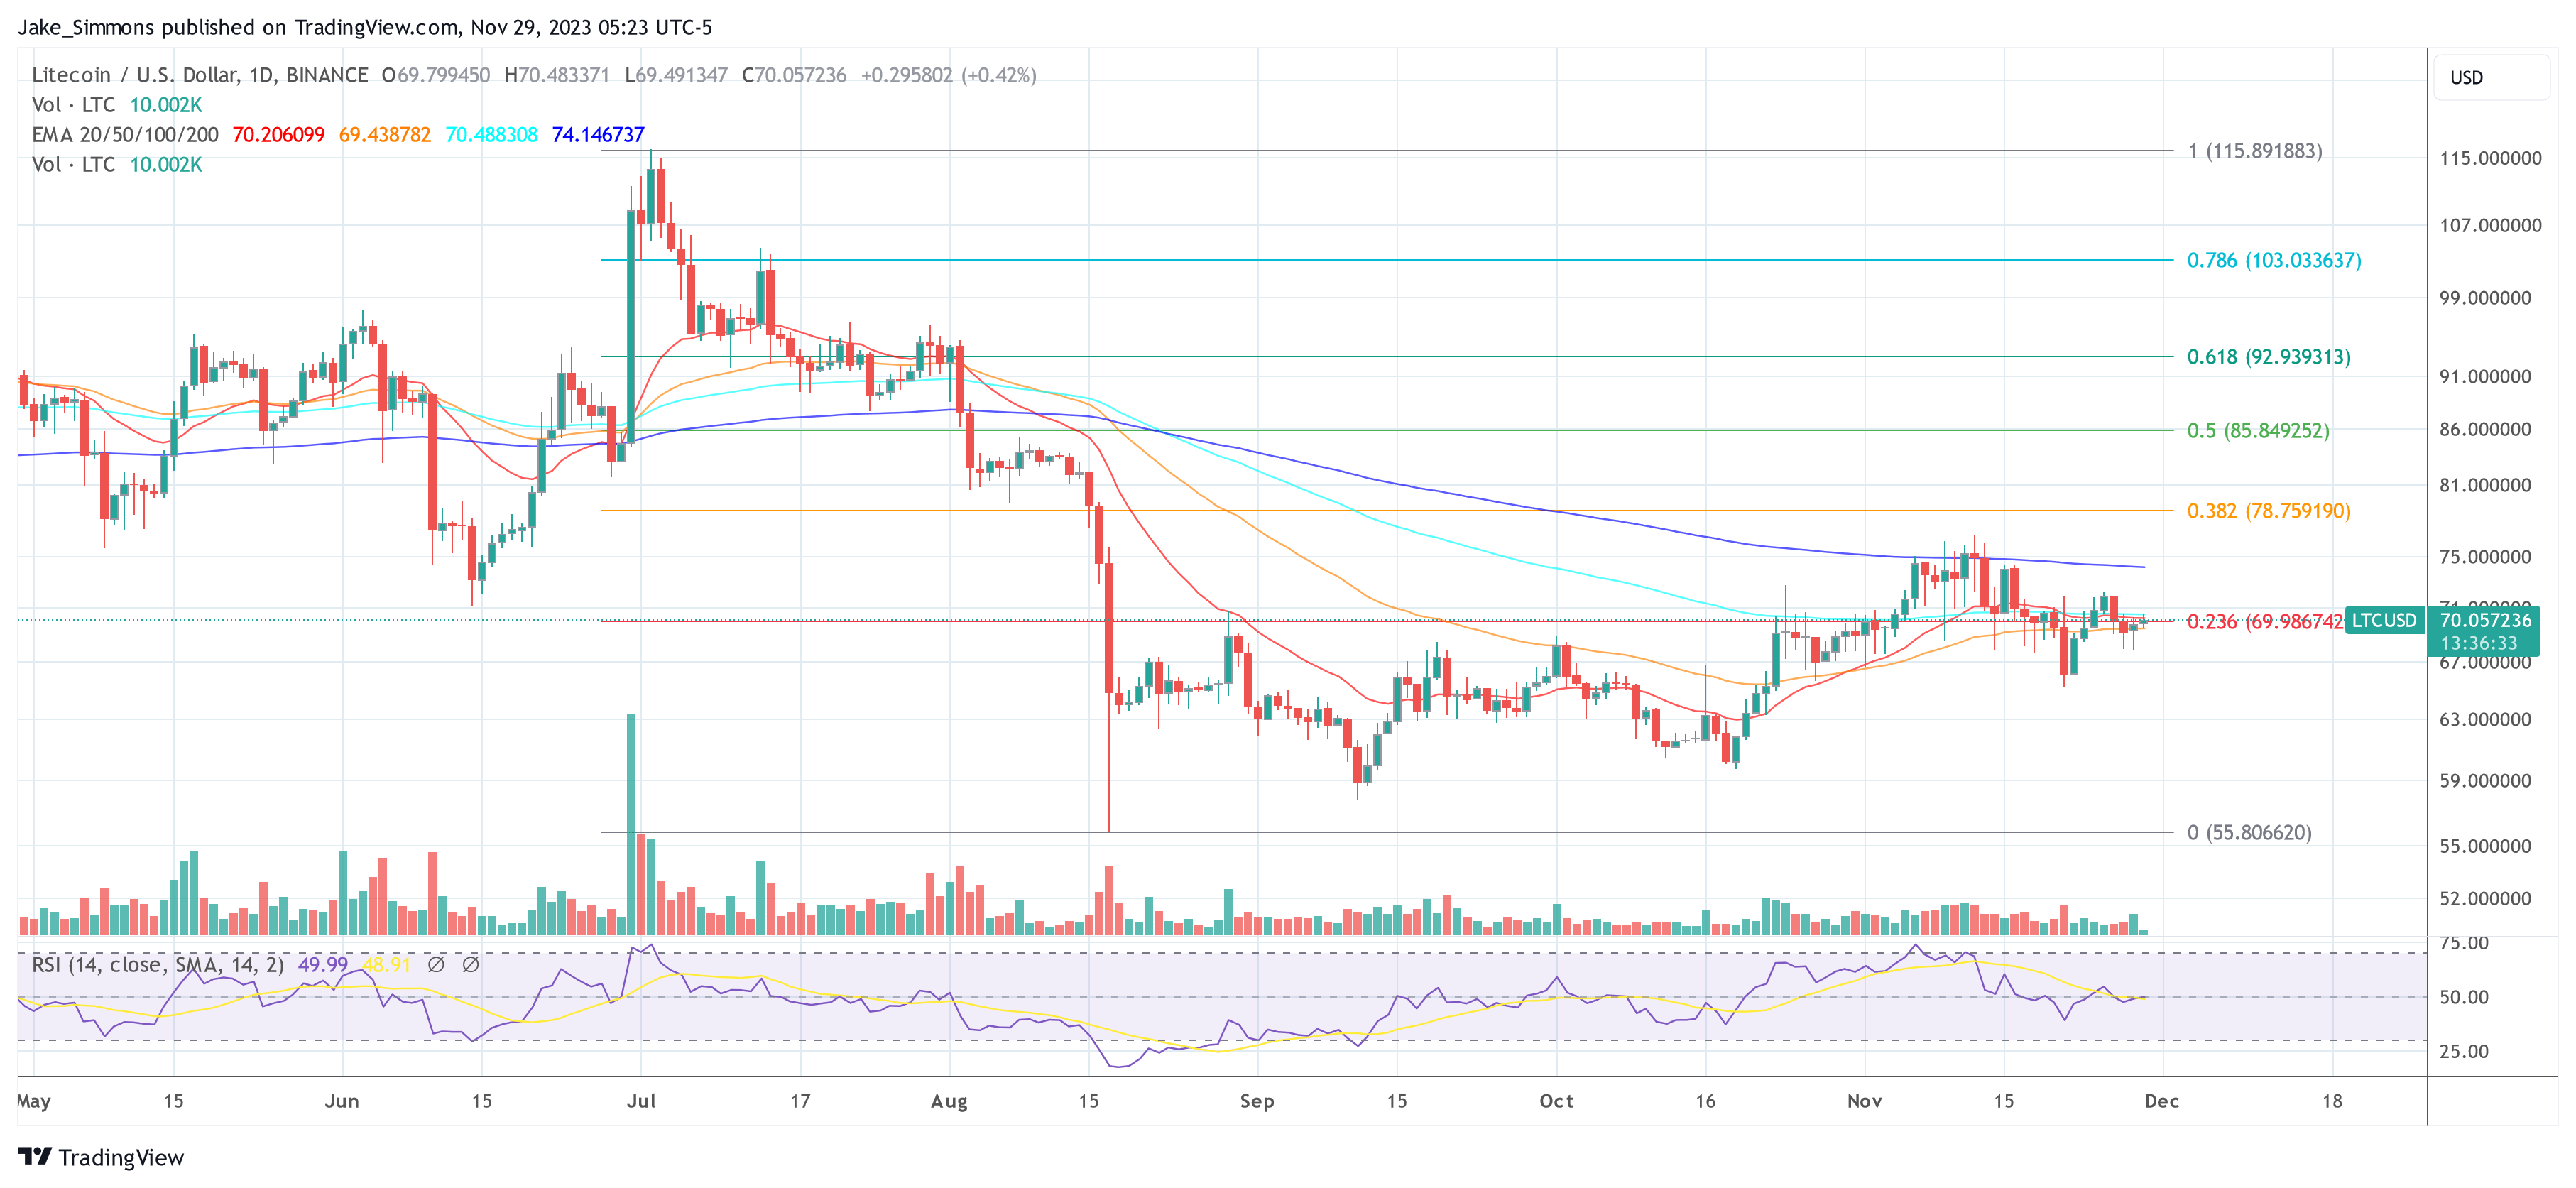
At press time, Litecoin traded at $70.05. The 1-day chart of LTC/USD shows that the altcoin fell below the key support of the 0.236 Fibonacci retracement level at $69.98 two days ago. A retest is currently taking place, a daily close above this is of utmost importance for the Litecoin price.

Litecoin price

Litecoin Whales Are Back In The Game, Can Price Reach $100?

Litecoin (LTC) whales are making their way back into the market once more as the bull market establishes itself. A number of large transactions have been flagged which suggests that these millionaire accounts are coming out to play.

Litecoin On-Chain And Whale Activity Hit 4-Month High

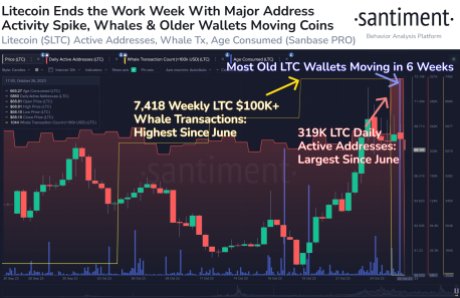
The Litecoin on-chain and whale activity has been on the rise recently, as reported by the on-chain analytics platform Santiment. In the report posted to X (formerly Twitter), Santiment revealed that there had been a big spike in the Litecoin on-chain activity.

The chart shared by the tracker showed the spike taking place in line with the price recovery, which would be the reason why investors are awakening once more. Santiment noted that this recovery in on-chain activity saw address activity on the blockchain, as well as whale activity reaching levels not seen since June, representing a 4-month high in this metric.

Litecoin whales

A total of 319,000 daily addresses were active on the network after this metric dropped drastically in the last few months Additionally, weekly whale transactions, that is transactions carrying more than $100,000 rose and touched a new 4-month high of 7,418.

These are not the only metrics that saw a spike as the dormant LTC address started seeing movement again. These addresses which had previously not seen movement for a while began to move coins around, adding to the current number of coins in circulation.

LTC Ready For A Shoot To $100?

The revival of on-chain activity for Litecoin is a welcome development for the network but it is not exactly bullish. The reason for this is how the LTC price has reacted since this activity commenced, which is not very encouraging.

As the dormant LTC started to move once more, the price began to decline. This suggests that this subset of holders may be selling their coins after holding and waiting for better prices. In this case, the selling pressure has outweighed the demand for the coin.

A continuation of this will likely see the price continue to fall further, and a recovery to $100 is still far off on the horizon. So this recent bout of activity may just be investors choosing to sell rather than coming back to participate in buying.

The LTC price already fell from its $69 level on Thursday to as low as $67 on Friday before mounting a small recovery. Presently, the Litecoin price is sitting at $67.8, representing a 2.14% decrease in the last day.

Litecoin price chart from Tradingview.com

Litecoin At 12: How Has Its 84 Million Supply Been Distributed Over Time?

Much has changed since Litecoin launched in 2011 with a maximum supply of 84 million LTC as a silver to Bitcoin’s gold. The crypto recently completed its third halving in August, finally reducing the number of LTC miners receive as a reward for mining a block from 12.5 LTC to 6.25 LTC. 

Over the past 12 years, much of this supply has been distributed to miners as block rewards for verifying Litecoin transactions. At the time of writing, there are 73.76 million LTC in circulation, with data showing this supply concentrated among large holders. 

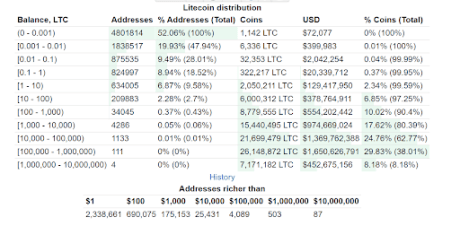
Estimates from the crypto analysis platform IntoTheBlock show that over 49% of LTC is held by accounts with more than 0.1% of the circulating supply. BitInfoCharts also puts addresses with more than 100,000 LTC having 38.01% of the total supply.

Litecoin addresses

Source: IntoTheBlock

Who Are the Biggest Litecoin Wallet Holders Today?

Litecoin’s 84 million total supply has been distributed over the past 12 years through mining rewards and market trading. The biggest wallet addresses include large miners that have accumulated Litecoin from years of mining and crypto exchanges. Charlie Lee, its creator, claims to have sold or donated all LTC tokens in his collection.

The honor of the biggest Litecoin wallet address belongs to “M8T1B”, accounting for 3.34% of the entire supply in circulation. This wallet holds 2,504,667 LTC worth $158,105,141 at the current market price. 

Next is “ltc1qr” holding 2,225,000 LTC worth $140,451,374. Wallet addresses “MQd1f” and “ltc1qn” comes third and fourth in rankings, holding 1,344,464 LTC and 1,097,050 LTC worth $84,868,217 and $69,250,423 respectively. According to data from BitInfoCharts, these top four addresses hold 8.18% of the total coins in circulation.Litecoin 2

Other top-ranking whales include addresses “ltc1q2” and “MQSs1,” with 927,542 LTC ($58,550,373) and 745,000 LTC ($47,027,540), respectively. Looking through the data shows these six addresses are the Litecoin blockchain whales holding more than 1% of the circulating supply. Metrics from IntoTheBlock put the total concentration of these whales at 11.88% (8.84 million LTC).

Wallets “MB8nnF”, “MFULdM,” “MESruS,” and “LZEjck” complete the top 10 rankings with 513,259 LTC, 472,674 LTC, 416,688 LTC, and 394,044 LTC, respectively. 

What Does Litecoin’s Supply Distribution Mean for the Future?

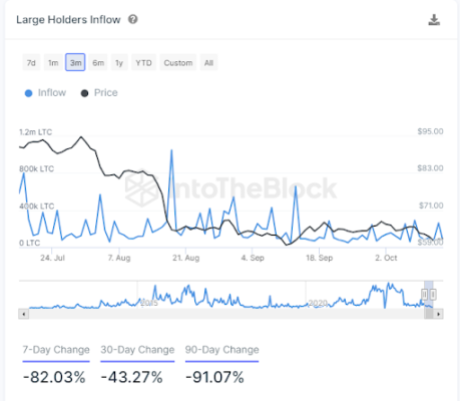
There seems to be a dull market movement with the whales as sellers continue to maintain control over the market. As a result, the inflow to wallets holding at least 0.1% of the circulating supply has decreased by 91.07% in the past three months.

Litecoin whales

Source: IntoTheBlock

With 87% of LTC already mined, the rate of new supply will slow down over time. This could support price stability and sustainability. Litecoin is currently trading at $63.07, and like all cryptocurrencies, and pseudonymous crypto analyst P_S_trade predicts Litecoin can push up to $84 very soon. 

According to historical data compiled by crypto analyst Tony “The Bull”, Litecoin has always retraced 70% in the weeks following its past halvings. However, the recently concluded halving event may present a different narrative.

Litecoin is currently trading in a range since last week and is seeking to extend its gains of 2.35% over the past 24 hours. 

Litecoin price chart from Tradingview.com

Crypto Analyst Puts Litecoin Price At $84, Here’s The Timeline

Since its third halving event was successfully completed in early August, the Litecoin price has fallen off the radar of crypto investors. This was mainly due to the price decline that LTC experienced after heavy profit-taking from investors who had invested leading up to the price surge triggered by the expectations around the halving. But it seems the tides are finally turning for the coin as one analyst predicts a more than 30% increase in price going forward.

Litecoin Price Shooting For The Stars

The current crypto market headwinds seem to be working in favor of the Litecoin price which one crypto analyst believes is gearing up for a run-up to $83. In the post, the pseudonymous analyst identified as P_S_trade points to the possibility of the crypto market continuing its growth trend. However, this would be null and void if the crypto market were to reverse back below $27,000.

For Litecoin, the analyst points out that the altcoin has usually been the first to start to see an upside in the crypto market. But this has not been the case, as previously mentioned since high levels of profit-taking have affected the LTC price.

Litecoin price chart from Tradingview.com

Even from the current level, the analyst’s chart points toward a possible retracement from here back down to $55. However, once this is completed, the bounce-off from there shows LTC reaching as high as $77 before succumbing to another correction.

This decline is also similar to the first instance where it falls to $55 in the fact that it signals another price surge. Following this second correction, the analyst puts the bottom somewhere around $67 before Litecoin continues its ascent once more.

The top of this second rally then lands just above $84 on the chart. Although there is no official timeline, the range of trades mentioned by the analyst is the medium term, which could see this run out for a couple of months.

Litecoin price chart from Tradingview.com (LTC prediction crypto analyst)

LTC Daily Transactions Continue To Decline

While the analyst foresees Litecoin price to surge, other metrics could be pointing in the opposite direction. For one, the daily transaction numbers for the altcoin have been steadily on the decline since the halving event in August.

According to data from BitInfoCharts, the number of daily LTC transactions has fallen from over 584,000 in May to just shy of 104,000 transactions by Tuesday, October 10. This points to a lack of interest from investors usually brought on by bear market headwinds.

Additionally, the daily transaction volumes, as shown by the token tracking website CoinMarketCap, show a 13.26% decline in the daily trading volume of Litecoin. These bearish metrics could thwart chances of reversal. However, they could also signal the bottom that triggers the start of another rally.

Litecoin Price Prediction: LTC Could Retest $60 Before Fresh Surge

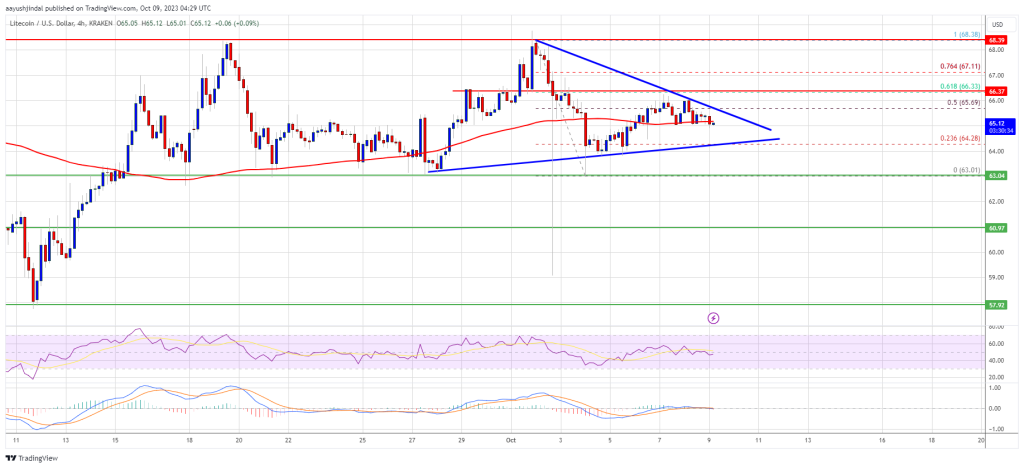
Litecoin price is struggling to gain pace above $66.40 against the US Dollar. LTC could revisit the $60 support before the bulls take a strong stand.

  • Litecoin is correcting losses from the $63 support zone against the US Dollar.
  • The price is now trading below $66 and the 100 simple moving average (4 hours).
  • There is a key contracting triangle forming with resistance near $65.50 on the 4-hour chart of the LTC/USD pair (data feed from Kraken).
  • The price could drop toward the $60 support before it starts a fresh increase.

Litecoin Price Signals Bearish Move

This past week, there was a fresh decline in Bitcoin, Ethereum, Litecoin, and other altcoins against the US Dollar. LTC price formed a top near $68.40 before it started a fresh decline.

The price traded below the $66.40 and $65.00 support levels. It retested the $63.00 support zone. A low was formed near $63.01 and the price is now attempting a fresh increase. There was a move above the $65.20 resistance.

The price spiked above the 50% Fib retracement level of the downward move from the $68.38 swing high to the $63.01 low. Litecoin is now trading below $66 and the 100 simple moving average (4 hours). There is also a key contracting triangle forming with resistance near $65.50 on the 4-hour chart of the LTC/USD pair.

On the upside, immediate resistance is near the $65.50 zone. The next major resistance is near the $6.40 level. It is close to the 61.8% Fib retracement level of the downward move from the $68.38 swing high to the $63.01 low. If there is a clear break above the $66.40 resistance, the price could start another strong increase.

Litecoin Price Prediction

Source: LTCUSD on TradingView.com

In the stated case, the price is likely to continue higher toward the $68.40 and $70 levels. Any more gains might send LTC’s price toward the $75 resistance zone.

Downside Thrust in LTC?

If Litecoin price fails to clear the $66.40 resistance level, there could be a fresh decline. Initial support on the downside is near the $63.00 level.

The next major support is forming near the $60 level, below which there is a risk of a move toward the $58.00 support. Any further losses may perhaps send the price toward the $55 support.

Technical indicators:

4-hour MACD – The MACD is now losing pace in the bullish zone.

4-hour RSI (Relative Strength Index) – The RSI for LTC/USD is still below the 50 level.

Major Support Levels – $63.00 followed by $60.00.

Major Resistance Levels – $66.40 and $68.40.

Litecoin Stuck In A Rut: Will Bullish Momentum Or Bearish Pressure Prevail?

Litecoin (LTC) has spent the past week trading within a tight price range, with its value hovering steadily around the mid-range point of $64. The price action for LTC in September has remained primarily bearish, with sellers maintaining control over the market. 

While LTC has a history of volatile price swings, recent times have seen it mirroring the sideways movement of the overall market, largely influenced by Bitcoin’s fluctuations, which rose from $25,000 to $27,000 before dropping to $26,000.

As of the latest data from CoinGecko, Litecoin is currently trading at $64.63, with a 24-hour gain of 0.7%. However, over the past seven days, LTC has experienced a decline of 2.9%, reflecting the prevailing bearish sentiment in the market, according to a recent price report.

Chasing Litecoin Bulls and Avoiding The Bears

For those looking for a bullish revival in Litecoin’s price,  a price report notes that the key level to watch is the 23.6% Fibonacci retracement level, which stands at $69. Breaking above this level could open the door for further gains, with potential targets lying at $78 and $80.

On the other hand, if the flat trading volume persists, bears may exert further pressure, potentially leading to a drop in LTC’s price to the $60 mark.

Market speculators have not been particularly enthusiastic about Litecoin’s recent sideways movement. The Open Interest (OI) for LTC has continued to decline, with data from Coinalyze indicating a $9 million drop within the past 48 hours. This suggests that traders and investors are becoming increasingly cautious as they monitor the developments in the Litecoin market.

Litecoin’s Investment Appeal in Q3/Q4

Despite the recent lackluster performance, some analysts believe that Litecoin remains an attractive investment opportunity in the third and fourth quarters of this year. Litecoin’s established reputation, solid ecosystem, and upcoming halving events are factors that contribute to its appeal.

Halving events have historically had a positive impact on Litecoin’s price, reducing the rate at which new LTC coins are mined and potentially increasing scarcity.

Market participants are closely watching the 23.6% Fibonacci retracement level at $69 for signs of a bullish revival, while a continuation of flat trading volume could see LTC drop to $60.

Despite recent market concerns, Litecoin’s strong fundamentals and upcoming halving events make it an investment opportunity worth considering as we move into the later part of the year.

(This site’s content should not be construed as investment advice. Investing involves risk. When you invest, your capital is subject to risk).

Featured image from Invest Right

Litecoin Eliminates Pre-Halving Gains As Volume Drops, Is A Fall To $50 Coming?

In the months leading up to the Litecoin halving in August, the price of the blockchain’s native LTC token was continuously on the rise. This renewed interest in investors who rushed back into the token and eventually pushed its price above $100. That is until the actual halving event rolled around, turning it into a “buy the rumor, sell the news” scenario. Since then, it has been a downward spiral for the token and the pain may not be over.

Litecoin Volume Slumps Post-Halving

Litecoin volume since the halving was completed has been less than expected. While investors expected rising demand for the LTC token with the diminished supply rate, the opposite has been the case. Instead, the daily trading volume of the cryptocurrency continued to slump.

In the last day, the Litceoin daily trading volume fell another 23%. This brought its daily volume to $255 million, a significantly low figure compared to the $500 million daily volumes that the cryptocurrency was recording leading up to the halving.

Litecoin volume

Just like the trading volume, the price of LTC has also plunged significantly. From its pre-halving peak of $112, the altcoin has fallen over 50% to its current level just above $60. This means that the asset has lost all of its gains accumulated between June and July 2023, just one month after the halving was completed.

So rather than being a bullish event as initially expected, the halving has proven to be more bearish than most. It also did not help that it took place during the bear market and LTC has fallen rapidly alongside larger assets such as Bitcoin and Ethereum.

Litecoin price chart from Tradingview.com (Volume)

Will LTC Fall Continue To $50?

At the current rate, the forecast does not look too good for the LTC price. Litecoin has understandably seen a 3% increase in the past day as Bitcoin recovered above $26,000. But this does not look sustainable by its current metric.

The first indicator of this is that falling daily trading volume means that interest in the asset is waning. As investors move to other assets they believe provide better prospects, this will affect the LTC price and could trigger further downside from here. Add to this that the coin’s price is below its 50-day and 100-day moving averages and it spells a recipe for disaster.

If LTC bulls are unable to hold support above $60 and it falls once again as it did on September 11, then $50 becomes a very possible landing point. Such a decline would put it back at November 2022 levels and signal a prolonged bear trend for the digital asset.

At the time of writing, LTC price is still sitting above $62 but the tug-of-war for control between bulls and bears continues to rage on.

Litecoin Breaks Another Record: HODLers On Network Now Exceed 5 Million

On-chain data shows Litecoin has reached another milestone as the total number of HODLers on the network now exceeds five million.

Litecoin Long-Term Holders Have Continued To Rise In Number Recently

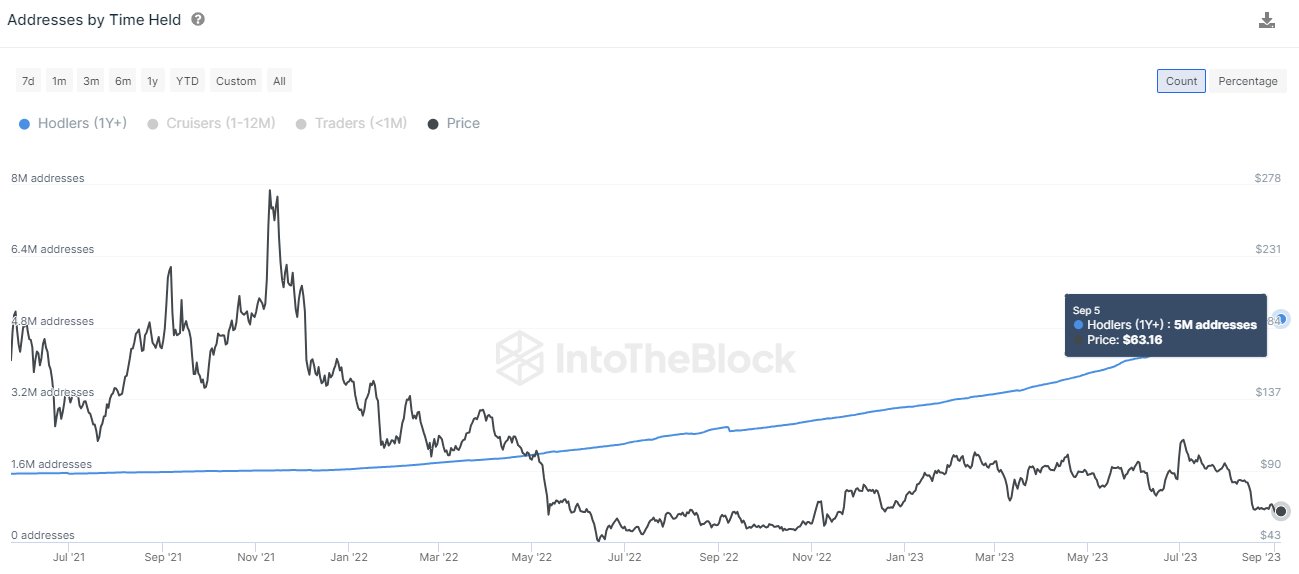
According to data from the market intelligence platform IntoTheBlock, LTC has seen its long-term holder count hit a new record this week. The firm defines “long-term holders” (LTHs) or HODLers as investors holding onto their coins since at least one year ago. Note that this cutoff for the LTHs differs from what some other analytics platforms use, usually around five to six months.

The chart below shows how the number of addresses owned by these LTH HODLers has changed over the past few years.

Litecoin HODLers

As displayed in the above graph, the Litecoin HODLer count has significantly increased during this period. Since the start of last year, in particular, the indicator has seen exponential growth.

Following this sharp rise, the number of addresses carrying coins since at least one year ago has now broken the five million mark, a new record for the cryptocurrency.

Interestingly, while the LTHs have grown in number during this period, the cryptocurrency price has mostly struggled. This shows that despite the poor price action, there has been growing confidence among a subset of holders who believe that the asset would be a profitable investment in the long term.

This is naturally a positive development for the cryptocurrency, as more LTHs mean more supply that’s locked inside the wallets of these resolute hands, which in turn implies a lesser possibility of selling occurring in the market.

LTC Price Has Continued To Struggle Recently

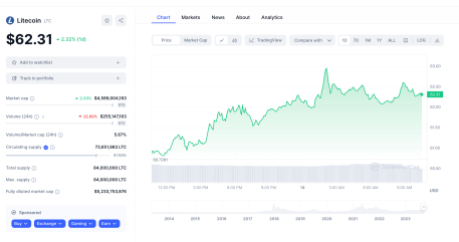
Since Litecoin finished its plunge in mid-August, its price has only moved sideways. When writing, the cryptocurrency is trading at around $63.

Litecoin Price Chart

While the Litecoin HODLers only going up in number through this slide since July is a constructive sign for the asset, it may not mean much in the short term.

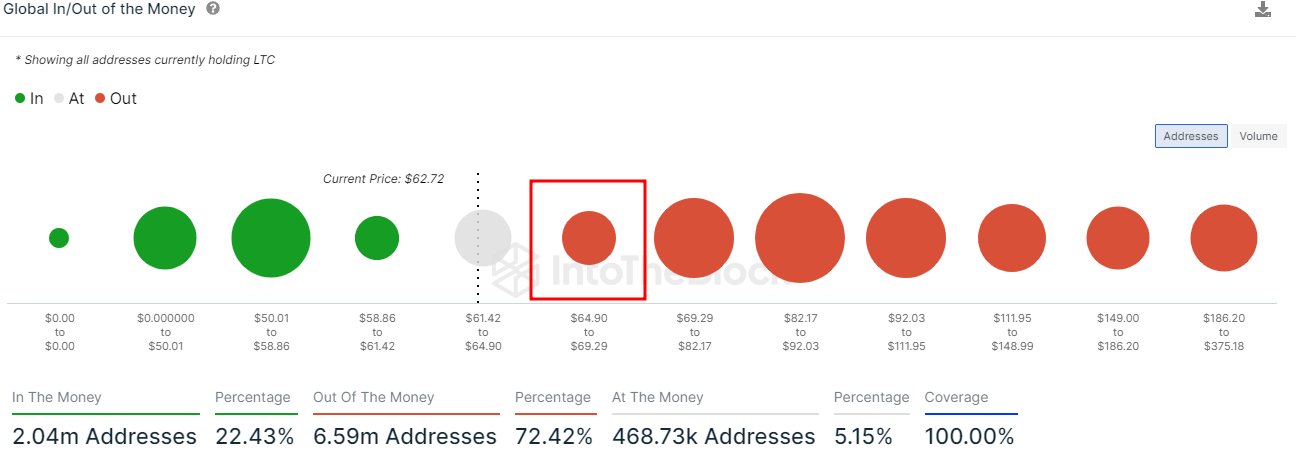
Where the LTC price could go next from here depends on several factors, one of which could be on-chain resistance and support levels. IntoTheBlock has shared the concentration of the investors at the different LTC cost basis price ranges.

Litecoin Profit/Loss

The “cost basis” here refers to the price at which the investors bought their coins. In the above data, the dot for the $64.9 to $69.29 range, for instance, represents the percentage of Litecoin investors who bought at prices lying inside this range.

Generally, when the price surges to cost basis levels with a high amount of investor concentration, there is a chance that the asset could feel some resistance. This is because these investors, previously in losses, come into the green with the surge, which may entice them to sell and exit the market.

The range ahead of the current one looks to be not that concentrated with holders, which may mean that Litecoin wouldn’t find too much resistance if a surge toward the $69 mark has to happen. However, there are notable percentages of holders in the following few price ranges, making a further surge difficult.

Litecoin Price Prediction: LTC Faces Uphill Task Near $70

Litecoin price declined heavily below $80 and $70 against the US Dollar. LTC is attempting a recovery wave but upsides might be limited above $70.

  • Litecoin is correcting losses from the $56 support zone against the US Dollar.
  • The price is now trading below $70 and the 100 simple moving average (4 hours).
  • There is a key bearish trend line forming with resistance near $66.00 on the 4-hour chart of the LTC/USD pair (data feed from Kraken).
  • The price could recover above $66 but the bears might remain active near $70.

Litecoin Price Starts Recovery

This past week, there was a sharp decline in Bitcoin, Ethereum, Litecoin, and other altcoins against the US Dollar. LTC price formed a top near $85 before it started a fresh decline.

There was a sharp decline below $80 and $70. The price even declined below $60. It traded as low as $55.78 and recently started an upside correction. There was a minor increase above the $60 resistance level. The price climbed above the 23.6% Fib retracement level of the downward move from the $85.39 swing high to the $55.78 low.

Litecoin is now trading below $70 and the 100 simple moving average (4 hours). There is also a key bearish trend line forming with resistance near $66.00 on the 4-hour chart of the LTC/USD pair.

On the upside, immediate resistance is near the $66 zone. The next major resistance is near the $70 level. It is close to the 50% Fib retracement level of the downward move from the $85.39 swing high to the $55.78 low. If there is a clear break above the $70 resistance, the price could start another strong increase.

Litecoin Price Prediction

Source: LTCUSD on TradingView.com

In the stated case, the price is likely to continue higher toward the $75 and $78 levels. Any more gains might send LTC’s price toward the $85 resistance zone.

Fresh Decline in LTC?

If Litecoin price fails to clear the $70 resistance level, there could be a fresh decline. Initial support on the downside is near the $63.50 level.

The next major support is forming near the $60 level, below which there is a risk of a move toward the $56.00 support. Any further losses may perhaps send the price toward the $52 support.

Technical indicators:

4-hour MACD – The MACD is now gaining pace in the bullish zone.

4-hour RSI (Relative Strength Index) – The RSI for LTC/USD is still below the 50 level.

Major Support Levels – $63.50 followed by $60.00.

Major Resistance Levels – $66.00 and $70.00.

Litecoin Long-Term Holders Smartly Exited Before Halving, Data Shows

Data shows that Litecoin long-term holders exited the asset before the halving, while short-term holders were left to panic on the halving day. The “halving” here refers to an event where the block rewards of Litecoin are permanently cut in half.

Litecoin Long-Term Holders Sold During Price Surge Before The Halving

According to data from the market intelligence platform IntoTheBlock, the long-term holders had been well-prepared for the “sell the news” halving event. The “long-term holders” (LTHs) generally include all investors who have been holding onto their coins since at least six months ago.

Related Reading: These Bitcoin Metrics Are At Important Retests, Will Bullish Trend Prevail?

This group includes some of the most resolute investors in the Litecoin market, who don’t easily react to whatever is going in on in the wider sector, as they usually hold through FUD or profit-taking opportunities without participating in any significant selling.

Because of how rare movements from these investors can be, the few times that they do sell can be the ones to watch out for, as they may spell trouble for the market.

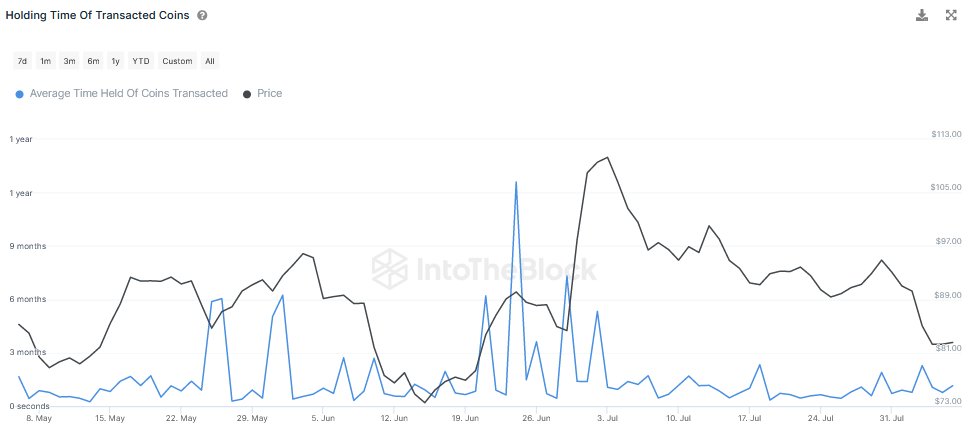
A way to gauge whether the LTHs are participating in selling or not is through the “holding time of transacted coins” metric, which tells us about the average amount of time that coins being transferred on the blockchain had been dormant prior to this movement.

When the value of this metric is high, it means that the age of coins being sold on the network is high, which can naturally be a sign that the LTHs are active right now. On the other hand, low values usually indicate that the short-term holders (STHs) are the ones selling currently.

Now, here is a chart that shows the trend in the Litecoin holding time of transacted coins over the past few months:

Litecoin Long-Term Holders

As you can see in the above graph, the Litecoin holding time of transacted coins spiked back in June, when the price of the cryptocurrency had been observing a sharp rally.

During the largest of these spikes, the indicator’s value had exceeded 1 year, implying that some of the most experienced investors in the market had broken their silence.

This rally had occurred as the market had started getting hyped about the halving, which was only a month and a half away at that point.

This event takes place every four years, with the latest one having occurred just earlier this month. Unlike what some may have hoped for, the event didn’t prove to be bullish for LTC, as the aforementioned rally didn’t last for too long and the cryptocurrency only declined in the remaining leadup to the halving, until finally it actually sharply plunged on the day of the event itself.

It would appear that the experienced LTHs had already predicted something like this may happen, so they had taken the wise decision of selling while the opportunity was there.

In the post-halving selloff, the indicator’s value has remained low, implying that it’s only the short-term holders who have been panic selling after they saw that a bullish trend couldn’t return to Litecoin with the event.

LTC Price

At the time of writing, Litecoin is trading around $84, down 8% in the last week.

Litecoin Price Chart

Litecoin Hashrate Taps New All-Time High, Will LTC Price Follow Suit?

The Litecoin hashrate has been going up steadily over the last year. This was mainly driven by the anticipation leading up to the Litecoin halving that was slated to take place in August. Now that the halving event has come and gone, the hashrate has risen to a new all-time high, but the question is, whether the price of LTC will follow suit.

Litecoin Hashrate Taps New ATH Of 1.03 PH/s

The steady rise in the Litecoin hashrate is a testament to the growing interest in the network. The hashrate points to the fact that there are more miners on the blockchain trying to guess the correct answers to each block. And this translates to better security overall for the Litecoin network.

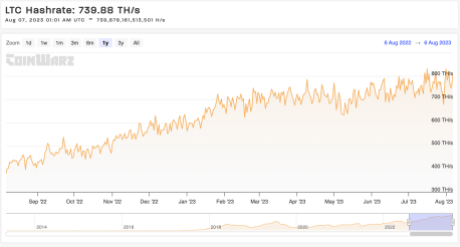
Interestingly, this increase in hashrate has seen the network hit not only a new all-time high but a significant milestone. According to data from CoinWarz, the Litecoin hashrate rose as high as 1.03 pentahashes per second (PH/s) on August 4.

This means that for the first time, LTC’s hashrate has left the terahashes per second (TH/s) territory and crossed into the pentahashes per second (PH/s) territory. Although it is still a long way from Bitcoin’s exahashes per second (EH/s), it is a testament to how much the Litecoin network has grown.

The Litecoin hashrate has since retraced back into the TH/s territory, now sitting at 739.88 TH/s as of Monday, August 7. But a look over the last year’s hashrate chart shows that even this is a high level for the blockchain’s hashrate.

Litecoin hashrate

Will LTC’s Price Follow The Hashrate?

Since the Litecoin hashrate hit its new all-time high, the price of LTC has been more volatile than normal. This is not out of the ordinary though as the altcoin has been following the general market trend and LTC’s is a testament to that trend.

So far though, it doesn’t seem like LTC has made any effort to break out of this trend. If anything, it has suffered more declines than recoveries, even dipping to as low as $$80.65 on August 4. This decline shows that the new hashrate ATH has not moved investors to invest more in the coin.

For now, something that could lead to an uptrend for Litecoin’s price is if Bitcoin begins another rally and the crypto market starts to see improved sentiment. Otherwise, LTC will likely continue to toe the $82 line for the better part of the week.

At the time of writing, LTC price is trading at $82.80, down 0.47% in the last day and 11.67% in the last week.

Litecoin (LTC) price chart from Tradingview.com

Litecoin Completes Halving, But Price Plunges 6%

Litecoin has completed its much-anticipated halving event today, but it seems the investors have reacted by participating in a selloff.

Litecoin Has Completed Its Third Halving, Block Rewards Now Down To 6.25 LTC

The “halving” event is where LTC’s block rewards are permanently cut in half. This event is periodic, occurring approximately every four years or roughly every 840,000 blocks miners hash.

Today’s halving was Litecoin’s third, meaning its block rewards have been cut three times since its genesis. In the first halving, the cryptocurrency saw its block rewards go from an initial 50 LTC to 25 LTC, and with the second, the tips dropped further to 12.5 LTC.

With the latest halving event, miners’ rewards for solving blocks have been cut down further to 6.25 LTC. The reason that halvings even exist is because they serve as a measure for controlling the asset’s inflation.

These block rewards that miners receive are the only way to introduce fresh tokens into the circulating supply, so cutting them down repeatedly makes sure that the cryptocurrency’s supply goes up slower and slower.

Eventually, when the halvings would keep on happening, the block rewards would approach zero. This would occur approximately in 2142. After this point, the asset’s supply will hit the maximum cap, and the miners will have to rely on transaction fees to pay off their running costs.

As halvings are important events, it’s natural that there has been a lot of discussion around this latest event as it has approached. During the start of July, the asset had observed a sharp rally towards the $114 mark, as the market had perhaps become hopeful for the halving, which was only one month away.

This rally, however, ran out of steam soon enough, and since then, LTC has struggled to put together any significant bullish momentum.

Litecoin Price Chart

Today’s halving hasn’t been able to change anything in this matter, either, as Litecoin has only plummeted further instead. It would appear that the event has indeed been a buy the rumor, sell the news type of scenario.

Following the latest plummet, Litecoin has gone below the $87 level and is down almost 7% during the past 24 hours. These high losses mean that LTC has been the poorest-performing coin out of the top cryptocurrencies by market cap in this period.

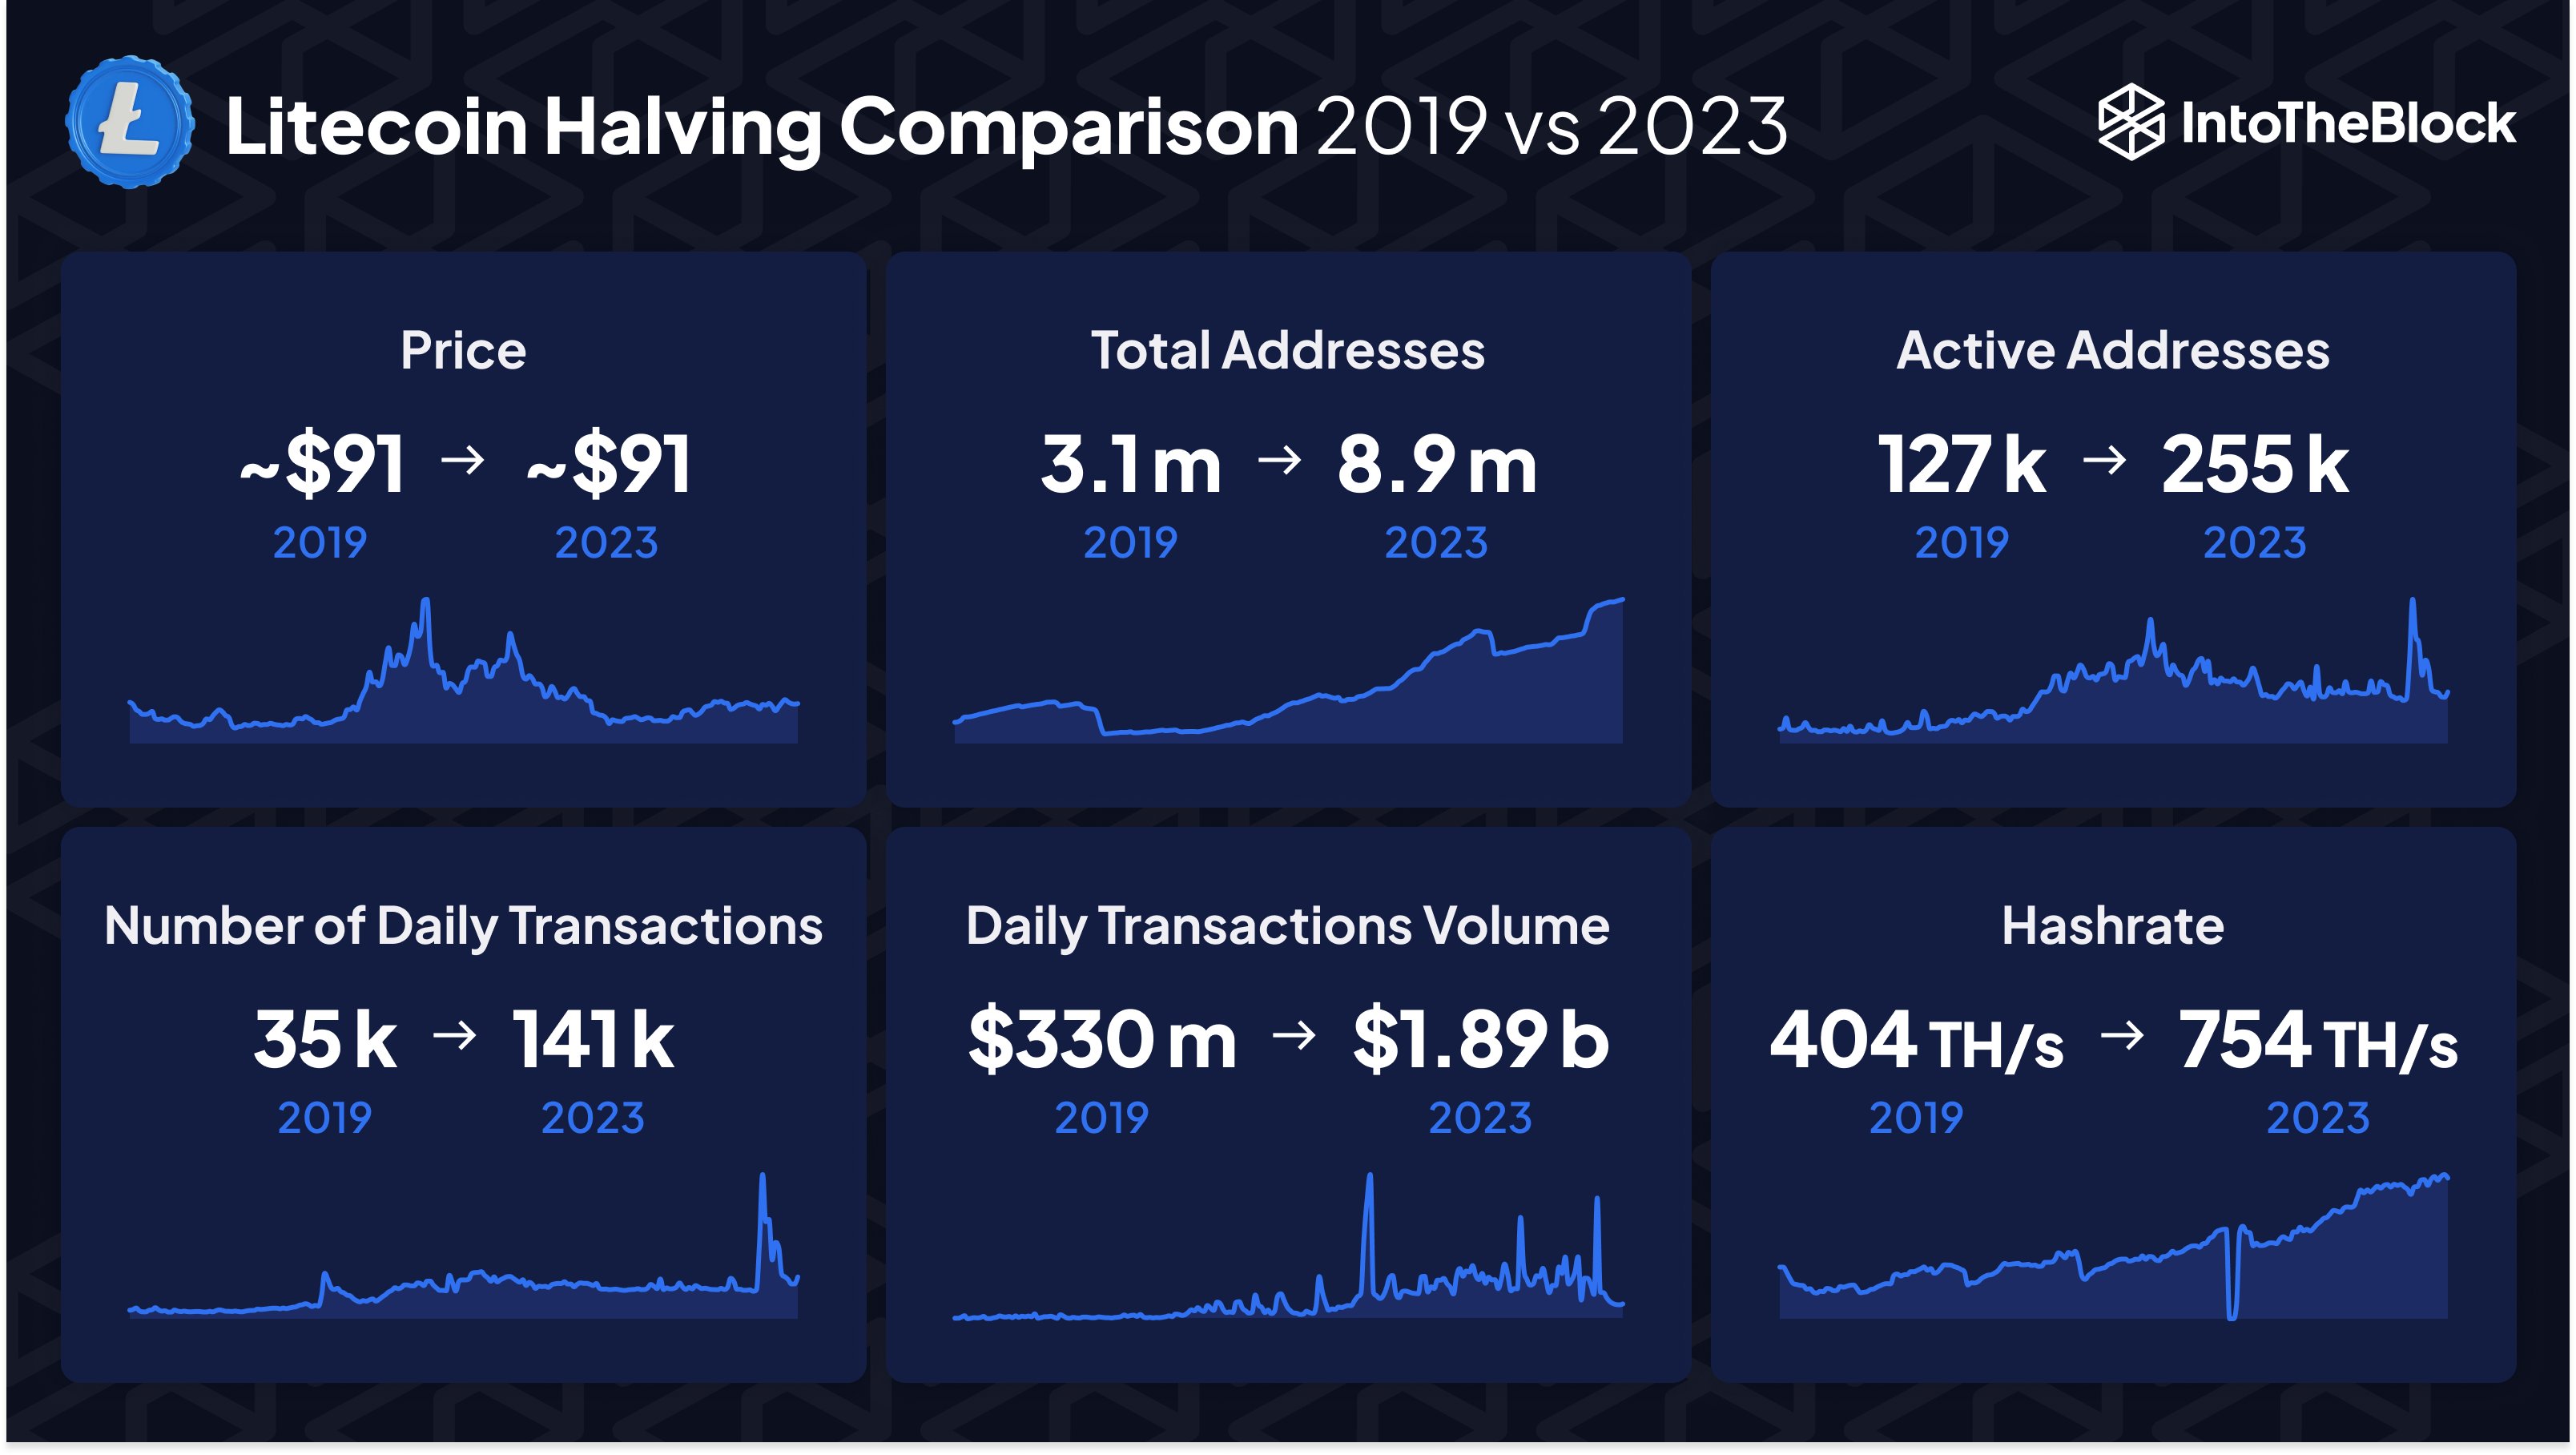
While the price performance of the asset might have been poor, LTC supporters may take solace in the fact that the asset has come forward a lot in terms of other network-related metrics since the previous halving, as data from IntoTheBlock shows:

Litecoin Comparison

Interestingly, the price at which both halvings happened was approximately the same. The cryptocurrency seems to have done well in terms of userbase and utility-related growth.

This impressive rise in adoption may be because Litecoin offers cheap and fast transactions compared to some other networks like Bitcoin. LTC investors can only hope, however, that this growth may also show up in the price.

Sell The News? Litecoin Traders Capitulate Ahead Of Today’s Halving

On-chain data shows that Litecoin traders are showing signs of capitulation as the asset’s much-anticipated halving event is only a few hours away now.

Is Litecoin Halving A Buy The Rumor, Sell The News Event?

The “halving” here refers to a periodic event where Litecoin’s block rewards (that is, rewards that miners receive for mining blocks) are permanently cut down in half.

This event takes place approximately every four years and the next one, which would be the third, is scheduled to happen in around five hours if data from the mining platform NiceHash is to go by.

Litecoin Halving

This third halving event will reduce the cryptocurrency’s block rewards from 12.5 LTC to 6.25 LTC. Historically, these events have been important for the asset, as they mark points where the cryptocurrency’s production rate (which is nothing but the block rewards, as miners releasing these coins is the only way to mint new LTC) shrinks, and hence, the coin becomes more scarce.

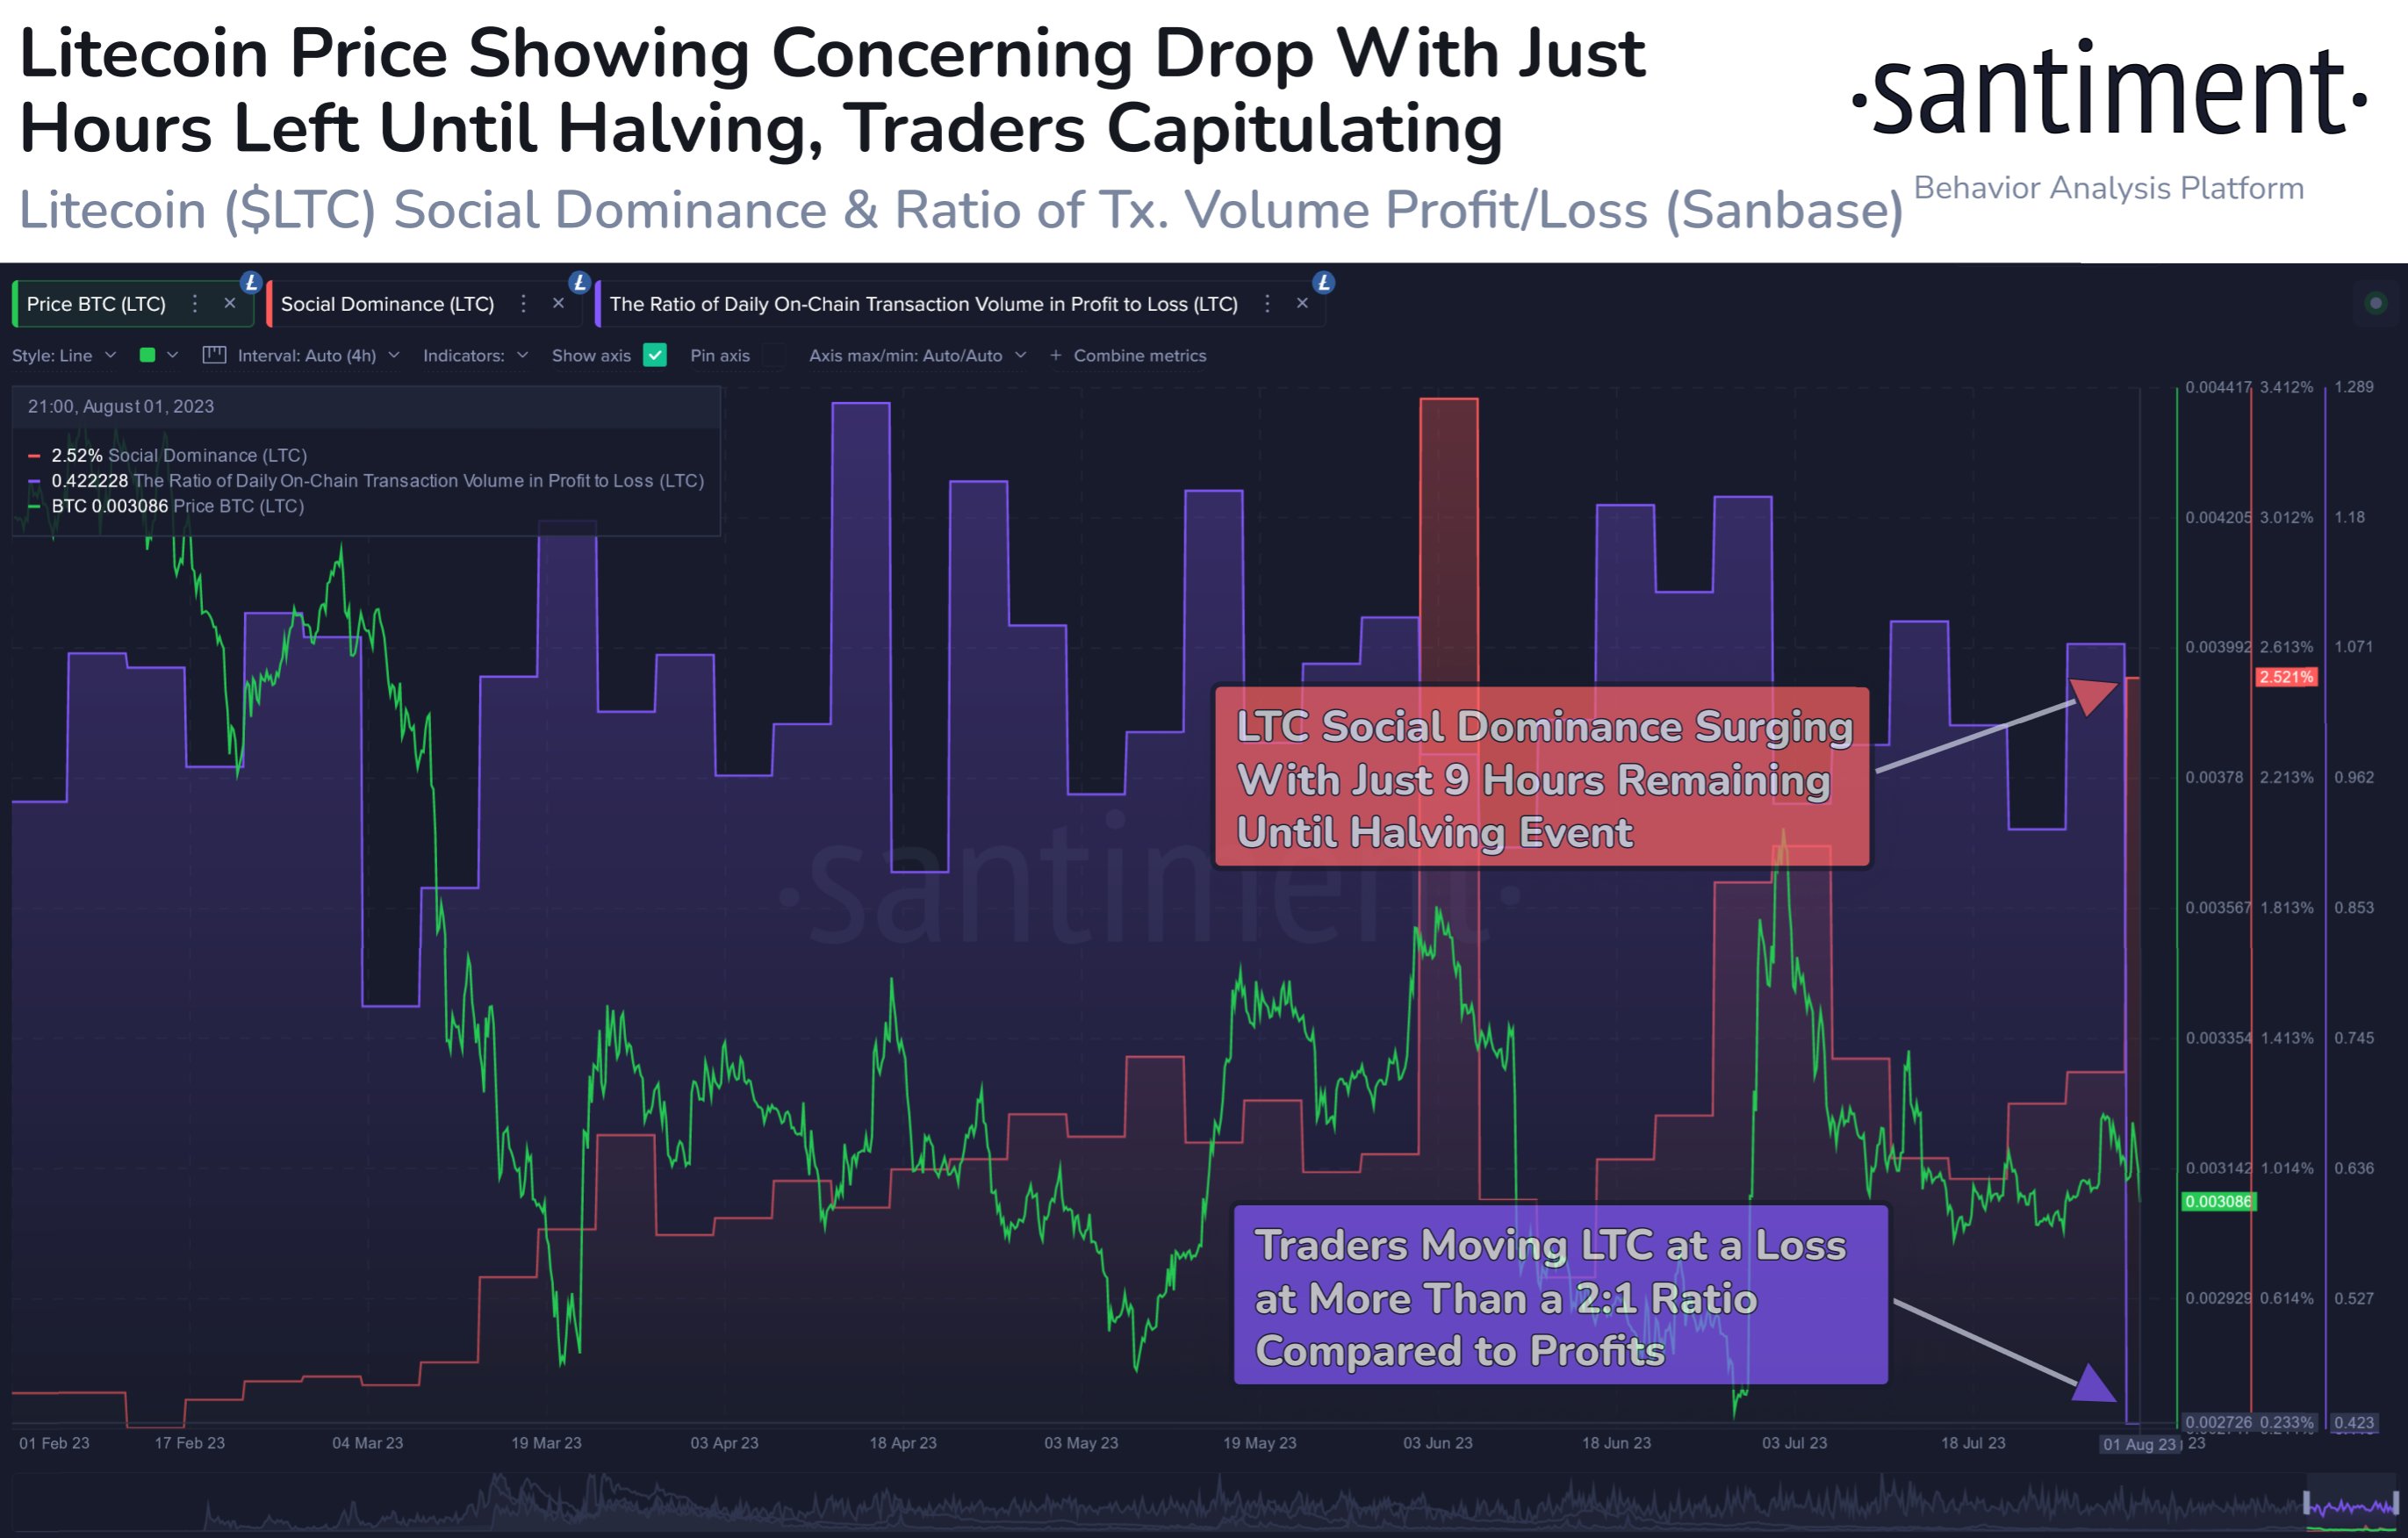
As these halving events are so significant, the market naturally speculates around them, leading to the coin experiencing volatility. In a new tweet, the on-chain analytics firm Santiment has revealed how the traders have been behaving in anticipation of today’s Litecoin halving.

Litecoin On-Chain Metrics

In the above graph, Santiment has attached the data of two metrics related to LTC: “social dominance” and the “ratio of on-chain transaction volume in profit to loss.”

The former of these tells us what percentage of discussion on social media related to the 100 largest assets in the cryptocurrency sector is coming from Litecoin alone.

From the chart, it’s visible that this indicator has observed a large spike today, showing that investors are participating in a large number of discussions related to today’s halving.

The other indicator keeps track of the ratio between the profit-taking and loss-taking volumes on the network. As displayed in the graph, this metric has taken a plunge below the 1 mark recently.

The ratio being less than 1 implies that loss-taking is the dominant force on the market at the moment. The loss volume is not only more than the profit volume right now, but it’s actually outweighing it at a ratio of more than 2:1.

This extraordinary loss-taking may be coming from the investors who purchased coins ahead of the halving believing it to be a bullish event, but as Litecoin has only gone down lower recently, the holders have panicked and are selling at losses in an attempt to avoid going further underwater. The high social dominance of the asset may also likewise be because of FUD-related discussions blowing up.

Based on these signs, it’s possible that Litecoin may be going through a classic “buy the rumor, sell the news” event.

LTC Price

At the time of writing, Litecoin is trading around $91, up 1% in the last week.

Litecoin Price Chart

Bullish Case For Litecoin Grows Stronger As LTC Halving Draws Close

Litecoin (LTC) is still trending low like the rest of the cryptocurrency market but one thing that separates the altcoin from the others is its obvious bullish case. Unlike the rest of the market, Litecoin looks set for another rally which will likely be propelled forward by the next halving.

Litecoin Halving Presents Bullish Scenario

Just like Bitcoin, the Litecoin halving happens every four years and cuts block rewards by 50%. The aim of this halving is to reduce the amount of new supply flowing into the market. And as demand rises, there is less supply to meet this demand, thus leading to scarcity and a surge in prices.

The next Litecoin halving is now around the corner with only about three months left to go. This halving, like the ones before it, carries the same promise of a rally for the digital asset. The last halving in 2019 saw LTC’s price bottom out around $62 and then rally to a local peak of $80 in the same month.

Litecoin halving

If this year’s halving stays true to this trend, then the digital asset should be seeing some upside in the coming months. This could result in LTC clearing the $100 level once more as investors prep for the next leg-up.

A 20% upside is attainable at this point, especially with the halving expected to happen in early August. So more than likely, the buyers will dominate the market for the next two months, leading to rising prices for Litecoin.

LTC Outlook For 2023

Presently, the crypto market is seeing muted momentum as investors remain indecisive. For Litecoin, the upcoming halving remains a bullish event but the prospects for the months following the halving event do not look good given historical performances.

Litecoin price chart from TradingView.com

After each halving, LTC has seen a reversal in sentiment following the initial surge and the subsequent crashes have been more brutal than the uptrends. For example in 2019, LTC’s price crashed almost 50% in the month of September, one month after the halving was completed. This was because the bull market was yet to begin and the cryptocurrency fell back into lockstep with the rest of the market again.

Going by this historical performance, it would seem the best time to take profits would be toward the end of August after the asset has rallied around 30%. The window of opportunity closes with the month of September which has historically been a bearish month for cryptocurrencies.

At the time of writing, LTC is trading at $87.11, up 3.22% in the last day.

Litecoin’s MVRV Has Surged, Why This Is Bearish

On-chain data shows the Litecoin MVRV has been at relatively high levels recently, something that could be bearish for the cryptocurrency.

Both 30-Day & 365-Day Litecoin MVRV Ratios Are High Currently

According to data from the on-chain analytics firm Santiment, LTC traders are well above water at the moment. The “MVRV ratio” is an indicator that measures the ratio between the two main capitalization models for Litecoin: the market cap and the realized cap.

The market cap here is the usual cap that calculates the total value of the asset by simply taking the value of each coin in the circulating supply the same as the current spot price.

The realized cap, however, is a more special model as it assumes that the actual value of any coin in circulation is the price at which it was last transacted on the blockchain.

Since this model aims to estimate a sort of “true value” for Litecoin, its comparison with the market cap (that is, the spot price) in the MVRV can tell us whether the asset’s price is fair or not right now.

When the MVRV has a value greater than 1, it means the market cap is above the realized cap currently. During such times, the average investor is in a state of profit, so the incentive to sell for them increases. As such, the cryptocurrency could be considered overpriced in these conditions.

On the other hand,  the indicator having a value lower than this threshold implies the average holder is in a loss, and hence, the asset may be undervalued currently.

Now, here is a chart that shows the trend in the 30-day and 365-day moving averages (MAs) of the Litecoin MVRV ratio over the last few months:

Litecoin MVRV ratio

As displayed in the above graph, both the 30-day and 365-day MAs of Litecoin MVRV have risen above the baseline with the recent surge in the price beyond the $90 level. This may mean that the cryptocurrency could have become slightly overpriced.

Prior to this surge, when LTC had been visiting some lows, the 30-day version of the indicator had temporarily entered into the undervalued region. Coinciding with these values of the metric, the price formed its bottom and eventually built up towards the current surge.

Back in April, the MVRV MAs showed a similar behavior as right now, as they touched relatively high values when the asset had rallied above the $100 mark. The rally stopped before long in those overvalued conditions, and the asset took a plunge.

If a similar pattern as back then also follows with the current overpriced values of the indicator, then Litecoin may go on to observe a correction in the near future.

In the long term, however, the outlook of the asset could still remain bullish, as the much-awaited halving event, where the cryptocurrency’s block rewards will be permanently cut in half, will take place in August, which is just around the corner now.

LTC Price

At the time of writing, Litecoin is trading around $91, up 1% in the last week.

Litecoin Price Chart

Litecoin Price Prediction: LTC Could Surge 10% If It Clears This Resistance

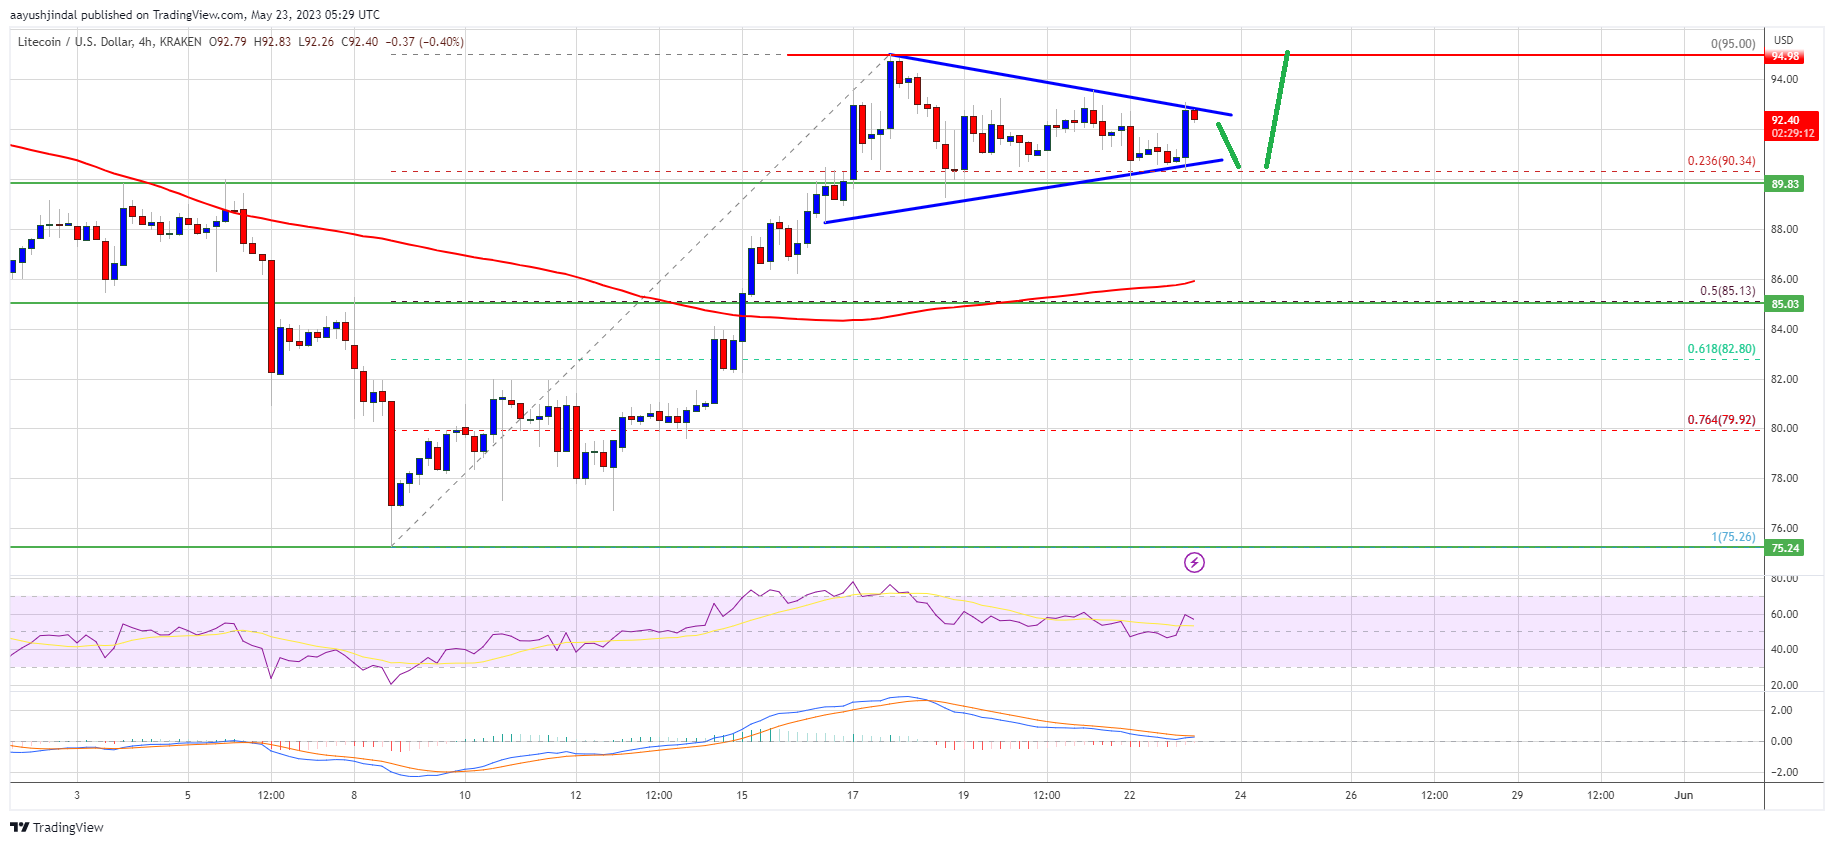
Litecoin price is attempting an upside break above $93 against the US Dollar. LTC could rally if it clears the $93 and $95 resistance levels.

  • Litecoin is slowly moving higher toward $95 against the US Dollar.
  • The price is now trading above $90 and the 100 simple moving average (4 hours).
  • There is a key contracting triangle forming with resistance near $92.50 on the 4-hour chart of the LTC/USD pair (data feed from Kraken).
  • The price could rally toward the $100 and $105 levels.

Litecoin Price Eyes Upside Break

After a steady increase, Litecoin’s price struggled near the $95 resistance against the US Dollar. LTC price started a downside correction and traded below the $92 level.

The price tested the 23.6% Fib retracement level of the upward move from the $5.26 swing low to the $95.00 high. However, the bulls seem to be protecting a downside break, unlike Bitcoin and Ethereum. Litecoin is now consolidating above the $90 level.

It is trading above $90 and the 100 simple moving average (4 hours). There is also a key contracting triangle forming with resistance near $92.50 on the 4-hour chart of the LTC/USD pair.

Litecoin Price Prediction

Source: LTCUSD on TradingView.com

On the upside, immediate resistance is near the $93 zone. The next major resistance is near the $95 level. If there is a clear break above the $95 resistance, the price could start another strong increase. In the stated case, the price is likely to continue higher toward the $100 and $105 levels. Any more gains might send LTC’s price toward the $112 resistance zone.

Fresh Decline in LTC?

If Litecoin price fails to clear the $95 resistance level, there could be a fresh decline. Initial support on the downside is near the $91 level and the triangle lower trend line.

The next major support is forming near the $85 level or the 50% Fib retracement level of the upward move from the $5.26 swing low to the $95.00 high, below which there is a risk of a move toward the $80 support. Any further losses may perhaps send the price toward the $75 support.

Technical indicators:

4-hour MACD – The MACD is now gaining pace in the bullish zone.

4-hour RSI (Relative Strength Index) – The RSI for LTC/USD is above the 50 level.

Major Support Levels – $91.00 followed by $85.00.

Major Resistance Levels – $93.00 and $95.00.