Trading Guru John Bollinger Warns Of Buying Litecoin, Here’s Why

In his latest analysis, legendary trader John Bollinger has expressed concerns over Litecoin’s performance, particularly in comparison to Bitcoin. Bollinger, known for developing the popular technical analysis tool Bollinger Bands, highlighted a worrying pattern in the Litecoin market.

He remarked, “I was asked for an analysis of LTCBTC. The thing that concerns me the most is its underperformance vs Bitcoin. From a price perspective the controlling LTCUSD feature is the 2 bar reversal at the lower Bollinger Band which is typically considered a bearish signal by traders.”

Litecoin price analysis by John Bollinger

Bollinger’s Bearish Litecoin Prediction Explained

The chart of the LTC/USD pair provided by Bollinger on November 28, 2023, shows Litecoin’s price action in relation to its Bollinger Bands on both a daily and weekly scale. The price is currently hovering around $69.566, which is significantly lower than the upper Bollinger Band, suggesting a lack of bullish momentum.

The Bands form by plotting a range of standard deviations above and below a simple moving average, commonly enveloping the price action. In this chart, the daily vs. weekly candles chart shows that the LTC/USD price is struggling beneath the midpoint of these bands, which is a bearish indication. The price currently near $69.566 is substantially below the upper band level of around $90, which represents a potential resistance level.

The Bollinger Bands (BB) on the chart are set with a 20-period moving average with a 2 standard deviation range. Bollinger’s analysis points to a ‘2 bar reversal’ pattern at the lower band. This pattern emerges when a bar reaches a high above the preceding bar but then closes below the close of that same previous bar, hinting at a possible reversal from the uptrend. Such a pattern took place near the lower band, indicating that any effort to drive the price higher meets with resistance, and the prevailing selling pressure is taking hold.

The Bollinger %B indicator is also crucial here as it compares the price of Litecoin to the range defined by the Bollinger Bands. A %B value below 0.5 indicates that Litecoin’s price sits nearer to the lower band than to the upper band, potentially signaling weakness. The chart shows the indicator failing to cross the 0.5 level after a plunge toward 0, signifying that the price frequently touches or falls below the lower band.

LTC Price Under Pressure

The Bollinger Band Width (BBW) serves as another indicator, measuring volatility by assessing the Bollinger Bands’ width. A narrowing of the Bands, as seen in the latter part of the chart, suggests a decrease in volatility and often precedes a significant price movement. In this context, the BBW’s narrowing on the Litecoin chart might indicate that the market is tensing, possibly gearing up for an impending breakout or breakdown.

When Bollinger mentions Litecoin’s underperformance relative to Bitcoin, it’s important to note that Bitcoin often leads the crypto market trend. If Litecoin is not keeping up with Bitcoin’s movements, it could suggest a lack of confidence or interest from traders in altcoins (as the current rise in Bitcoin dominance shows) and Litecoin specifically.

In summary, Bollinger’s technical analysis indicates that Litecoin is in a precarious position. The price action at the lower Bollinger Band, the bearish ‘2 bar reversal’ pattern, the sub-0.5 Bollinger %B values, and the narrowing BBW all suggest that Litecoin may continue to see downward pressure in the near term.

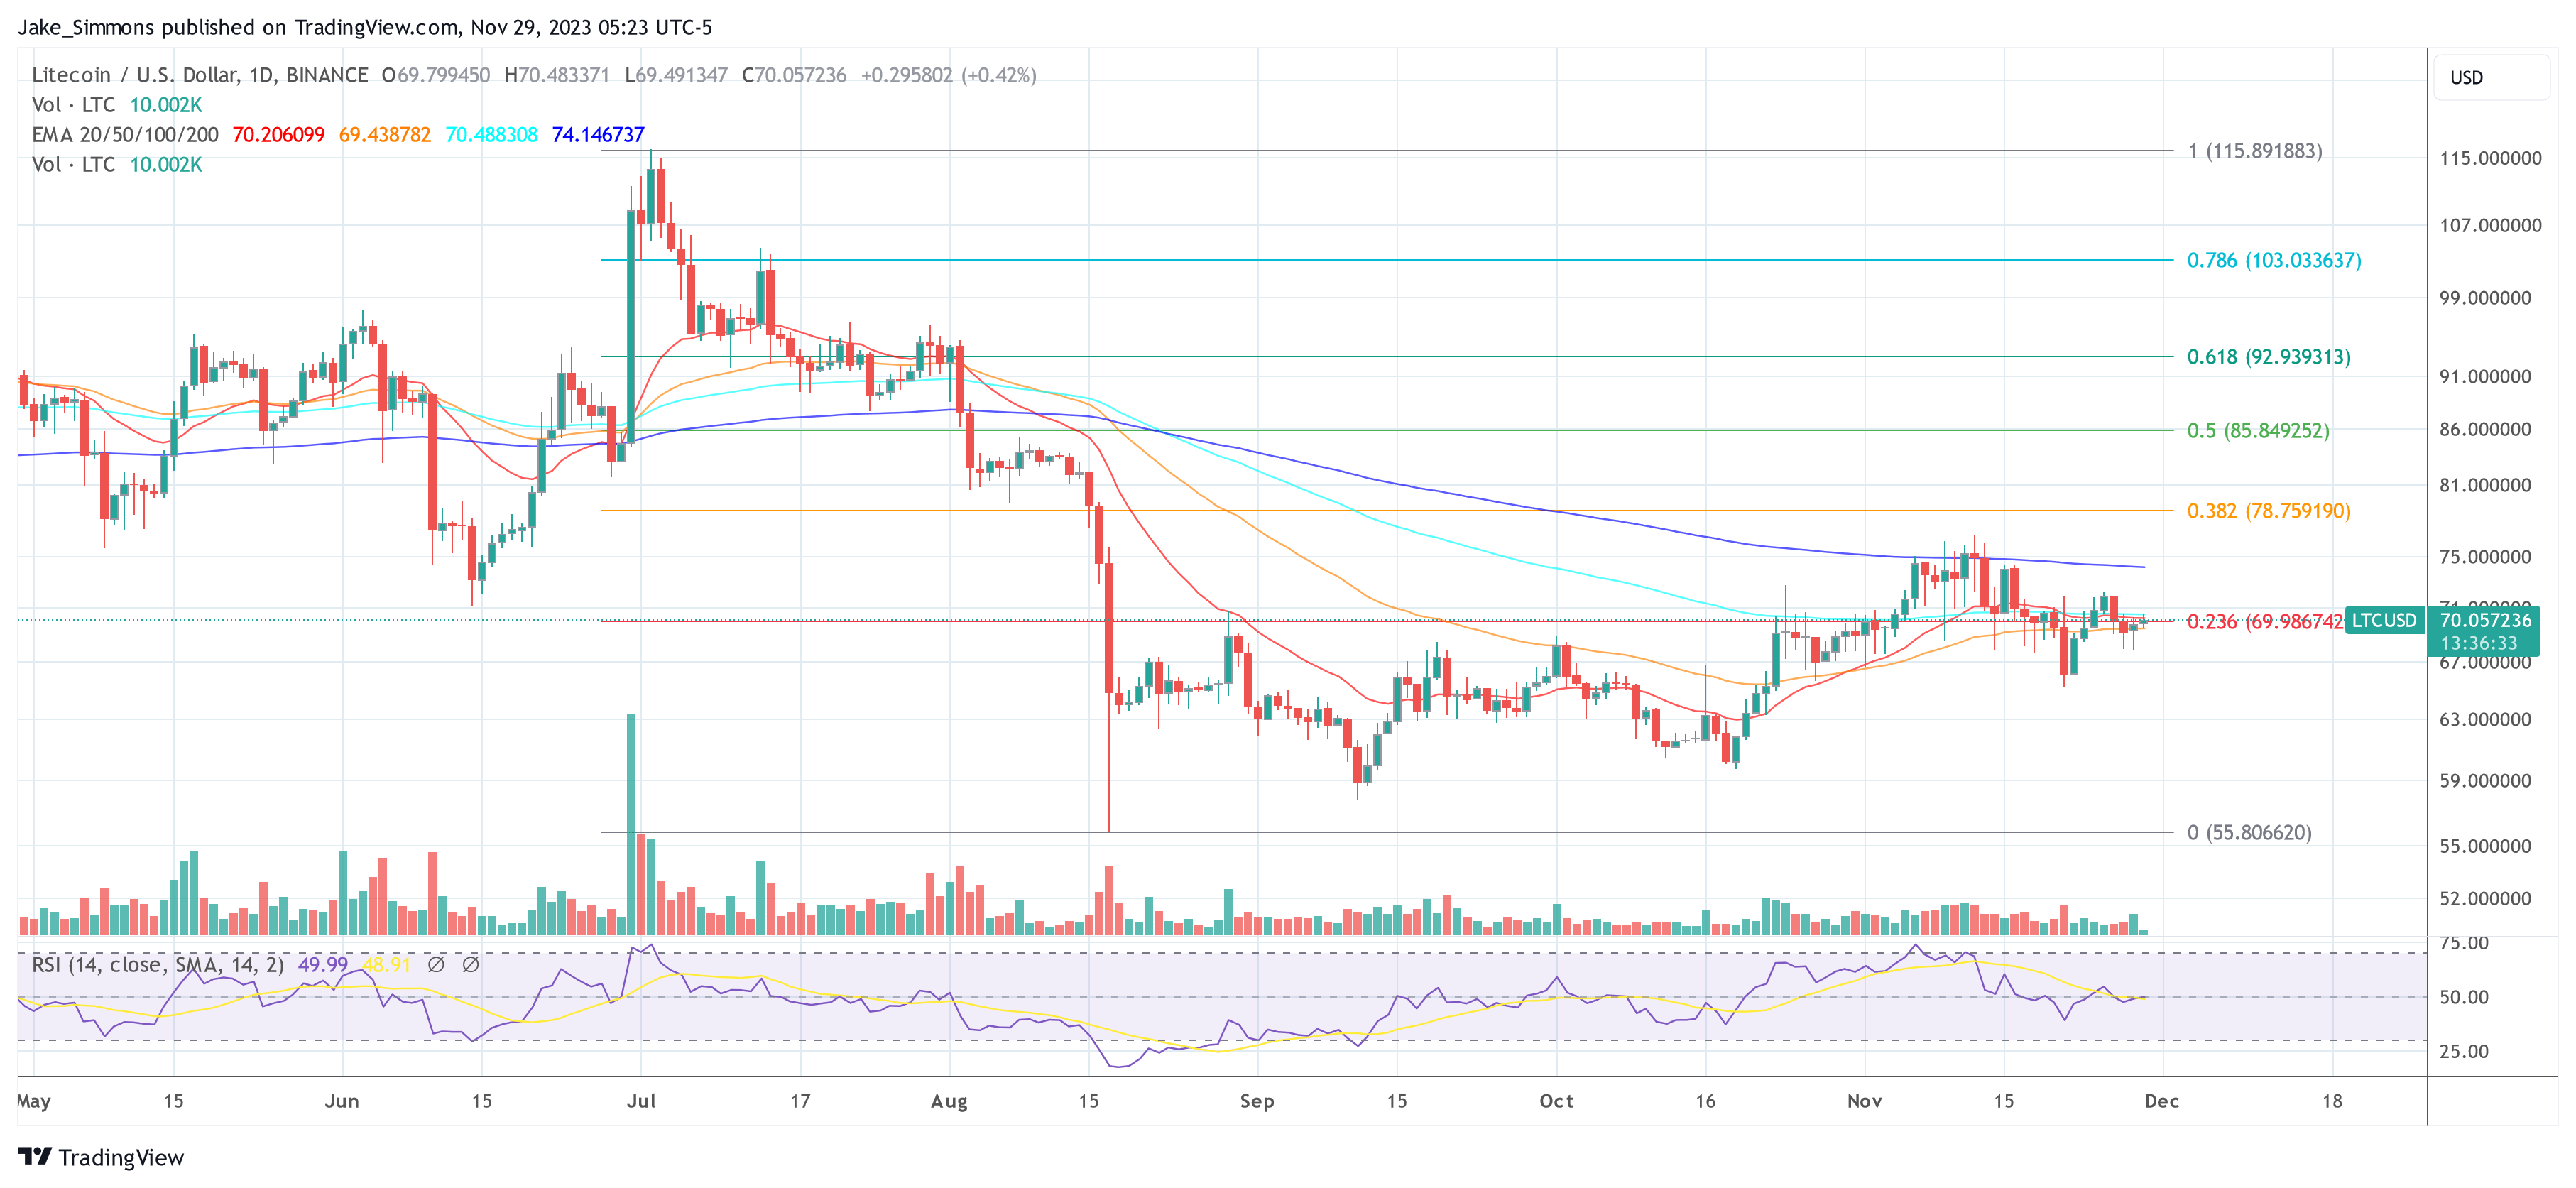
At press time, Litecoin traded at $70.05. The 1-day chart of LTC/USD shows that the altcoin fell below the key support of the 0.236 Fibonacci retracement level at $69.98 two days ago. A retest is currently taking place, a daily close above this is of utmost importance for the Litecoin price.

Litecoin price

Litecoin Price Prediction: LTC Could Retest $60 Before Fresh Surge

Litecoin price is struggling to gain pace above $66.40 against the US Dollar. LTC could revisit the $60 support before the bulls take a strong stand.

  • Litecoin is correcting losses from the $63 support zone against the US Dollar.
  • The price is now trading below $66 and the 100 simple moving average (4 hours).
  • There is a key contracting triangle forming with resistance near $65.50 on the 4-hour chart of the LTC/USD pair (data feed from Kraken).
  • The price could drop toward the $60 support before it starts a fresh increase.

Litecoin Price Signals Bearish Move

This past week, there was a fresh decline in Bitcoin, Ethereum, Litecoin, and other altcoins against the US Dollar. LTC price formed a top near $68.40 before it started a fresh decline.

The price traded below the $66.40 and $65.00 support levels. It retested the $63.00 support zone. A low was formed near $63.01 and the price is now attempting a fresh increase. There was a move above the $65.20 resistance.

The price spiked above the 50% Fib retracement level of the downward move from the $68.38 swing high to the $63.01 low. Litecoin is now trading below $66 and the 100 simple moving average (4 hours). There is also a key contracting triangle forming with resistance near $65.50 on the 4-hour chart of the LTC/USD pair.

On the upside, immediate resistance is near the $65.50 zone. The next major resistance is near the $6.40 level. It is close to the 61.8% Fib retracement level of the downward move from the $68.38 swing high to the $63.01 low. If there is a clear break above the $66.40 resistance, the price could start another strong increase.

Litecoin Price Prediction

Source: LTCUSD on TradingView.com

In the stated case, the price is likely to continue higher toward the $68.40 and $70 levels. Any more gains might send LTC’s price toward the $75 resistance zone.

Downside Thrust in LTC?

If Litecoin price fails to clear the $66.40 resistance level, there could be a fresh decline. Initial support on the downside is near the $63.00 level.

The next major support is forming near the $60 level, below which there is a risk of a move toward the $58.00 support. Any further losses may perhaps send the price toward the $55 support.

Technical indicators:

4-hour MACD – The MACD is now losing pace in the bullish zone.

4-hour RSI (Relative Strength Index) – The RSI for LTC/USD is still below the 50 level.

Major Support Levels – $63.00 followed by $60.00.

Major Resistance Levels – $66.40 and $68.40.

Why Litecoin Is The Most Undervalued Asset in Crypto

Litecoin momentum is potentially changing, network usage is skyrocketing, and the cryptocurrency’s halving is ahead.

Yet the asset remains drastically undervalued relative to Bitcoin, Ethereum, and other factors. Here is a closer look at why Litecoin could be the most undervalued asset in crypto.

LTC Vs BTC Vs ETH Compared

Litecoin was once a top ten or higher cryptocurrency that has since fallen from that lofty pedestal. A nine-month-long up-only bull run and more than 10,000% ROI left the coin ranging for going on its fifth full year.

Unlike other top coins like Bitcoin and Ethereum, LTC never made dramatic new all-time highs in 2021. On some exchanges, the record high is still set for 2017. After the 2017 bull market peak, Litecoin has lagged behind the two largest coins by market cap.

But this is common in the final stages of a bull market, after which Litecoin wildly outperforms both BTC and ETH in a flash. That sort of situation could return, according to the charts below, starting with the below comparison of LTC versus Bitcoin and Ether.

litecoin LTCUSD_2023-05-16_07-26-44

Crypto Market Moment Ready To Change

Another sign that LTC is due to outperform the market can be found in the one-month LMACD crossing bullish. The signal is at least a two months ahead of Bitcoin and Ether and suggests a larger move in Litecoin first.

According to Investopedia, momentum “refers to the inertia of a price trend to continue either rising or falling for a particular length of time.” The LMACD is a momentum measuring tool, and it could be indicating that Litecoin’s inertia just made a major swing in the positive direction.

litecoin LTCUSD_2023-05-16_07-31-23

Litecoin Elliott Wave And The Final Advance

Litecoin technicals, according to Elliott Wave Principle, could also point to much higher prices. The current wave count and Fibonacci retracement levels are characteristic of an expanding diagonal pattern.

These patterns appear at the beginning or the end of a motive wave. Considering the larger wave count, this would suggest an ending expanding diagonal and perhaps the last major rally in Litecoin in some time.

LTCUSD_2023-05-16_07-37-24

LTC Fundamentals Support Soaring Higher

Finally, LTC transactions are currently skyrocketing. From a fundamental perspective, this is as bullish as it gets for any cryptocurrency. Litecoin is benefiting from an explosion of ordinals on the LTC-20 standard, congestion on Bitcoin and Ethereum, and more.

LTCUSD_2023-05-16_08-05-19

Essentially, the Litecoin ecosystem is booming again. When network usage skyrockets, LTCUSD spikes in price. We also have yet to mention Litecoin’s halving, which is less than 80 days away.

Could A Litecoin Fractal Foretell A New Bull Trend In Crypto?

The cryptocurrency market continues to feel the darkness of crypto winter, but it could be Litecoin bringing the blossom of a new bull trend, according to a an eerily similar fractal found in LTCUSD daily price charts. 

The fractal pattern developed following the most recent pullback, and appears to have a similar structure to a major bull market breakout. Could this be the light at the end of the tunnel for cryptocurrencies?

Hawkish Fed Dims Litecoin Rally, But A Fractal Gives Hope

After a stellar month leading the market with 40% returns for November, Litecoin has given back nearly half of that thus far in December. 

LTC had been on a tear, outperforming top coins like Bitcoin and Ethereum, and clawed its way closer toward making it back into the top ten cryptocurrencies ranked by market cap. 

But the greater market pullback stemming from a hawkish Fed meeting this month, caused a failure to liftoff in Litecoin.  

However, the discovery of a price action fractal in LTCUSD could suggest this recent pullback wasn’t necessarily a failure, but a refueling of sorts — before taking off in an even stronger rally. 

2022-12-20 17.33.24

Comparing Price Action Then Vs Now: Will Bulls Get A Break?

The fractal begins on Black Thursday in March 2020 — a black swan event few saw coming. Litecoin rebounded and the fractal formed. 

Unlike Bitcoin, which made a lower low during the FTX, LTCUSD hasn’t, and instead has followed the same pattern from 2020 almost flawlessly. 

Price following the fractal further could lead to some minor continued downside, but ultimately holds at resistance turned support. If the current pullback proves to be a retest and holds, a more obvious rally could materialize.

Failure would almost certainly send Litecoin back toward 2018 lows and potentially beyond, making the fractal among one of Litecoin bulls’ best hope for a redemption rally.

Importantly, a concurrent reversal taking place in the LTCBTC and LTCETH trading pairs appear to indicate strength in the altcoin relative to the top two crypto assets. However, there is no telling what this might mean for the overall market at this time.

Forget Lightning, Litecoin Is About To Strike Twice Against Bitcoin

Litecoin is cleared for takeoff after a brutal downtrend against Bitcoin and the dollar. Could the cryptocurrency known as digital silver be the next altcoin to pop like Ethereum, Dogecoin, and the rest of the pack?

Here’s a closer look at the technical signals suggesting a change in the tides is here – a reversal that could cause lighting in the LTCBTC trading pair to strike for a second time.

The Long Running Deviation Between Digital Silver And Gold

The digital gold narrative has fueled much of Bitcoin’s growth over the last two years. Being the “fastest horse in the race against inflation” and a way for corporations to protect treasury reserves has brought the crypto market to the mainstream.

Related Reading | Now Or Never: Litecoin Plummets To Bottom Of Top Ten Crypto Assets

Following Bitcoin, Ethereum went for a long run that’s still ongoing today, and other altcoins like Dogecoin have been the talk of finance. Yet still, Litecoin lagged behind.

The once top ten titan of a cryptocurrency has since fallen out of the list completely, and has some catching up to do. That time could be now, however, as momentum on the highest timeframes against Bitcoin have begun to turn up for Litecoin.

litecoin bitcoin

Momentum is turning up after more than 666 days of Litecoin holder hell | Source: LTCBTC on TradingView.com

Litecoin Ready To Strike Back Against Bitcoin Like Lightning

Litecoin has now spent a hellish 666 days in a downtrend against BTC, letting digital gold steal the entire show for several years. But like the real relationship between physical gold and silver, after gold makes a run, the silver ratio improves in the following months to years.

The same is happening now with Litecoin, now that an altcoin season is back across crypto, and lower liquidity coins begin to rake up all the capital.

Related Reading | Litecoin On The Verge Of Monster Move 

It takes less capital to move the price of these coins further, and after such a long-stretch of negative sentiment in Litecoin while Bitcoin soaked up all the positivity, it could result in an especially powerful move.

All the same perfect-storm conditions are back from the last time the tides changed. The LMACD is turning up on monthly timeframes, suggesting momentum is in bulls’ favor.

The downtrend both times lasted roughly the same amount of time, and the big move up came after breaking above the middle-Bollinger Band – something that is clearly happening again now according to the chart pictured above.

With Bitcoin diving, and Litecoin and other altcoins getting their day in the limelight now, there’s a chance the massive move is only just beginning. Measured move targets point to as much as a 240% move against Bitcoin. Will LTC strike BTC for a second time?

Featured image from Pixabay, Charts from TradingView.com

Litecoin On The Verge Of Monster Move Against Bitcoin

Litecoin has been among the worst performers in the crypto market in 2020 and 2021 thus far, despite the coin’s longevity in the top ten assets by market cap.

The coin’s fortunes could soon turn completely around, due to what looks to be a monster-sized move brewing against Bitcoin on the altcoin trading pair. Here’s why technicals suggest that near and mid-term Litecoin should outperform the top cryptocurrency by miles.

Litecoin Longevity Helps Altcoin Maintain Top Ten Crypto Cap Ranking

The cryptocurrency market is constantly changing. The top ten cryptocurrencies by market cap currently looks vastly different now than it did one year ago. Coins that were in the top ten during the last bull market, are now no longer part of that elite.

Related Reading | Five Signs Litecoin Has Bottomed, Next In Line For New ATH

XRP, a coin ranked in third for most of its lifetime, nearly plummeted completely from the top ten – but has since made a dramatic recovery.

Another coin the cryptocurrency bull run has mostly ignored, has been Litecoin. Along with Ripple, the altcoin dubbed digital silver have lagged behind the rest of the top ten assets, yet some how have clung on. Both of failed to set a new all-time high, but according to technicals, they’re next in line to do so.

ltc btc litecoin bitcoin

Several bullish technicals suggest a major breakout and monster move is coming | Source: LTCBTC on TradingView.com

LTCBTC Monthly Technicals: On The Brink Of A Monster Bullish Move

Litecoin is an offshoot of Bitcoin code and often considered the silver to the digital gold narrative. The digital gold narrative has taken Bitcoin’s market cap to $1 trillion, but like silver lagging behind gold itself, Litecoin has barely been a blip on anyone’s radar.

However, bullish technicals on the LTCBTC trading pair are indicating a massive move against Bitcoin.

Related Reading | Litecoin Signal Shines, Suggests Downtrend Against Bitcoin Is Over

If a full turnaround starts now, a perfected TD 13 countdown marked the bottom with incredible precision. Supporting a major reversal on the altcoin ratio against Bitcoin, the monthly Stochastic indicator has crossed upward after spending two years in the bottom range. Coinciding with the crossover, the monthly Relative Strength Index has fallen back to touch a support level that wasn’t tapped since 2015.

The logarithmic MACD is also rolling upward, falling short of a bullish crossover just yet. The often considered lagging indicator is instead a signal that there’s clear skies ahead, and is more of a confirmation that a reversal has taken place.

Turning upward the last time in early 2017, took Litecoin to its current all-time high. After holding onto the top ten like a champ, it could finally be time for digital silver to shine.

Featured image from Pixabay, Charts from TradingView.com

Litecoin Signal Shines, Suggests Downtrend Against Bitcoin Is Over

Litecoin is trading at around $200… still. The altcoin has failed to set a new all-time high like Bitcoin, Ethereum, and others in the top ten have, yet it has clung onto the ranks for its entire lifetime.

A signal has appeared – across several of the highest timeframes – that could suggest that the long downtrend against Bitcoin is about to come to an explosive ending.

Litecoin Loses Luster During Bear Market, Can’t Catch A Spark

Few coins have had as difficult of a time recovering since the last bull market as Litecoin has. The only other coin in the top ten to struggle so severely is XRP, and the coin’s parent company Ripple is locked in a legal battle with the SEC.

Litecoin has no such issue to keep its prices down, yet the coin has yet to do much better than its 2019 peak, and is not even halfway recovered to its previous all-time high around $418 per LTC.

Related Reading | Now Or Never: Litecoin Plummets To Bottom Of Top Ten Crypto Assets

Meanwhile, Ethereum just smashed above $2,000 and Bitcoin is trading at around $60,000 per coin – more than three times its former high.

The rise in Bitcoin but subsequent stagnancy in Litecoin, has caused the altcoin to absolutely nosedive in terms of the LTCBTC trading pair. But with a handful of potential reversal signals forming on the ratio, things soon could turn around for an extended phase.

ltcbtc

A TD 13 signal has triggered on the LTCBTC monthly | Source: LTCBTC on TradingView.com

LTCBTC Reversal: The Sign That Things Could Finally Turn Around For The Altcoin

After Litecoin peaked, it spend nine full months in a downtrend against Bitcoin until a TD 9 signal appeared. The altcoin then saw a short-term boost with its halving in 2019, but after it peaked then, its been all about Bitcoin in the crypto industry ever since.

Following a bear market bounce, the altcoin fell for another consecutive 25 months, ignoring another TD 9 and instead reaching a TD 13 countdown on monthly timeframes. Coinciding with a narrowing pattern on the Relative Strength Index, an explosive breakout is imminent.


The same powerful 13 countdown is evident on quarterly timeframes also | Source: LTCBTC on TradingView.com

The TD 13 has also appeared on even more powerful timeframes, such as the LTCBTC quarterly represented in the chart above.

Related Reading | Five Signs Litecoin Has Bottomed, Next In Line For New ATH

Zoomed in even further for the chart below, there’s even a TD 9 within the past week on daily timeframes.

A less powerful TD 9 on daily timeframes may have kicked off the turning point | Source: LTCBTC on TradingView.com

Both a TD 9 and TD 13 signal suggest a trend is reaching a point of exhaustion, and due to turn around. And it already has since the daily TD 9 triggered.

The LTCBTC pair is now higher, and there’s green forming in a sea of red finally. If the tides finally turn, and Bitcoin maintains relatively high prices, the cost per Litecoin could explode as it finally plays catch up with the likes of its digital gold counterpart, Ethereum, and the rest of the altcoin space.

Featured image from Deposit Photos, Charts from TradingView.com

Now Or Never: Litecoin Plummets To Bottom Of Top Ten Crypto Assets

Litecoin is often called the silver to Bitcoin as digital gold, and strangely, the two cryptocurrencies and two precious metals are exhibiting the same behavior where one is lagging behind the other.

The lack of momentum in the digital and physical forms of silver have kept the price of both assets at bay for the entire recent bull market in each class. With no growth in Litecoin compared to other cryptocurrencies, the altcoin is only a billion dollars away from losing the top ten cryptocurrency by market cap status – something its held pretty much since its inception.

“Digital Silver” Is The Altcoin That Simply Won’t Shine

Litecoin is an offshoot of the original Bitcoin code, created in 2011 by former Google and Coinbase engineer Charlie Lee.

Much like how on a per ounce basis gold is more both more scarce and valuable than silver is, there are four times as many total LTC compared to Bitcoin’s 21 million BTC.

Related Reading | Digital Silver: Why Litecoin Is Poised To Bounce Versus Bitcoin

In addition, there’s faster transactions, among other benefits. Outside of the few differences, there’s mostly similarities between them – including a hard-coded halving recurring every four years or so.

litecoin versus bitcoin ethereum Litecoin is severely lagging behind the rest of crypto | Source: LTCUSD on TradingView.com

But unlike Bitcoin, that halving amounted to very little in terms of sustainable returns for investors of the altcoin. The cryptocurrency is lagging far behind Bitcoin, Ethereum, and most other cryptocurrencies in the market.

Also unlike Bitcoin or Ethereum and several other altcoins, Litecoin has failed to set a new all-time high since the bull market began.

Even gold has set a new price record, while silver still trades well below its. It is bizarre that the asset dubbed digital silver, is following the path of physical silver so well, versus the rest of the crypto world.

Litecoin At Risk Of Losing Top Ten Crypto Status

The continued underperformance of Litecoin compared to there rest of the market, however, could knock the cryptocurrency out of the top ten assets ranked by market cap, according to price aggregator CoinMarketCap.

The animated GIF above is a look back at the past decade or so the historical snapshots will go back, taken from the first ever date, then annually each March closest to the end of the month.

Every single snapshot, Litecoin is ranked anywhere from number two to ten, and every rank in between. It’s never had the number one spot, but it’s also never lost the top ten.

Related Reading | Five Signs Litecoin Has Bottomed, Next In Line For New ATH

But the likes of Chainlink, Stellar, and Bitcoin Cash are all right on its tail, some within a $1 billion striking distance for making history for unseating Litecoin. Each of the three assets have also had a stint in the top ten themselves.

There’s also a rising stablecoin – USD Coin – right on its tail, and with more stablecoins being created monthly, the chances of it taking out the altcoin are also high.

Could a fall out of the top ten and from grace be a fatal blow for the coin, or is sentiment reaching this deep of a low in the coin a sign that capitulation is setting in and things might finally turn around?

Given how far behind Litecoin is, the low supply, several bullish technicals, and more, the altcoin could end up shocking the world when it finally does.

Featured image from Deposit Photos, Charts from TradingView.com

Digital Silver: Why Litecoin Is Poised To Bounce Versus Bitcoin

Litecoin has had a brutal “bull market” if you can even call it that for the once popular cryptocurrency built on Bitcoin’s code. However, that all might soon turn around, as a massive bounce is brewing on the LTCBTC trading pair.

A reversal on the trading pair could help Litecoin catch up to the rest of the market, which has already set new all-time highs and then some. If and when LTC recovers against BTC, the upside could be swift and violent. Here’s why.

How Long It’s Been Lights Out For This Altcoin’s Bull Market

Comparing Litecoin’s chart next to the likes of Dogecoin, Ethereum, Bitcoin, Binance Coin, and several others, shows just how dark the depths of the crypto winter got for the altcoin.

Litecoin was an incredible performer at the height of the last bull market, rising to beyond $360 per LTC in a flash.

The altcoin also led the charge in the 2019 crypto market recovery, fueled by buzz surrounding the protocol’s block reward halving.

Related Reading | Why Litecoin Is The Next Crypto To “Teleport” Like Dogecoin

Litecoin’s code is very similar to Bitcoin’s, giving it several key similarities that should be benefiting the “digital silver” counterpart currently, such as hard-coded scarcity.

Only 84 million LTC exist, a mere four times the amount of the BTC supply. And if scarcity is driving the demand behind Bitcoin, the fact that Litecoin isn’t at all following is confusing.

But a bounce is due, according to one crypto analyst‘s interpretation of the LTCBTC price chart.

litecoin ltcbtc

A hidden dull div on the OBV could trigger a breakout of the falling wedge | Source: LTCBTC on TradingView.com

Smart Money Signals That Litecoin Is Ready To Bounce Against Bitcoin

The trader who shared the above chart says that LTCBTC is currently at long-term support of a falling wedge, coinciding with a bullish divergence on the on-balance volume indicator (OBV).

The OBV is often regarded as the “smart money indicator” – named as such for its ability to pick up signals of movements before they begin to take effect in price action.

These signals represent “smart money” taking positions early before markup. Fractals from the last bull market suggest that a breakout is near, but holders of the coin are taking their time.

Related Reading | This LTC Fractal Says Time Is Running Out To Accumulate At Low Prices

Losing support would take LTCBTC to the lowest levels yet, but a full reversal here could take the altcoin back to highs on its ratio against Bitcoin.

Litecoin is one of the oldest cryptocurrencies and one of the few to hang onto the top ten assets by market cap for several years at a time, even despite an inability to reclaim its former price record.

Will Litecoin finally bounce against Bitcoin and make a full recovery?

Featured image from Deposit Photos, Charts from TradingView.com