Litecoin price is recovering higher from the $75.00 zone against the US Dollar. LTC could continue to rise if it clears the $84.00 resistance zone.
- Litecoin is showing positive signs from the $75 support zone against the US Dollar.
- The price is now trading below $85 and the 100 simple moving average (4 hours).
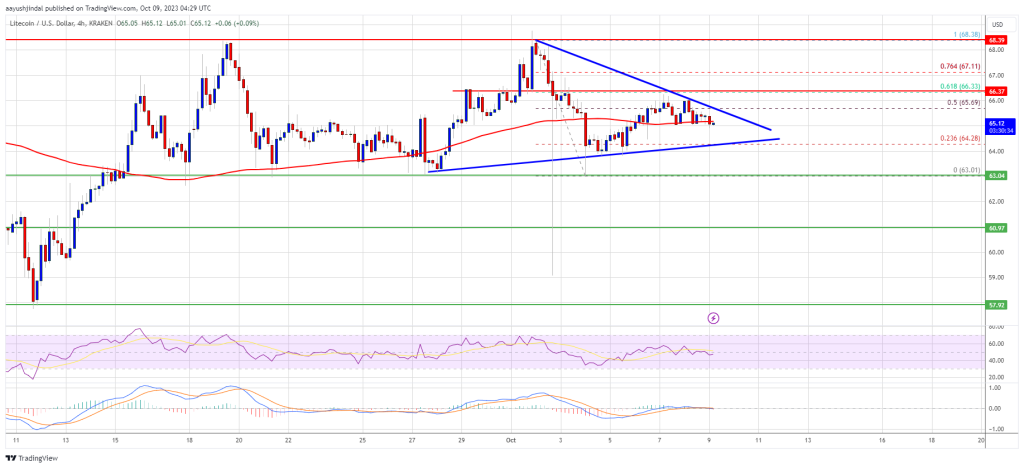
- There is a key bearish trend line forming with resistance at $83.00 on the 4-hour chart of the LTC/USD pair (data feed from Kraken).
- The price could gain bullish momentum if it clears the $83-$84 resistance zone.
Litecoin Price Aims Higher
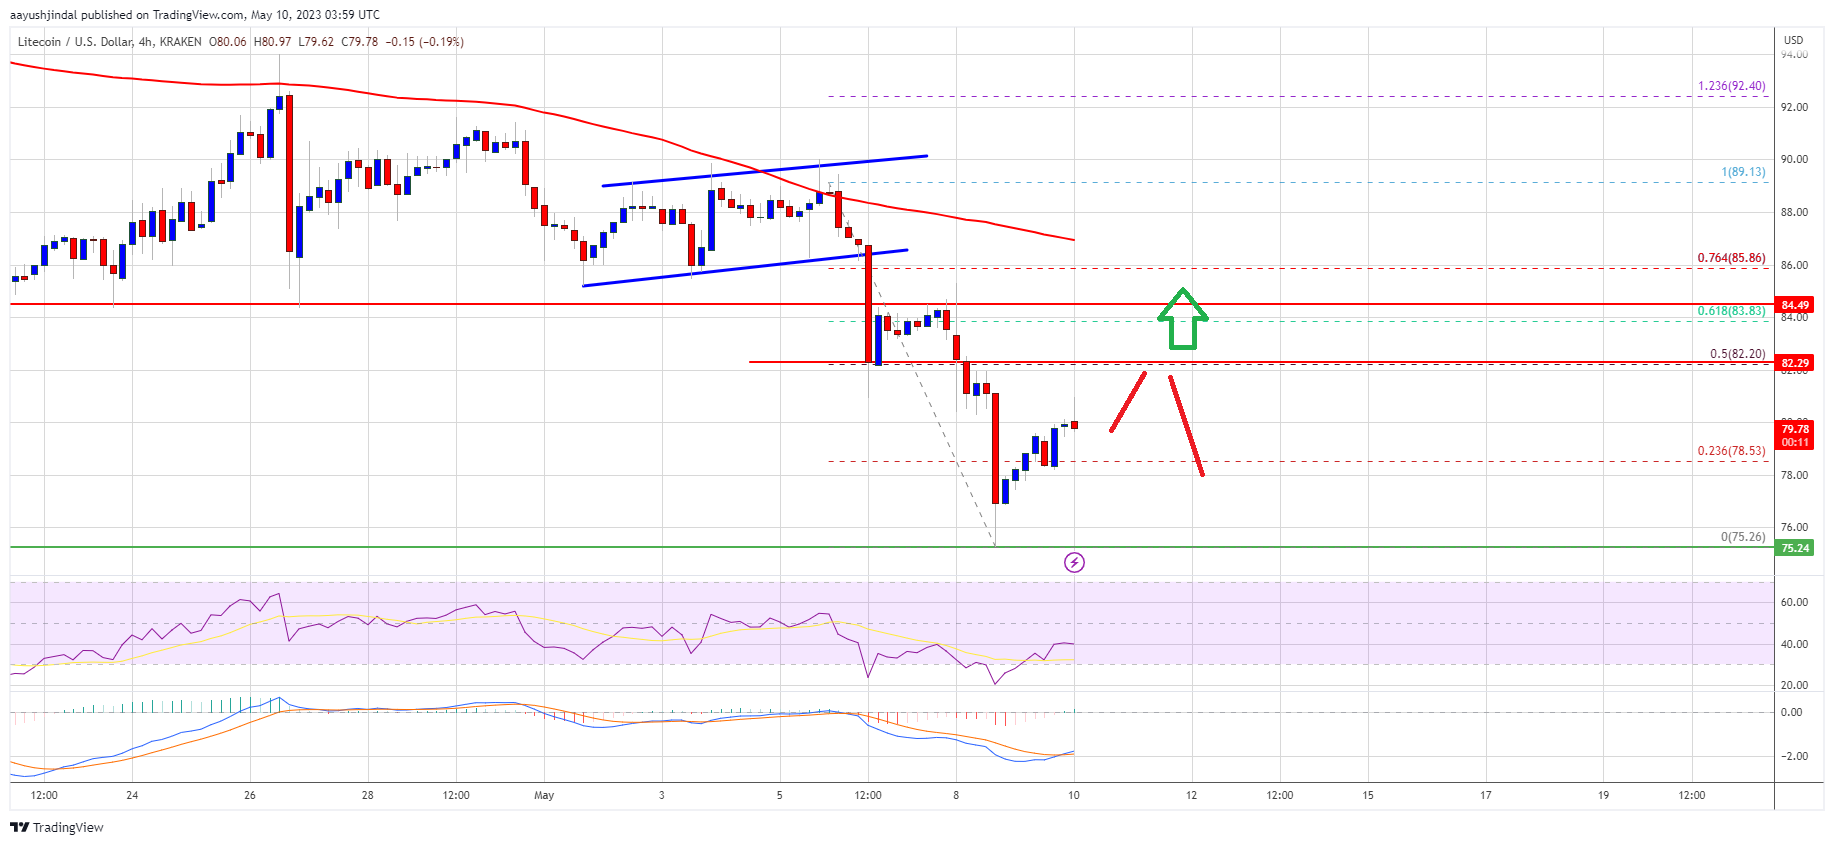
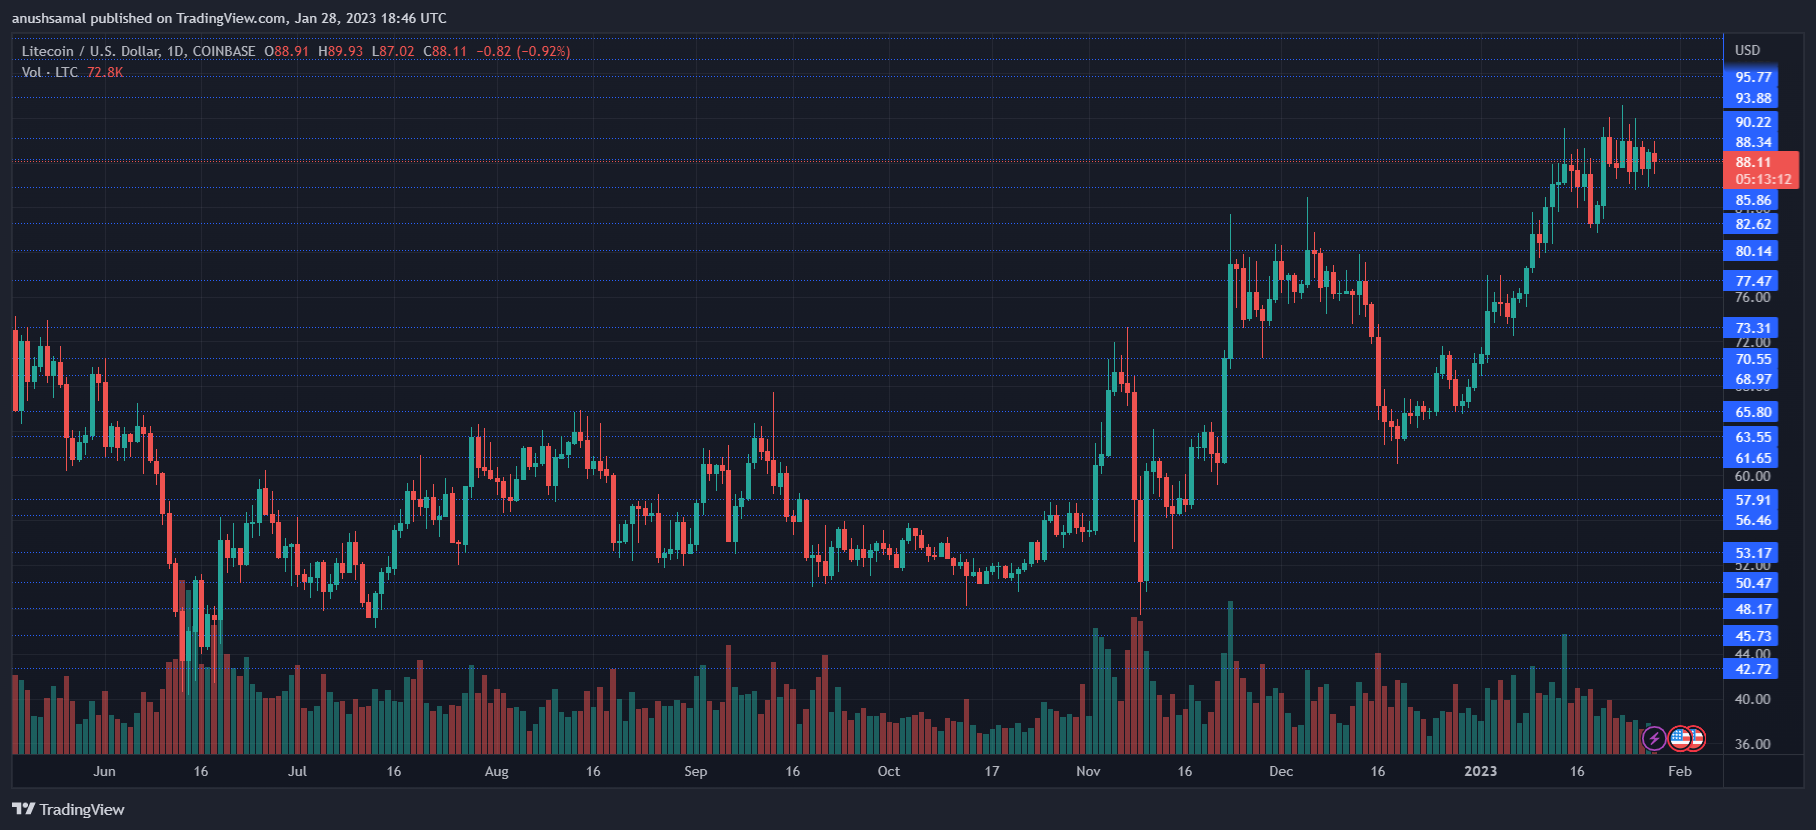
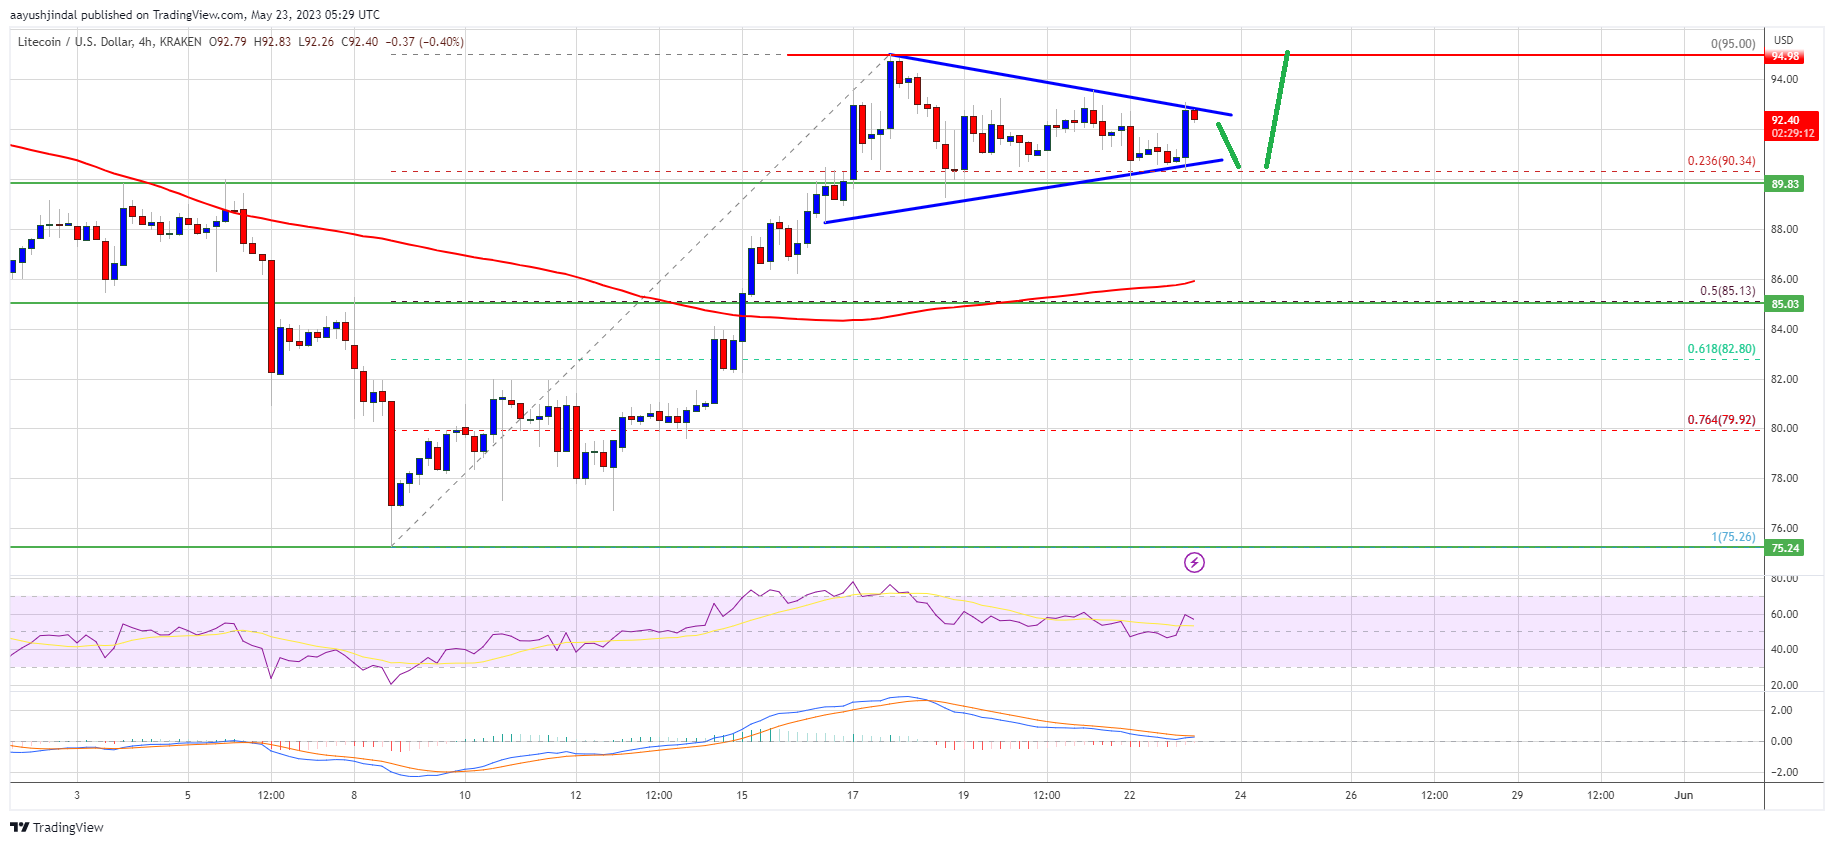
After a steady decline, Litecoin found support near the $75.00 resistance zone, like Bitcoin and Ethereum. LTC price started a recovery wave above the $78.00 and $80.00 resistance levels.
It even cleared the 50% Fib retracement level of the downward move from the $88.49 swing high to the $74.59 low. The bulls even pumped the price above $82.00, but the bears were active near the 100 simple moving average (4 hours).
There is also a key bearish trend line forming with resistance at $83.00 on the 4-hour chart of the LTC/USD pair. Litecoin is now trading below $85 and the 100 simple moving average (4 hours).
On the upside, immediate resistance is near the $83.00 zone or the 61.8% Fib retracement level of the downward move from the $88.49 swing high to the $74.59 low. The next major resistance is near the $84 level. If there is a clear break above the $84 resistance, the price could start another strong increase.
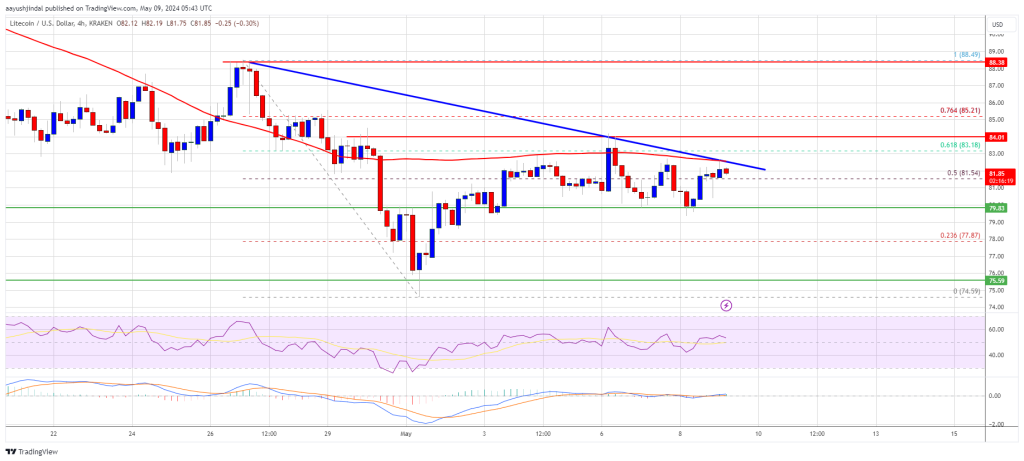
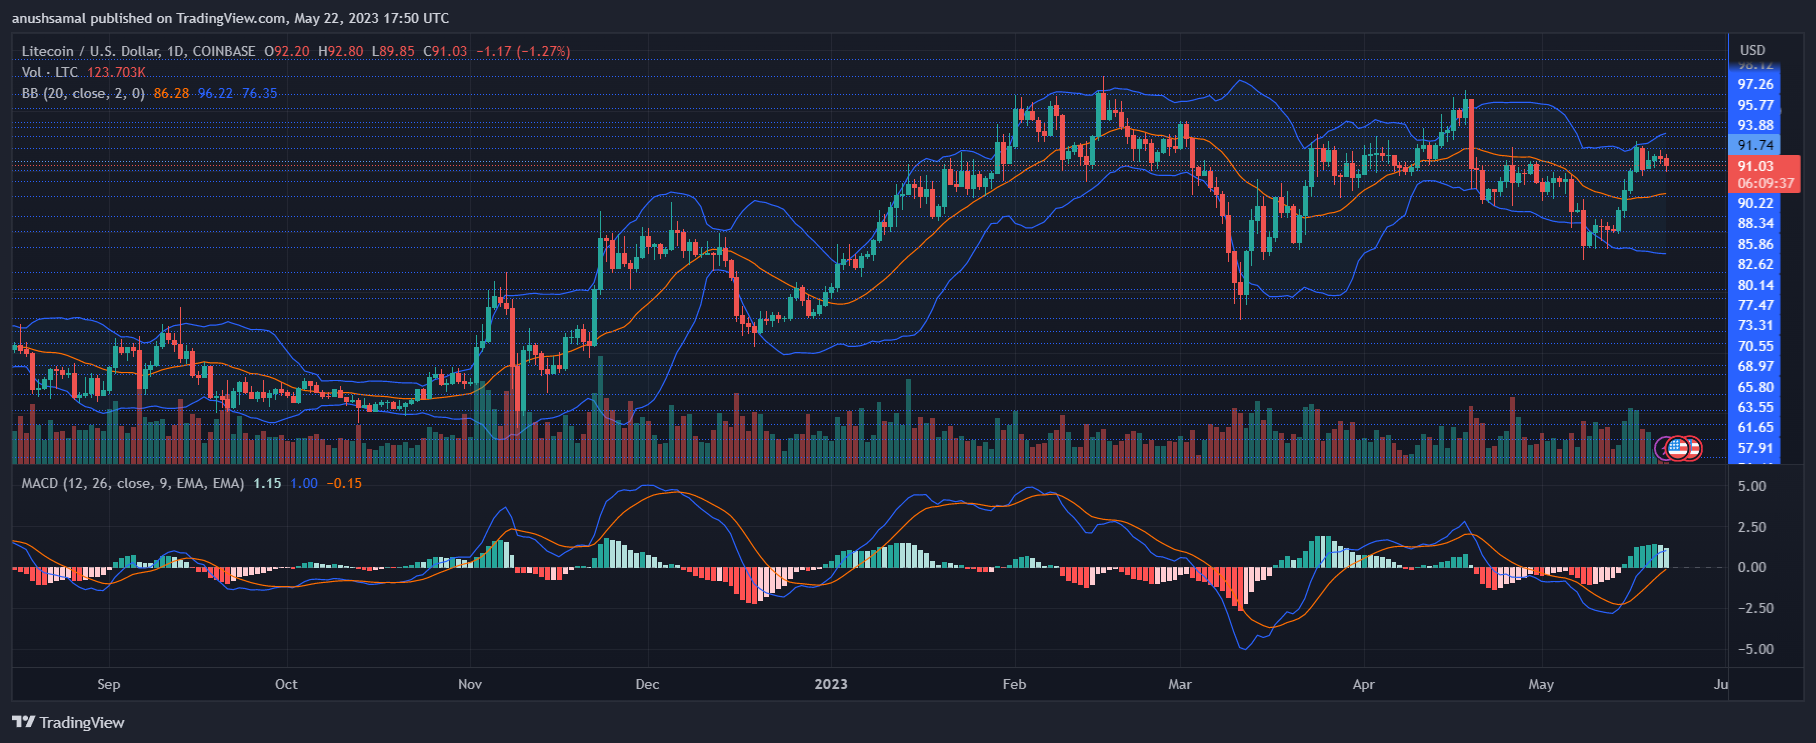
Source: LTCUSD on TradingView.com
In the stated case, the price is likely to continue higher toward the $88.50 and $90.00 levels. Any more gains might send LTC’s price toward the $95.00 resistance zone.
Are Dips Supported in LTC?
If Litecoin price fails to clear the $84 resistance level, there could be a downside correction. Initial support on the downside is near the $80.00 level.
The next major support is forming near the $77.80 level, below which there is a risk of a move toward the $75.00 support. Any further losses may perhaps send the price toward the $70.00 support.
Technical indicators:
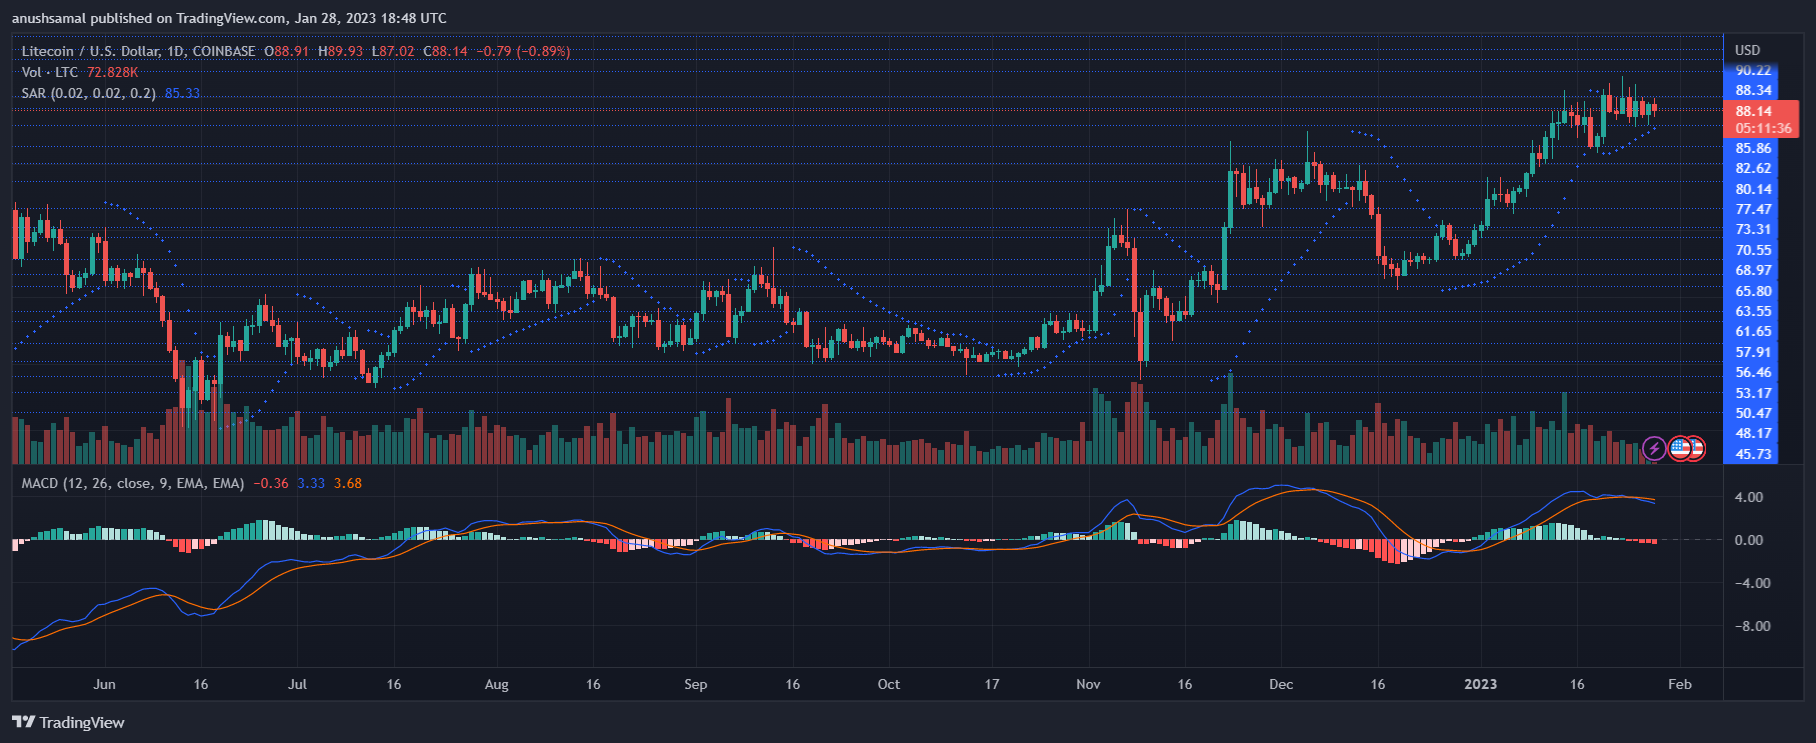
4-hour MACD – The MACD is now gaining pace in the bullish zone.
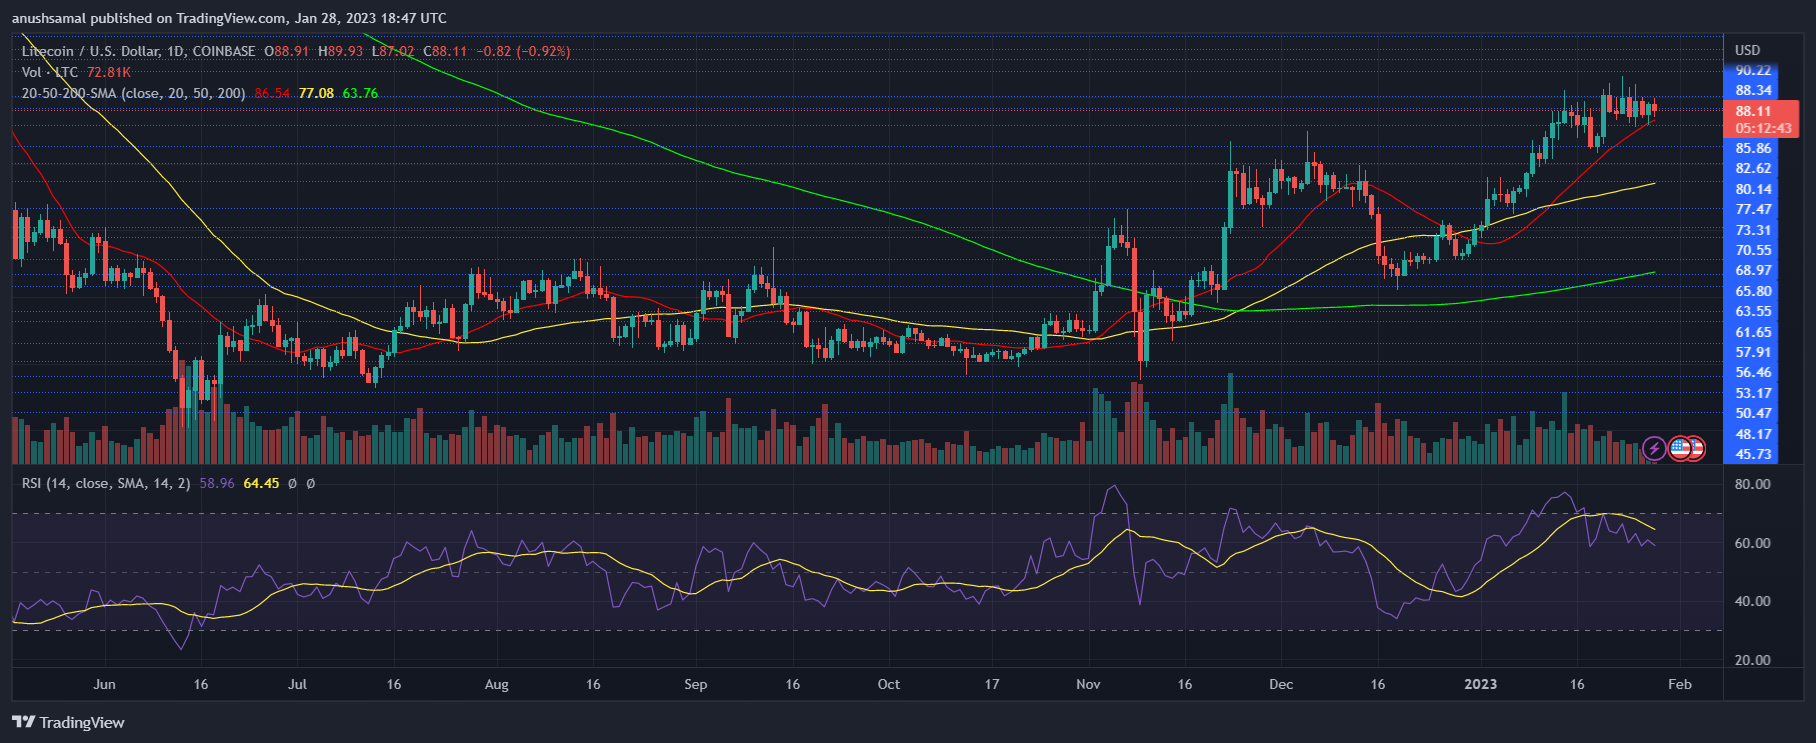
4-hour RSI (Relative Strength Index) – The RSI for LTC/USD is above the 65 level.
Major Support Levels – $80.00 followed by $77.80.
Major Resistance Levels – $83.00 and $84.00.


 on why I am more bullish on