Is The Bitcoin Run Over? Analyst Anticipates Further Upside

In the midst of recent market turbulence and widespread speculation about the future of Bitcoin, cryptocurrency analyst and trader, Crypto Jelle has offered an optimistic outlook for BTC, affirming that the crypto asset’s bull run is far from over, indicating its potential to rally even further in the upcoming months. 

The Strength Of Bitcoin Is Underestimated

Crypto Jelle’s analysis delves into Bitcoin’s current consolidation and the significance of the level. Following the recently concluded fourth Bitcoin Halving event, many people expect BTC to display immense price movement on the upside. However, the coin has not fully lived up to the expectations of several community members and crypto enthusiasts due to its present price consolidation.

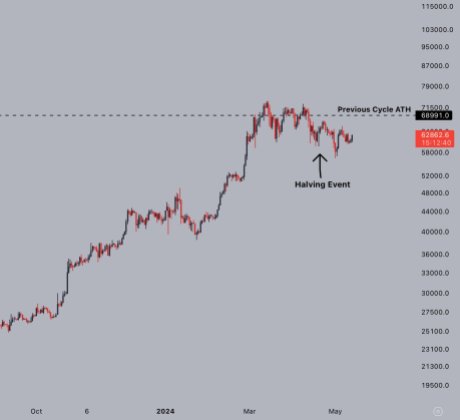
According to the Crypto Jelle, these people are actually underestimating how strong Bitcoin has proven to be thus far in this cycle. Jelle pointed out that the Halving event was only a few weeks ago, and BTC has been consolidating around the prior cycle’s all-time highs for several months now, suggesting a noteworthy development in comparison to past trends. As a result, the analyst believes the Bitcoin bull run is not over yet, predicting prices to reach a 6-digit level in the foreseeable future.

Bitcoin

The post read:

People underappreciate the strength Bitcoin has shown so far this cycle. The halving event happened mere weeks ago, and yet we’ve been consolidating around the previous cycle ATHs for months. This run is not over. Bring on 6-figure BTC.

Addressing the recent price corrections, Jelle claims pullbacks in the bull market are essential in order to rid the markets of enthusiasm and greed. Following weeks of Bitcoin gradually declining, particularly by 23%, market optimism has subsided, and it is now seen as audacious to be bullish. 

Thus, Crypto Jelle underscores that the potential of this market to surge higher lies within the crypto community members’ confidence in the market amidst troubling times like this.

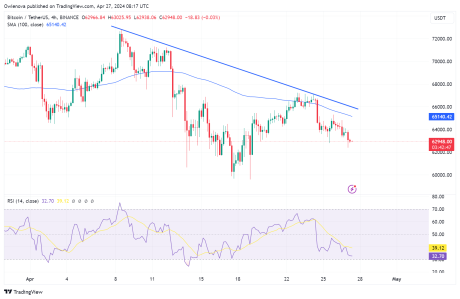
The crypto analyst highlighted that Bitcoin is still trading within a 7-year-old channel. Should this post-Halving consolidation mirror past trends, the expert is confident that the best is still to come, predicting a break out from the 7-year-long channel could send BTC to the $100,000 price level.

BTC Price Action Looking Good

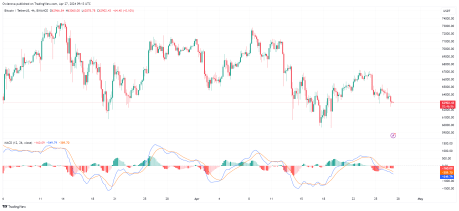
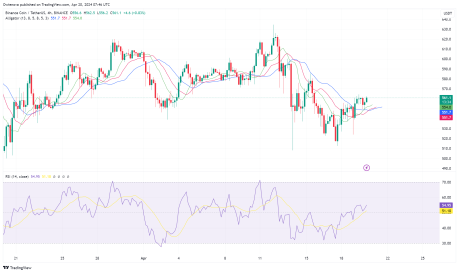
Crypto Jelle has also identified some indicators that show BTC’s price action today is looking good. Drawing attention to the 100-day Exponential Moving Average (EMA), Jelle pointed out a bullish MACD cross below the zero line, marking the first higher low in a longer time. Due to this, Bitcoin’s price looks promising as it is almost done with its full reset.

Also, looking at the 21-week EMA, the crypto asset has pulled back into the key support level at $62,408. Jelle, on the other hand, does not consider this development as one to be worried about, urging investors to stick to their Bitcoin investment.

Presently, Bitcoin is demonstrating a bullish momentum, rising from around $60,790 to about $63,100. At the time of writing, BTC has increased by over 2% in the past day, trading at $62,570. Its market cap has also risen by 2.41%, while its trading volume is up by 69% in the last 24 hours.

Bitcoin

Avalanche (AVAX) Price Dips As Market Turbulence Persists

AVAX is the native utility token of the Avalanche blockchain. The token is currently ranked 12th by market cap, with a total supply of 440,043,419 AVAX and a total trading volume of over $396,250,098 in the last 24 hours. Since its recent pullback at $36.15, AVAX has continued to move downward.

Currently, the general cryptocurrency market is bearish. This has led to the price of AVAX dropping below the 100-day Simple Moving Average (SMA) and the price might continue to drop in the next couple of days. As of the time of writing, the price of AVAX was trading around $33.52 and about 0.22% down in the last 24 hours.

Technical Indicators Point Toward A Sustained Downtrend For AVAX

To figure out where the AVAX price might be headed next, the following indicators can be used to examine the chart.

4-Day MACD: A technical look at the MACD indicator from the 4-hour timeframe, the MACD histograms are trending below the zero line, and both the MACD line and the Signal line crossed each other while trending below the MACD zero line, indicating a continuous movement on the downside. This can be seen in the below image.

AVAX

4-Day RSI: The formation of the Relative Strength Index (RSI) in the above image also suggests a downward continuation movement as the RSI signal line is seen to have moved above the 50% level and then dropped below it. This suggests that sellers are still very much active in the market therefore overpowering the strength of buyers.

Alligator Indicator: A look at the alligator indicator from the 4-hour time frame shows that AVAX is trading below the alligator lines as the alligator lip and teeth have both successfully crossed above the alligator jaw. It can also be seen that the price tried to move above the alligator lines but failed to do so, suggesting that the price might continue to move in its downward direction.

AVAX

The Coin Could Form A New Low

Conclusively, from the previous downward movement, AVAX has formed two resistance levels of $39.94 and $36.15 and a support level of $30.34. Currently, AVAX is moving toward this support level and if it breaks above this level, the price might drop even further to create a new low. 

On the contrary, if the price fails to break above this support, it will reverse and start an upward movement toward its previous resistance level of $36.15. Should AVAX manage to break above this resistance level, the price might move further to test the $39.94 resistance level.

AVAX

MATIC Bullish Signals Abound: Technical Indicators Hint At Sustained Uptrend

MATIC is the native utility token of the Polygon blockchain and it is currently ranked 18th by market cap, with a total supply of 10 billion MATIC and a total trading volume of over $204 million in the last 24 hours. It has been moving upward since its last rejection at a $0.6342 support level.  

Following the recent bullish trend of the crypto market, MATIC has not been left behind as the price has been on an uptrend with very strong momentum for a while now. Since its last rejection point, MATIC has seen a price reversal of over 10%.

Technical Indicators Point Toward Sustained Uptrend For MATIC

To figure out where MATIC’s price might be headed next, several indicators can be used to examine the chart;

1-Day MACD: A technical look at the MACD indicator from the 4-hour timeframe, the MACD histograms are trending above the zero line, and both the MACD line and the Signal line have crossed and are heading towards the MACD zero line, indicating a bullish trend.

MATIC

1-Day RSI: the formation of the Relative Strength Index (RSI) in the above image also suggests an upward movement as the RSI signal line is seen moving toward the 50% level. This indicates that buyers are gradually becoming active in the market therefore overpowering the strength of sellers.

4-hour Alligator: A look at the alligator indicator from the 4-hour time frame shows that the crypto asset is trading above the alligator lines as the alligator lip and teeth have both successfully crossed above the alligator jaw, suggesting that the price might continue to move in an upward direction.

MATIC

Potential Price Movement

From the previous downward movement, the price of MATIC has managed to create one major resistance level of $0.7365 and one major support level of $0.6324. Currently, MATIC is moving toward this resistance level and if it breaks above this level, it might go even further to test the next resistance level of $0.7680. 

However, if it fails to break above this major resistance, it will reverse and start a downward movement toward its previous support. Also, if it manages to break below this support level, the price might move further downward thereby continuing on its downtrend. As of the time of writing the price of MATIC was trading around $0.7253 and about -0.94% down in the last 24 hour

MATIC

Bitcoin Drops Below 4-Hour MA – Bearish Trend Ahead?

Following a pullback, the price of Bitcoin has continued on its downward movement. The coin, after failing to break above the 100-day Simple Moving Average (SMA) and the trend line has experienced a drop of over 6% from its previous high.

Will the price of BTC continue to move in a downward direction or will it reverse and start moving in an upward direction?

As of the time of writing, the price of BTC was trading around $62,972 which is about 28% down from its all-time high and was down by 1.27% in the last 24 hours. Although the price is trading below the 100 SMA on the 4-hour chart, on the daily chart it is still trading above the 100 SMA.

Current Condition Of Indicators And What They Suggest

Looking at the chart, technically a support level and a resistance level of $59,653 and  $67,255 were formed respectively. However, there could be more support and resistance levels created if the price continues to move downward.

Bitcoin

4-Hour Moving Average: A technical observation of the chart from the 4-hour timeframe as seen in the image below reveals that the price is trending below the 100-day moving average. This suggests that the price is on a downtrend and could potentially move further downward.

4-Hour RSI indicator: The Relative Strength Index (RSI) indicator here suggests a downward trend as the RSI signal has crossed and is trending below the 50% line as observed on the above chart.

Bitcoin

The MACD indicator from the 4-hour chart also suggests that the price might continue to move downward as the MACD histograms are trending below the zero line. Both the MACD line and the Signal line have crossed and are trending below the MACD zero line, indicating a bearish trend, as seen in the above image.

Possible Outcome

With the setup of the above indicators, it can be suggested that the price of Bitcoin is still bearish and that there are possibilities that it could still move further downward.

If Bitcoin continues downward and breaks below the support level of $59,653, it could witness a deep correction to create a new support level. However, if the price fails to break below this support level, it could start an upward correctional movement towards its previous level of $67,255 and if it manages to break above this level, the price will begin an uptrend.

Bitcoin

BNB Resilience: Holding Firm At $560 – What’s Next?

The price of BNB hasn’t fallen below its previous low, and it’s showing some strong signs of heading up. After a spell of moving downward, the Binance Smart Chain’s native token is aiming for an upward bounce back towards its earlier high.

Technical Indicators Point Toward Sustained Uptrend For BNB

To figure out where the BNB price might be headed next, several indicators can be used to examine the chart:

BNB

4-Hour MACD: A technical look at the MACD indicator from the 4-hour timeframe, the MACD histograms are trending above the zero line, and both the MACD line and the Signal line have crossed and are heading towards the MACD zero line, indicating a bullish trend. This can be seen in the above image.

RSI 4-hour Timeframe: The formation of the Relative Strength Index (RSI) in the below image also suggests an upward movement as the RSI signal line is seen trending above the 50% level. This indicates that buyers are still very active in the market therefore overpowering the strength of sellers.

4-hour alligator: A look at the alligator indicator from the 4-hour time frame shows that BNB is trading above the alligator lines as the alligator lip and teeth have both successfully crossed above the alligator jaw, suggesting that the price might be starting a new rally.

BNB

At the time of writing, the price of BNB was up by 1.35% and was trading around $561 in the last 24 hours. BNB price is showing bullish signs and also forming a base above the $508.1 support level. Also, the price is trading above the bearish trend line and below the 100 Simple Moving Average (SMA) on the 4-hour chart.

Final Thoughts

From the previous downward movement, the price of BNB has managed to create one major resistance level of $635 and one major support level of $508. Currently, BNB is moving toward this resistance level and if it breaks above this level, the price might go even further to create a new high. 

On the other hand, if the price fails to break above this major resistance, it will reverse and start a downward movement toward its previous support and if it manages to break below this support level, the price might move further downward thereby starting a new downward trend.

BNB

Avalanche (AVAX) Downtrend Persists Amid Market Uncertainty

Generally, the cryptocurrency market is bearish at the moment, with coins like Avalanche (AVAX), Ethereum, Litecoin, XRP, Solana, and others all caught in this trend. Currently, the price of AVAX is on a strong bearish move below the 100-day Moving Average (MA) and could continue in that direction for a while before retracing.

Technical Indicators Suggest A Bearish Trend For Avalanche

Observing the chart from the 4-hour timeframe, AVAX has crossed below both the 100-day moving average and the trend line. This could mean that the price is on a downward trend. The MACD indicator on the 4-hour timeframe suggests a very strong bearish movement as the MACD histograms are trending below the MACD zero line.

Avalanche

Also, both the MACD line and MACD signal line are trending below the zero line. Given the formation of the MACD indicator, it shows that there is a possibility that the price will still move further downward.

Furthermore, the Relative Strength Index (RSI) also on the 4-hour timeframe suggests a bearish trend as the RSI signal line is trending around the oversold zone. Despite the potential of a retracement at this point, the price will drop more following this.

Avalanche

The alligator indicator is another powerful tool used to determine the trend of an asset. A look at the above image shows that both the alligator’s lip and teeth have crossed over the alligator’s jaw facing the downward direction. This formation suggests that the trend is bearish and that the price could witness a deeper decline.

What Could Happen Next

Based on the price’s previous movement, there are two major resistance levels of $50 and $59.99 and a support level of $39.95. As Avalanche is on a negative trajectory, if prices manage to break below the support level of $39.95, it could trigger a move further toward the next low of $27.53.

On the other hand, if the price fails to break below its previous low, it might start an upward correction movement toward the resistance level of $50.80. However, if it manages to break past this level, AVAX might move even further toward the $59.99 resistance level.

As of the time of writing, the Avalanche was trading around $38, indicating a decline of 1.75% in the last 24 hours. Its market cap is down by over 16%, while its trading volume has increased significantly by nearly 250% in the past day.

Avalanche

Dogecoin Rally Intensifies: Eyes Set On Historic New Highs

After a retracement from its current high of $0.22960, the price of Dogecoin (DOGE) looks like it is not yet done as the memecoin bounced back and moving toward its current high.

Dogecoin Price Technical Analysis

Dogecoin is one of the few memecoins that have captured the hearts of many crypto investors. Like Shiba Inu and Pepecoin (PEPE), Dogecoin is backed up by a strong and exciting community which has played a huge role in its success so far. 

At the time of writing, the price of DOGE was trading around $0.19713 and was up by over 5% in the last 24 hours. Also, the price is currently trading above the 100-day moving average with very strong bullish momentum in the 4-hour timeframe.

The MACD indicator in the 4-hour timeframe suggests an upward spike. This is so because the MACD line and the MACD signal that was trending below the zero line have both crossed, heading toward the MACD zero line. 

If the MACD line and the MACD signal line manage to cross above the MACD zero, Dogecoin might move higher to create a new high. Meanwhile, the MACD histogram is already trending above the zero line which suggests a bullish momentum.

Dogecoin

The Relative Strength Index (RSI) on the 4-hour timeframe also indicates a bullish momentum toward the upward direction as the RSI signal line has crossed above the 50% level and is heading towards the overbought zone. According to the RSI indicator, the strength of the upward movement is still very strong as buyers are still very active in the market.

Potential Retracement On The Downside

Given the price’s previous surge, two major resistance levels and one major support level were created around $0.22960, $0.2244, and $0.19622 respectively. If the price of DOGE manages to move above the resistance level of $0.22441 level, it might move even further upward toward the resistance level of $0.22960. 

At this point, if the price succeeds in breaking above this level, the price might surge higher to create a new high. On the other hand, if the price fails to break above this resistance level, the price might start a new downward movement toward its previous support level of $0.19622. However, a breakout below the $0.19622 level could trigger a new downward trend.

Dogecoin

Arbitrum (ARB) Poised For Resurgence: Downtrend Reaching Climax?

Generally, the crypto market has been experiencing a pullback after Bitcoin and many other coins like Ethereum have recorded a new all-time high of which Arbitrum (ARB) was not left behind.

Arbitrum, which has a lot of potential with a market cap of over $3.8 billion and a circulating supply of 2,653,939,384 ARB has been trading below the 100-day Moving Average (MA) for some time now. However, recently the price of ARB has been showing some signs of reversing.

As of the time of writing, Arbitrum was trading around $1.45, indicating an increase of 1% in the last 24 hours. There are currently two major resistance levels of $1.799 and $2.278 ahead of the price.

Technical Indicators Show Signs Of Upward Movement In Arbitrum Price

4-hour RSI Indicator: Looking at the Relative Strength Index (RSI) indicator from the 4-hour timeframe, we can see that the RSI line is rising above the oversold zone and is heading toward the 50 level. This indicates a rise in the price, and if the RSI line rises above the 50 level, it might trigger the start of a new trend. 

The image below reveals more:

Arbitrum

4-hour MACD: looking at the formation of the MACD indicator from the 4-hour timeframe in the above image, we can also see that both the MACD line and the signal line having trended for a while below the MACD zero line have both crossed and are heading towards the MACD zero line. 

On the other hand, the MACD histogram is already trending above the MACD zero line. This suggests that a change in direction might soon happen from its downward movement to an upward movement.

1-hour bull power vs bear power histogram indicator: lastly, taking a good look at the chart from the 1-hour time frame with the help of the bull power vs bear power indicator, it shows that the histograms are already trending above the zero level. This suggests that buyers are gradually taking over the market from sellers as seen in the image below.

Arbitrum

In conclusion, if the price of Arbitrum manages to change its direction from downward to upward direction, it is possible that ARB could retest its previous major resistance levels of  $1.799 and $2.278 and even move further to create a new peak. Nonetheless, if Arbitrum fails to move upward, the crypto asset’s price might move further downward to create a new low.

Arbitrum

Ethereum Drops Below The 100-Day Moving Average – What’s Next?

The crypto market is experiencing a pullback after Bitcoin, the leading cryptocurrency, reached a new all-time high. However, Ethereum (ETH) is not left out in this downward move.

After setting a new yearly high of $4,094, the price of Ethereum has been moving downward and this has led to the price trading below the 100-day Moving Average (MA) both in the 1-hour and 4-hour timeframes, but this is not so in the daily timeframe. 

Will the price continue downward or will it change direction and start moving upward? At the time of writing, Ethereum’s price was trading around $3,360 and was up by 0.64% in the last 24 hours.

Ethereum Indicators And What They Suggest

Looking at the chart, technically we can see that a support level of $3,067 and a resistance level of $3,681 and $3,591 have been formed respectively. Nonetheless, there could be more support and resistance created if the price continues to move downward.

4-Hour Moving Average: A technical observation of the chart from the 4-hour timeframe as seen in the image below reveals that the price is trending below the 100-day moving average. This suggests that the price is on a downtrend and could potentially move further downward.

Ethereum

 4-Hour RSI indicator: With the help of the Relative Strength Index indicator (RSI) we can see the RSI signal line is trending below the 50 line. This is a strong indication that the price of Ethereum is in a downward trend as observed in the image above.

MACD Indicator: Taking a close look at the MACD indicator in the 4-hour timeframe, it appears that the MACD histogram has dropped below the zero line. In addition, both the MACD line and the signal line have crossed below the zero line. 

This setup indicates that the price is still bearish and there are possibilities that it could still move downward. The image below provides more details:

Ethereum

Possible Outcome

If the price of Ethereum continues downward and breaks below the support level of $3,067, it could move further downward to create a new support level. However, if the price fails to break below this support level, we could see a price reversal and may start a fresh trend upward. Thus there could be a possibility that the price could break above the resistance levels of $3,681 and $3,591 respectively, and continue its bullish run.

ORDI Rockets To Unprecedented Peaks Alongside Bitcoin’s $42,000 Breakthrough

The value of ORDI has increased significantly during the last week, more than tripling, following an astonishing climb. This noteworthy increase aligns with the upward trend of Bitcoin’s value, adding to the cryptocurrency’s recent surge in popularity.

A remarkable occurrence was the overnight rise of ORDI to an unprecedented all-time high, which injected excitement into its recent performance.

Based on the Ordinals protocol of Bitcoin, the token is by far the largest BRC-20 asset. It reached a new peak price of $49.05 today, according to CoinGecko data, after rising 16.3% over the previous day and an astounding 148% over the previous seven days. The fact that ORDI has increased by more than 500% during the past 30 days is similarly astounding.

ORDI Surges: Technicals Mirror Bitcoin’s Bull Market

The market value of ORDI has increased by more than 380% in the past year. These performance gains have demonstrated a significant relationship with the characteristics of the Bitcoin market, raising the prospect that ORDI may follow Bitcoin’s lead during the bull market.

Furthermore, one important technical indication is to support the optimistic viewpoint. The 4-hour chart’s Moving Average Convergence Divergence (MACD) and Relative Strength Index (RSI) both show positive movements.

Interestingly, the RSI reached 90.24, indicating an overbought state that can indicate a possible decline in price. On the other hand, the MACD’s bullish momentum suggests that there is still buyer interest and that the price will probably continue to rise.

ORDI has had tremendous growth since its founding as a technical experiment on Bitcoin in early 2023. With a $903 million market capitalization, ORDI is the most valuable cryptocurrency by market valuation, ranking it 63rd overall and first within the BRC-20.

Regarding social dominance, Santiment data indicates that ORDI has had an upward trend.

ORDI Doubles In A Week Alongside Bitcoin’s 20-Month Highs

ORDI’s recent surge, fueled by adoption from major exchanges like Binance and OKX, saw its largest increase in the past week, doubling in price. This coincided with Bitcoin reaching its highest point in 20 months, exceeding $42,000.

Bitcoin’s 20% rise over the past month, currently at around $41,800, further emphasizes the synchronized momentum of both cryptocurrencies since ORDI’s launch.

Thanks in part to increased activity on the Ordinals protocol, market analysts continue to have a positive outlook for ORDI. With a varied content library and over $46 million in total inscriptions as of writing, ORDI’s popularity inside the Bitcoin network has increased in tandem with the rise in transaction fees. It is a crucial component of the network.

Meanwhile, Coincodex predicts a 104% increase to $55.74 during the course of the following year. ORDI would have reached a new all-time high following its most recent breakout, which coincided with price discovery.

(This site’s content should not be construed as investment advice. Investing involves risk. When you invest, your capital is subject to risk).

Featured image from Freepik

XRP Price Set To Explode: Analyst Identifies Trigger For Next Parabolic Move

Crypto analyst JD has once again commented on XRP making a “parabolic” move. This time around, he has identified exactly what needs to happen for the crypto token to enjoy a significant rally

All Eyes On The MACD

In a post shared on his X (formerly Twitter) platform, JD highlighted the MACD (Moving Average Convergence Divergence) as the trigger for the crypto to enjoy a significant rally. He noted how XRP went “parabolic” the last time the MACD crossed the 0 level. According to him, that hasn’t happened this time, but the market seems very close to that level. 

JD shared an accompanying chart to elucidate his point. From the chart, one could see that XRP enjoyed a 650x gain the last time the MACD crossed 0. This significant breakout, which came in 2017, happened after a 4-year trendline that dated back to 2014. 

This time, the coin has consolidated for a longer period as he highlighted an 8-year trendline that dates back to 2017. He expects the market to instantly become bullish if there can be a breakout from that trendline. For now, JD believes that a bullish cross is still in play despite the fact that the MACD is below 0. 

In response to his post, another X user stated that “it’s game over” once XRP crosses the $0.92 price level. JD seemed to agree as he stated that it was going to happen. Meanwhile, the crypto analyst has remained cautious about giving a prediction as to what price level XRP could hit. However, from the chart he shared, XRP could rise to as high as $15, taking a cue from 2017.

Between XRP And Bitcoin

Crypto analyst Egrag Crypto has also given his view on the future trajectory of XRP in relation to Bitcoin. He spoke about a “Helheim Gate Way” scenario and how Bitcoin’s price could affect XRP’s. He said BTC surging to the 48k-50k range might exert pressure on XRP, causing it to decline against the flagship cryptocurrency

In this scenario, XRP’s decline is a result of Bitcoin apparently absorbing substantial liquidity, driving the latter’s dominance higher. However, things could turn out differently if XRP decides to “decouple and carve its unique path.”

Although this projection doesn’t seem favorable for XRP, Egrag noted that it could still be “remarkably bullish.” The reason is that liquidity could flow back “aggressively and abruptly” to altcoins like XRP once Bitcoin releases all the absorbed funds. Crypto analyst CrediBULL Crypto has once mentioned something in this regard. 

He stated that XRP’s price could decline in the short term as Bitcoin continues to enjoy a parabolic rise. He, however, mentioned that XRP will be one of the biggest benefactors once there is an “influx of new money.”

Featured image from iStock

Fantom (FTM) Price Surge Hints At Bullish Trend, What’s Ahead?

Fantom (FTM) has been on a bearish movement since April 19, 2023, resulting in a loss of about 30%. The price decline contributed to the negative market sentiment around the asset, making it hard for any possible retracement.

However, these days, some minor green candles indicate a potential bullish trend. This is because the price of Fantom experienced rapid price action recently as the bulls took back control and increased buying pressure.

Examining The Bullish Trend of Fantom (FTM)

The recent bullish momentum has triggered a significant price action resulting in a price increase in the general FTM market. The price of FTM has increased by 5.09% in the last 24 hours trading session, taking the token to a high of $0.3885.

Related Reading: Bitcoin Tweets Surpass Dogecoin Despite Meme Coin Craze

Also, with an increase of 57.26% in the 24-hour trading volume, the overall market cap is currently up by 5.09%. This data confirm the bullish momentum present in the asset.

Furthermore, the current significant buying and selling activities suggest a surge in market participation, likely leading to heightened price volatility.

The current market sentiment of Fantom (FTM) is Neutral, while the Fear & Greed Index is showing 50, meaning Neutral. This indicates that the market is stable, with no pressure from bears or bulls. 

The recent development and partnerships with SUPA Foundation also contribute to the bullish sentiment among investors and traders. 

As more individuals and institutions recognize the potential and value of the Fantom ecosystem, it’ll drive up buying pressure and support an upward price movement.

Fantom (FTM) Technical Analysis

Fantom currently trades above the 200-Day Simple Moving Average but below the 50-Day Simple Moving Average. This may indicate a mixed or transitional phase in Fantom’s price action.

The asset trading below the 50-Day SMA suggests a short-term weakness or a corrective phase in the price of FTM. Traders may use the 50-Day SMA as a resistance level preventing the FTM from moving higher.

The asset is trading above the 200-Day Simple Moving Average, indicating a potential long-term bullish price movement.

In general, the asset trading above the 200-Day SMA but below the 50-Day SMA suggests a phase where there’s a conflict between buyers and sellers. The Relative Strength Index confirms the present market indecision as Fantom is currently at the 44.53 region, which signifies neutral pressure.

The Moving Average Convergence Divergence (MACD) is slightly below the signal line, indicating a low pressure from the bears.

FTM trades between its support level of $0.3585 and resistance level of $0.4498, respectively. With increased bullish sentiment and buying pressure, FTM might hit the next significant resistance level of $0.5499.

Fantom (FTM) Price Surges Hinting A Bullish Trend, What's Ahead?

Conversely, if the bears increase selling pressure and the bulls fail to hold their positions, FTM might change the trend and drop sharply to the next support level of $0.3034.

Featured image from Pixabay and chart from Tradingview.com

Ripple CTO Labels BEN Coin As Scam, Bitboy Reacts

Ripple’s Chief Technology Officer (CTO), David Schwartz, responded to a tweet from a crypto enthusiast, calling the BEN Coin project a 100% rug pull. Schwartz asked the poster why he believed such but still stated his reservations about the new crypto project. 

So many crypto coins launch daily in the market. However, scam projects and rug pulls also deceive unsuspecting customers into investing.

A rug pull is a crypto scam where the project founder suddenly withdraws the project’s liquidity, disappearing with investor funds. This leads to a sharp price drop and losses for investors.

David Schwartz Expresses Reservations About BEN Coin

A crypto enthusiast believes the BEN coin project was a 100% rug pull. Reacting to the tweet, Schwartz asked the user if he believed the rug pull would occur in the future or if Bitboy’s involvement in the project was a rug pull. Schwartz further concluded that he believed one of those scenarios.

However, the popular crypto influencer Ben Armstrong, ”Bitboy”,  reacted to these allegations stating that they are products of ignorance and hate.

He further explained that he is a force to reckon with in the crypto space, participating in projects that affected over 99% of the community. Also, he explained that his company employs over 40 people.

According to Armstrong, he has produced two videos daily in the past five years, a testament to his commitment to educating the crypto community. 

Bitboy asked the crypto community to stop believing memes that can create a negative impression.

Also, in another tweet, Armstrong informed his followers that he was taking over the BEN coin project. He also agrees with @eth_ben, a Twitter user, that BEN coin’s liquidity and assets will be transferred to him in a week.

Notably, BitBoy stated earlier that the coin was launched to serve as the governance token for his DAO. Also, the BEN token launched and traded for two days before BitBoy announced its existence. 

How Is BEN Token Faring Today?

The token is gaining massive traction on the chart today as bulls seem to control the current scenario. It indicates price volatility for the asset in the bullish direction.

Ripple CTO Labels BEN Coin As Scam, Bitboy Reacts

Although BEN is relatively new, it has formed several highs and lows on the price chart as market forces act on its price.

-Featured image: Pexels, chart: TradingView

DASH Price Continues To Follow A Downward Trend, But Why?

One of the leading scalable payment providers in the world, DASH, has attained a significant level in the crypto industry. But like other cryptocurrencies, the price of DASH is subject to volatility, and its value can fluctuate significantly in a short period. 

Unfortunately, Since February 16, 2023, DASH has witnessed a loss of about 45.45%, bringing the coin down to $40.88.

This DASH downtrend has left investors and traders wondering what could be chasing the price down. 

Bearish Market Sentiment For DASH Pushes Price Downward

According to the 24-hour trading chart, the price has steadily decreased since the bears took full control of its market. This is a result of negative market sentiment towards DASH.

 DASH Price Continues To Follow A Downward Trend, But Why?

This report shows DASH’s market sentiment is bearish, while the Fear & Greed Index shows a neutral 51. Notably, data from Dash Explorer has observed that the Blockchain is experiencing more activities lately. This could be a long-term dump as investors fear to hold DASH further as Dash Explorer recorded that it has more output from its blockchain than input.

Today’s DASH price is $41.50, down by -5.89% in 24 hours. It is currently down by 17.00% within the last 7 days. But its 24-hour trading volume has gained 6.3% at $72 million.  

What Lies Ahead?

The crypto asset is trading below its 50-day and 200-day Simple Moving Averages (SMAs) and attempting to form a Death Cross. This is generally considered a bearish sign.

As DASH tries to form a Death Cross, it could lead to further selling pressure, as traders and investors may take this as a sign to sell their holdings or to take short positions. The SMA indicator suggests that both the long-term and short-term trend is bearish.

The Relative Strength Index confirms the bearish momentum as the high selling pressure is high. The RSI with a reading of 24.50 shows that DASH is currently in the oversold zone indicating a potential selling opportunity. 

The Moving Average Convergence Divergence (MACD) is below the signal line, and the histogram is below zero; this indicates a bearish trend.

When the MACD line falls below the signal line, it suggests that price trend momentum is slowing down and there’s an increase in selling pressure. In addition, when the histogram is below 0, it confirms that the bearish momentum and the decline may continue.

Overall, the combination of the above indicators suggests that the market is currently bearish, and traders should trade with an extreme risk management strategy.

Featured image from Pixabay and chart from Tradingview.com

Uniswap (UNI) Tanks As Bears Take Charge, Will The Bulls Come To Rescue?

According to Uniswap’s (UNI) price chart, the coin is moving sideways on the chart. As the market opened, the price dropped to $5.30, where UNI found little support.

Bulls are trying to regain control, but selling pressure is quite strong. The coin started exhibiting bearish momentum after April 19, 2023, when sharp crashes were observed in the chart. As of today, May 2, it has continued the bearish trend. 

UNI Price Trend In April

Uniswap opened in April at $6.0603 and t traded around the same price level at the start of the next day before recording a pullback to $5.9461 at the close of the market. Luckily, UNI regained its grip above $6 on April 4. 

Related Reading: Terra Classic Recent Efforts Could Benefit LUNC’s Growth Potential

UNI maintained the same price level from April 4 to 7 before dipping to $5.9191 on April 8. Thankfully, the price dip lasted for 5 days only. On the April 13 close of the market, UNI gained again above $6.

It remained at the level until April 20, when it lost the grip falling to the $5 price range and continuing till today, May 2. 

Uniswap (UNI) Tanks As Bears Take Charge, Will The Bulls Come To Rescue?

Will Uniswap (UNI) Recover From This Downtrend?

The price of Uniswap is $5.31 as of today, May 02, 2023, indicating a loss of 1.74%. Also, its market cap is down by 2.05% at $3.06 billion with UNI’s 24-hour trading volume down by 26.90% at $33 million.

The 1-day price chart for Uniswap price analysis indicates that the UNI bulls are doing their best to control the price decline. However, the bears are still in charge of today’s price trend. But despite being under selling pressure today, the value of UNI/USD has only decreased by 1.74% percent over the past 24 hours.

UNI price is in a zone where investors or traders are afraid to buy UNI, and holders will likely sell due to the current market sentiment. As such, the downtrend might continue, except the bulls build back the bullish momentum. 

UNI Key Price Levels

Based on the Uniswap chart today, the coin directly supports $4.628. If the bears continue this momentum, the next significant level is $3.341. The coin will have trouble breaking past the $7.761 resistance level with this low momentum. 

Since April 18, 2023, when the price of Uniswap fell below its 50-day SMA, this indicator has been indicating a SELL signal. 

Uniswap is also trading below the 200-day SMA. Since April 18, 2023, the 200-day SMA has indicated SELL for the previous 13 days. The Relative Strength Index (RSI) momentum oscillator is 38.58, which shows that UNI is neutral.

The MACD line is also below the signal line and trading in a downtrend, indicating bearish movement.

Featured image from Pixabay and chart from Tradingview

Why Weakening Bearish Bitcoin Momentum Could Give Bulls The Upper Hand

Bitcoin price has taken a beating over the last several months, resulting in the worst quarterly close since 2011. The bearish momentum has been brutal as crippling contagion spreads across the cryptocurrency market.

However, bearish momentum on weekly timeframes has begun to weaken, providing bulls with their first opportunity to capitalize in some time.

Bitcoin Bearish Weekly Momentum Begins To Weaken, Can Bulls Capitalize?

In the real world, momentum is the measure of velocity and mass. In finance, the term describes the rate of speed at which an asset’s price changes. Considering that Bitcoin price plummeted from above $60,000 to $20,000 in a matter of six months, bearish momentum has been a force to be reckoned with.

Related Reading | Bitcoin Weekly RSI Sets Record For Most Oversold In History, What Comes Next?

However, on weekly timeframes, the first signs of waning bearish momentum have been spotted.

Bearish momentum is weakening according to the LMACD histogram | Source: BTCUSD on TradingView.com

On the MACD histogram, bearish momentum is weakening as can be seen by the histogram changing from red to pink.

The current situation is not an all-clear signal. Momentum will only be considered bullish when the histogram passes the zero line and turns green.

A green signal isn’t always a worthwhile buy | Source: BTCUSD on TradingView.com

As the chart above demonstates, turning green doesn’t always confirm significant upside. So why then might bulls want to consider the current setup? As the saying goes, “when in doubt, zoom out.”

Related Reading | Bitcoin Monthly Tags Lower Bollinger Band, Tool’s Creator Hints At Bottom

Upon zooming out, bearish weekly momentum waning becomes more significant when you consider the level at which the shift in momentum is occurring. The weekly MACD is currently giving a reading of -0.20. Past bear market bottoms came in a fraction of a point below at -0.21.

Momentum is turning where past bottoms have been put in | Source: BTCUSD on TradingView.com

This is still no guarantee that bulls will regain the upper hand. However, could a third bottom at this level end up being the charm crypto holders were hoping for? Bulls will need to capitalize on the potential momentum shift, and follow through – pushing the histogram into the green.

Reclaiming $29,000 would be a strong first step, but given the potential of a recession ahead, investors would likely need more convincing at a return to $50,000 or above.

If bearish momentum returns before the week is over and pushed the histogram into the red, bulls can forget about a rally for a little while longer.

Follow @TonySpilotroBTC on Twitter or join the TonyTradesBTC Telegram for exclusive daily market insights and technical analysis education. Please note: Content is educational and should not be considered investment advice.

Featured image from iStockPhoto, Charts from TradingView.com