Why Monero Is Struggling To Crack This Resistance Level Since September

Monero (XMR), an open-source, privacy-oriented cryptocurrency launched in 2014, managed to reach the $151 marker on November 2 as it briefly rallied before it experienced slight price correction.

Here’s a quick glance at XMR trajectory:

  • Over the last two months, Monero traded at a narrow range that peaked at $152
  • Surpassing the crucial $156 marker will enable XMR to climb all the way to $172
  • Failure in increasing trading volume will most likely pull the crypto down to $148

At the time of this writing, according to tracking from Coingecko, the altcoin is changing hands at $149.10, going down by almost 1% over the last 24 hours.

The digital currency’s weekly, biweekly and monthly performance is relatively well, considering the crypto market was on an extended bearish momentum before the October 25 rally.

During the last seven days, Monero managed to go up by 1.5% while over the last two weeks, the asset increased by 2.8%. On a month-to-date gauge, XMR is on the midst of a 5.4% price surge.

Even with this kind of showing, the cryptocurrency is still nowhere close to its January 9, 2018 all-time high (ATH) of $542.33, already losing more than 72% of that value.

Monero Bulls Are Struggling

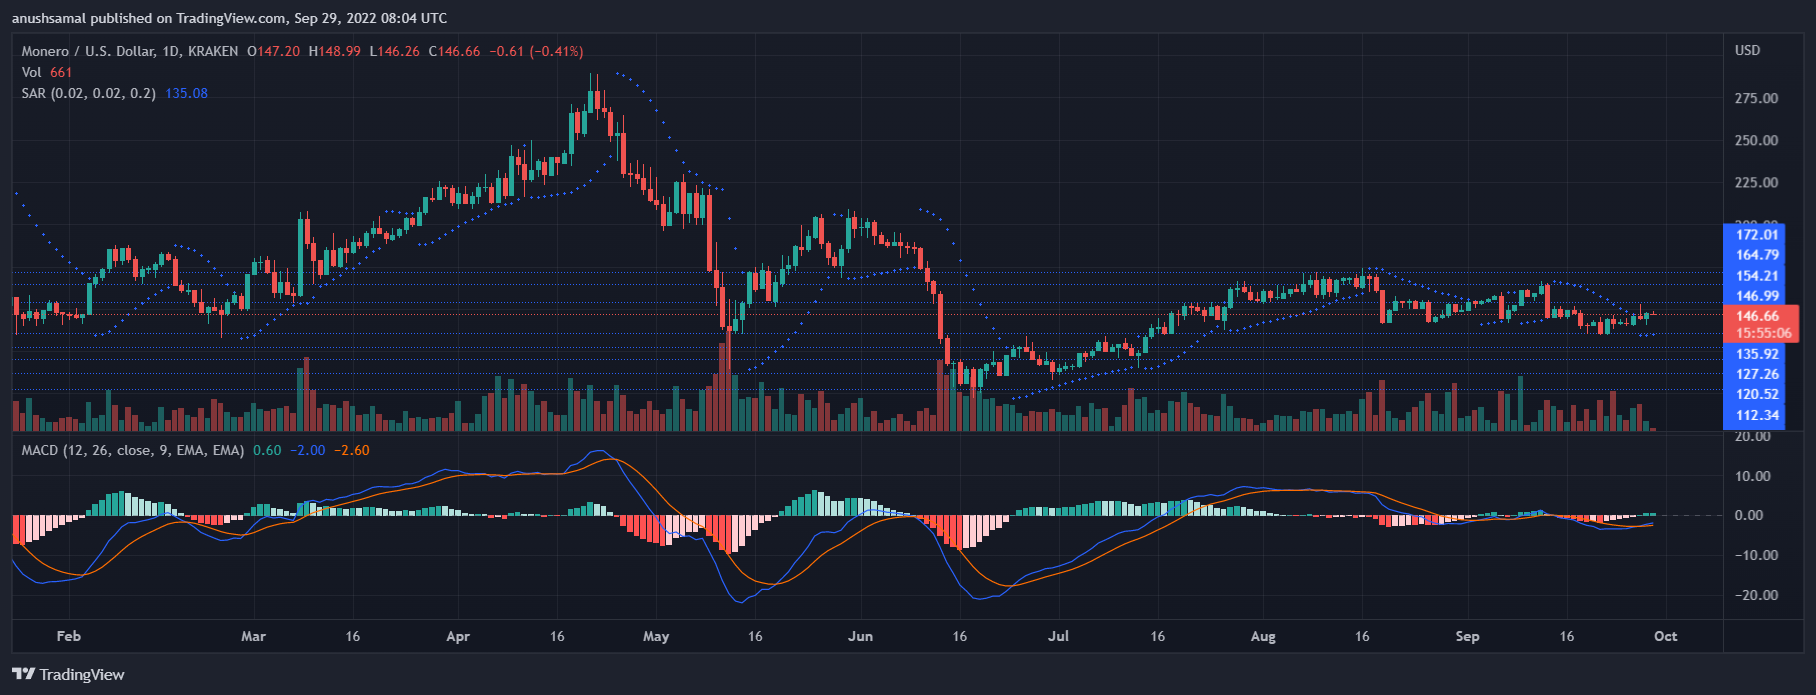
Since September, Monero traded within the narrow range of $152 and $136 as it was the subject of numerous bearish signals during the month, including a significant decrease in transaction count.

But XMR technical indicators now are showing signs of good buying pressure that may soon translate into a bullish rally.

Source: TradingView

For instance, the 12-hour Relative Strength Index (RSI) of Monero managed to climb above the 50-nuetral zone indicating that bulls, which struggled to break the resistance marker for the asset, were finally able to gain solid footing in the market.

Furthermore, XMR OBV was able to move past the resistance zone, denoting that the altcoin is primed for an upward momentum.

In summary, if the digital coin manages to reach, sustain and surpass the $156 marker, it will confirm the bullish signals sent by its technical indicators and will surge all the way up to $172.

However, should this happen without accompanying trading volume increase, the earlier thesis will be invalidated and XMR will be pulled back down to $148.

Price Forecast For Monero Also Bullish

Online crypto tracker Coincodex’s forecasts for XMR conform to the above technical analysis for the asset’s price movement.

Accordingly, over the next five days, the virtual coin is expected to reach its crucial resistance marker as it is forecasted to trade at $152.9.

Meanwhile, the next 30 days appears to be good for the digital asset as its spot trading price is seen to climb to even higher levels.

Coincodex believes Monero will trade at $159.12 30 days from now as it will enter the last month of 2022 with a value that is closer to the $172 target.

XMR total market cap at $2.7 billion on the daily chart | Featured image from Reddit, Chart: TradingView.com

Disclaimer: The analysis represents the author’s personal understanding of the crypto market and should not be construed as investment advice.

Monero Coin Climbs 6% In Last 3 Days – Bullish Activities Seen For XMR

Monero (XMR), an open-source cryptocurrency first focusing on privacy and decentralization, managed to initiate a price pump despite the greater majority of crypto space struggling to get out of the red zone.

  • Monero managed to bounce back twice from its support range of $134.5
  • XMR remains “in the green” for its intraday, weekly and monthly price readings
  • A surge all the way to $171 is possible for Monero if it moves past its current resistance range

The altcoin, for the past few days, has been on a consistent price increase, seeing all-green on its hourly, intraday, weekly and monthly levels.

At press time, according to data from Coingecko, Monero is trading at $146.56, being up by 1.8% over the last 24-hours. On a week-to-date and month-to-date basis, XMR increased by 1.3% and 4.5%, respectively.

But even with the recent price pumps, Monero is still far from its all-time high value of $542.33 that it hit on January 9, 2018.

Still, holders of the crypto should have plenty of reasons to be optimistic over the next days as the asset is leaning towards a bullish momentum.

Monero Price Analysis

XMR, just like the rest of its fellow altcoins, experienced rigid price correction as the crypto market plunged into yet another bearish cycle.

A look at the trading data and chart for Monero shows the cryptocurrency’s fall stopped at $134.5 marker which acted as its support range last month.

Source: TradingView

Buyers took advantage of the price dump but the struggles of the crypto market prevented XMR to move past the $151.8 mark despite bouncing back twice from the mentioned support level.

Caught in a parallel channel pattern, Monero, instead of continuing its decline, managed to start its bull run, steadily increasing its price by as much as 6%.

Volume activity is also working wonders for the asset as continued increase on it will push XMR price to $153, a level that might soon be established as the crypto’s next resistance range.

Given the nature of its current pattern, Monero could break the overhead trendline on its way to attaining the target trading price of $171.

Holders Must Remain Cautious

Forecasts from crypto data provider Coincodex indicate the bullish run of Monero will continue over the next five days.

With this, XMR is likely to breach the $153 resistance range to push its spot trading price at $154.49. This prediction supports the thesis that the asset will continue its bull momentum as it heads towards the next bear cycle.

From there, things will slowly take turn for the worse as the crypto is expected to drop below the $100 levels 30 days from now.

Specifically, Monero could be looking at trading price of $91.84 as there is extreme fear towards it according to its score in Fear and Greed Index.

XMR total market cap at $2.6 billion on the daily chart | Featured image from Smartereum, Chart: TradingView.com

Disclaimer: The analysis represents the author’s personal views and should not be construed as investment advice.

Monero Struggles In A Range Ahead Of $200 Rally, Will Price Breakout?

  • XRM price breaks down into a ranging channel as price failed to break above resistance, holding price from trending higher. 
  • XRM trades below 50 and 200-day Exponential Moving Average as the price struggles to regain bullish signs as the price continues ranging in a descending triangle. 
  • The price of XRM needs to break out of the descending triangle with good volume to rally high to a region of $200. 

Monero (XRM) prices continue to struggle as they range in a channel in an attempt to rekindle their bullish movement against tether (USDT). Monero (XRM) and other crypto assets experienced a relief bounce in recent weeks, which saw the crypto market cap look good for cryptocurrencies across the industry, with many producing double-digit gains. Monero (XRM) showed some relief bounces but was quickly rejected into a range price movement. (Data from Binance) 

Monero (XRM) Price Analysis On The Weekly Chart
Weekly XRM Price Chart | Source: XRMUSDT On Tradingview.com

Despite having a tough time in recent months with the price falling to a low of $100 with over 70% drop from an all-time high of $517. This incredible price movement was cut short due to the market condition. The crypto market has remained in a bear market for over six months, leading to many crypto assets retesting their weekly low while others hang on to key support.

After the price of XRM rallied to a high of $260, the price declined as it dropped to a weekly low of $100, where the price held strong after forming support, and this region looked like a demand zone for prices. 

The price of XRM bounced off from this region of $100 as the price rallied to a weekly high of $150 as the price faced resistance to breaking higher as the price continued to range in a channel. The resistance value corresponds to the Fibonacci ratios (Fibs) at 38.2%, acting as resistance for the price to go higher. For XRM to trend, a higher price must overcome the resistance at $150.

Weekly resistance for the price of XRM – $150.

Weekly support for the price of XRM – $100.

Price Analysis Of XRM On The Daily (1D) Chart

On a daily timeframe, the price of XRM remains below the 50 and 200-day Exponential Moving Averages (EMA), which is not conducive to an upward price trend in the short term. Prices of $150 and $162 correspond to the 50 and 200 EMAs, which act as resistance for XRM.

For the price of XRM to resume its bullish trend, it must break above $162 with good volume closing above it.

Daily resistance for the XRM price – $162.

Daily support for the XRM price – $100. 

Featured Image From zipmex, Charts From Tradingview 

Monero Price Continues Its Bullish Streak, Will This Be Its Next Trading Range?

Monero price has been bullish despite the broader market trends. Over the last 24 hours, XMR has continued moving up on its chart. It gained close to 4%.

In the past week, Monero price gained significantly as there was a 9% appreciation on the altcoin’s chart. The technical outlook for the coin was bullish on the one-day chart.

Monero has experienced low buying pressure over the past few days. The technical indicator now displayed that buying strength was recovering on the charts, which meant that XMR could be headed close to its next resistance mark.

With increased demand, XMR could hold onto its bullish momentum. The support zone for Monero price was between $146 and $136, respectively.

Bitcoin was also up on the charts, which has helped other altcoins make recoveries on their respective charts.

Monero has to move above the $146 price mark. That could only be possible if the demand for XMR continues to increase and remain consistent.

Monero Price Analysis: One Day Chart
Monero was priced at $146 on the one-day chart | Source: XMRUSD on TradingView

XMR was trading at $146 at the time of writing. The coin’s immediate resistance level was $154. The coin needs to move past that level for the bullish streak to strengthen on the chart.

The other tough price ceiling for Monero price to break past would be $163. The bulls have been rejected at that level for multiple weeks now.

On the flip side, if Monero prices go through a pullback, the first level for Monero would be $134. A fall below the $134 price mark could cause XMR to move down to $127.

The amount of Monero traded in the last trading session decreased, which indicated that selling strength had fallen at the time of writing.

Technical Analysis
Monero registered an increase in buying strength on the one-day chart | Source: XMRUSD on TradingView

XMR’s technical indicators have reflected the increase in buying strength, painting a positive price action. Selling strength on the chart declined, which could help XMR move up on its chart further.

At the moment, the Relative Strength Index moved up near the half-line, and buying strength and selling strength were almost even.

As the indicators displayed, the chart sided with the buyers more. Monero price moved up above the 20-SMA as buying strength recovered. It also meant that buyers were driving the price momentum in the market.

Monero registered buy signal on the one-day chart | Source: XMRUSD on TradingView

XMR’s other technical indicators are also inclined towards the bullish side. The Moving Average Convergence Divergence indicated the price momentum and overall price action.

The MACD underwent a bullish crossover and formed green signal bars, which was buy signal for the coin. The Parabolic SAR determines the price direction of a particular crypto.

The dotted line below the price candlestick means an upward trend for Monero price.

Featured image from The Street, Chart: TradingView.com

Monero Faces Pressure In Keeping Upward Pace – Will XMR Overcome Resistance?

Monero has its hands full trying to keep its momentum and rally forward. But, it must first overcome obstacles. As do other tokens.

The token is trying to keep up with the upward tilt. Remarkably, XMR price is trying hard to recover and keep up with the pace but it seems XMR is doing a great job as it’s currently on the green and winging it.

The daily price chart shows that XMR price is trying to soar upwards. Monero is gaining strides as it shoots up close to the top trendline of the channel. In order for XMR to rebound or go through the target resistance, the coin must maintain its current pace in terms of price.

Monero (XMR) Price Surges 4.33%

For XMR to shoot hoops at a bullish pace and breach the ascending parallel channel, the XMR bulls must push through its upward movement. However, it seems the bears are attempting to weaken the XMR market.

With a frail market, it is challenging for XMR and other cryptocurrencies to recover. XMR investors must hold it off until such time that the bulls can maneuver and maintain the current position found at the top trendline of the ascending parallel channel.

According to CoinMarketCap, Monero price is currently trading at $167.68 or showing off an increase of 4.33%. Trading volume was seen to drop by 6.88% as depicted in the intraday trading session. As of press time, bears try to drag the token towards the lower trendline of the ascending channel.

Bulls’ Accumulation Pivotal For XMR Price Rally

It would need more buyers for XMR price to leap quickly closer to the top trendline of the channel. But, the volume change also indicates that boosting the bulls’ accumulation is pivotal for XMR price to surge. For XMR to show significant recovery on the daily price chart, XMR price must move closer to the upper trendline.

The daily price chart for XMR price shows the formation of a rising parallel channel. More so, the technical indicators for Monero show the token’s downward trend in terms of momentum. RSI at 58 also shows a downward movement for XMR which is gearing close to a neutral zone.

MACD is showing the downward movement of XMR as it glides under the signal line following a failed crossover. Hence, XMR investors will need to wait on the sidelines for any changes on the daily chart.

XMR total market cap at $3.02 billion on the weekend chart | Source: TradingView.com

Featured image from The Market Periodical, Chart from TradingView.com

Monero Climbs To 5-Week Peak, Nears Key Resistance At $155

Monero (XMR) spiked to its peak levels in three months, in the face of challenges in the crypto market.

XMR has been gaining momentum since June 13 as it has been enjoying highest highs over the past few months.

The token has been on an uptrend for the fourth day in a row and today it’s at fever-pitch with an intraday high beaming at $153.09 3hich is considerably the highest gain it has had since June 13.

With this big move, XMR/USD has set its targets on a new resistance level at $155, which will be considered as the price ceiling for many traders. This new price ceiling will come in tandem with another resistance level.

Monero Going For A Bull Run At $175

Two things can happen: The bears might look at the market scenario as being overbought and will then reenter or can even push other bulls to vacate their recent positions. On the other hand, if a breakout happens, then Monero could push for a bull run toward a higher ceiling eyed at $175.

XMR was able to breach its support zone and is now trying to retest the trendline. XMR is currently going for an ascending triangle pattern.

Suggested Reading | Binance Coin Trading Volume Up 35% As BNB Spikes To $274

The XMR/BTC pair soared by 0.67% in market cap and is currently trading at 0.006390; evident in the past 24 hours.

XMR is showing a downtrend after it has successfully breached the long-term resistance zone and has turned the supply zone now at $135.

It has been retesting that resistance level by forming higher highs and higher lows. It has now tried doing the contrast and forming lower lows and lower highs for a shorter time frame.

XMR total market cap at $2.76 billion on the daily chart | Source: TradingView.com

The Monero coin has been showing a bearish movement as it was able to cross the long-term demand zone.

The bearish trend has caused the breakdown set at $200 giving away a sell-off signal. Now, the coin is trading under the supertrend line which works as a resistance.

So, if XMR can break out of its triangle pattern, it will show a bullish streak in price. If it cannot sustain the supertrend line of $200 then the price can further drop to $100.

Suggested Reading | Cardano (ADA), After 35% Spike, Locks On Next Target: $0.55

XMR Forms Falling Wedge Pattern

If the $135 supply zone is breached, then this can push the price up to $175. XMR is currently forming the falling wedge pattern as it shoots for lower lows and lower highs.

Consequently, the Average Directional Movement Index (ADX) has slumped over the past few days and it even further dipped below 20 with coin facing rejection at the $135 zone.

On the brighter side, the ADX curve is now seeing some recovery and went for an uptrend.

Overall, it’s looking bullish for the crypto as of press time with the resistance zone falling in between $135 to $175.

Featured image from Coin Central, chart from TradingView.com

Monero Soars 50% As Crypto Market Weakens, What’s Behind the Rally?

Popular privacy coin Monero (XMR) has been on a rally since the start of 2022. The cryptocurrency appears to be moving on its own as the crypto market trends sideways.

Related Reading | Monero And Zcash Take Off With 15% Gains, Here’s What May Have Spurred The Rally

Recently, XMR bulls are displaying more strength. At the time of writing, XMR trades at $285 with a 6% profit in 24 hours, a 34% and 50% profit in the last two weeks and 30-days, respectively.

XMR on an upward trend on the 4-hour chart. Source: XMRUSDT Tradingview

As announced by one of Monero’s maintainers via a post, the network will undergo an upgrade on July 16th, 2022, at the height of block 2.6 million. The “Fluorine Fermi” update will introduce new features to the network.

As the developer stated, Monero will increase its ring size from 11 to 16. The ring size is a term to refer to the total number of signers in an XMR transaction. As part of this network’s unique model, the update will provide users with more base privacy.

In addition, the network will implement an upgraded version of its Bulletproofs algorithm to decrease its transaction size by around 7%. This change is supposed to improve the network’s scalability by making “every transaction lighter and faster”.

On the latter, the network will reduce the wallet’s sync time by around 30 to 40%, the post said, and will implement a change to Monero’s fee model. Thus, users can expect to see an uptick in the network’s “security and resilience”.

As the update will be deployed via a Hard Fork, users and node operators will need to update their software. The maintainer made the following request to the users:

A new release will be announced before the network upgrade (around the 16th of June). You will only have to be using the updated software by the time the network upgrade occurs (16th July). To the end user, it will be like a simple software update.

#Monero will undergo a network upgrade on July 16th, 2022:https://t.co/9NKlGtqXAn

All users will need to do is keep their favorite wallet up to date, update their nodes once v0.18 is released (~June 16th), and enjoy even better digital cash afterwards 😎

— Monero (XMR) (@monero) April 20, 2022

Could Monero Be Spelling Danger For The Crypto Market?

It’s possible that Monero’s recent price action is due to its upcoming network update. As mentioned, they are substantial and will provide the users with interesting new features.

Data from Material Indicators (MI) records an increase in buying pressure from retail investors during April. At the same time, investors with ask orders larger than $10,000 have been selling into the rally. Unless larger investors classes step in, XMR could be at risk of a short-term decrease.

Retail (in yellow on the chart) buying into XMR’s price rally as larger investors sell or stay neutral. Source: Material Indicators.

Related Reading | Monero (XMR) Price Slides As Canada Includes Crypto In Emergencies Act

Additional data provided by Jarvis Labs indicates a potential danger for the entire crypto market. According to their “Dino Index” (comprise of Ethereum Classic, Zcash, Litecoin, Bitcoin Cash, and others), a metric to track the performance of these assets to show their inverse correlation with the crypto market, there could be some obstacles ahead. Jarvis Labs said via their Telegram Channel:

Quite evident that majority of the time when these dino coins rise and btc rises, better to look at profit taking or hedging the risk and look for market tops.

Source: Jarvis Labs via Telegram