Bitcoin Milestone Ahead? Analyst Forecasts New Peak This Month

In the face of a general market decline and pessimism, Captain Faibik, a cryptocurrency expert and enthusiast, has emerged with an optimistic outlook for Bitcoin (BTC) foreseeable future trajectory, predicting that the crypto asset could rise to a new all-time high before this current month closes. 

Bitcoin To Reach New All-Time High In May

Faibik’s analysis, which is based on his in-depth knowledge of cryptocurrency dynamics and a sharp eye for market trends, explores the possibility of a large short-term rise in Bitcoin. According to the analyst, Bitcoin is at a key junction currently testing the daily Moving Average 100 (MA100) level once more after recovering from it in the past.

Bitcoin

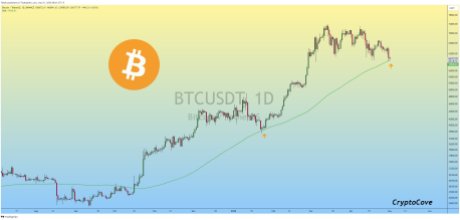
Historically, the crypto asset has found considerable support at the 100MA level. Should BTC recover from this point on, Captain Faibik anticipates a significant rise on the upside in the upcoming days. Thus, he expects the digital asset to reach a new all-time high within the month.

The post read:

Last time, BTC bounced back from the daily MA100, and now it is testing it again. If it bounces back from here, we can expect a Bullish Rally in the coming days. New All the High could be incoming this month

The crypto analyst noted Bitcoin’s price action in the daily timeframe also suggests that a bullish rise is on the horizon. Faibik stated that on the daily timeframe chart, BTC is still moving above the major trendline and inside the green box indicated in his chart. As a result, the analyst expects BTC to undergo a quick comeback.

Related Reading: If History Repeats, This Is How Bitcoin Price Will Perform In The Next 6 Months

Another notable finding from Captain Faibik is that the daily Relative Strength Index (RSI) has been drifting below a trendline that has been in place for some months. Although this might indicate a brief waning of positive momentum, Faibik interprets it as a sign of an impending price recovery for Bitcoin. Given that BTC is still moving inside the bullish flag pattern, the expert anticipates a bounce back towards $68,000 in the upcoming days.

$100,000 Price Target For BTC

Captain Faibik’s most bullish target for BTC recently is the $100,000 price mark. Last week, Faibik pointed out key narratives that could catalyze Bitcoin’s price to $100,000 in the coming months.

According to the expert, the presence of bullish investors in the market was the reason why BTC was trying to make a comeback in the previous week. Thus, for a significant price increase to $100,000, these investors must retake the crucial resistance level of $72,000.

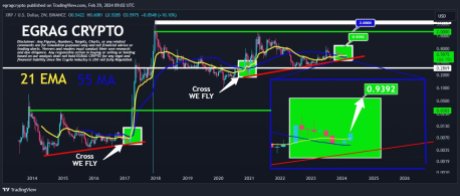
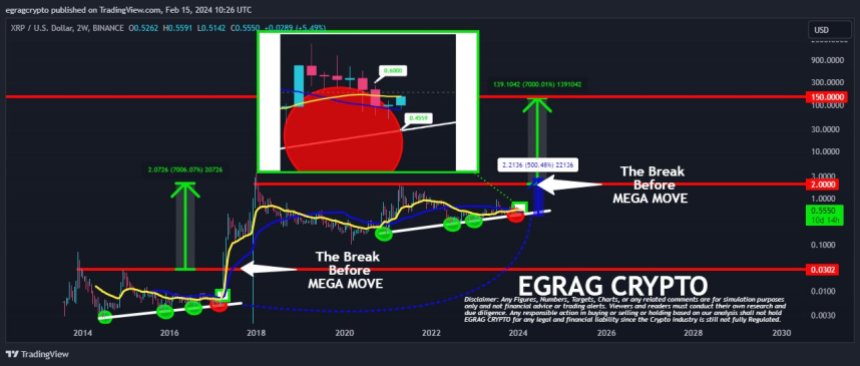
Furthermore, Faibik highlighted that BTC Bulls have solidly secured the weekly Exponential Moving Average (EMA) 10 following the October 2017 Descending Channel breakout. Due to this, the crypto analyst is setting $100,000 as the digital asset’s next price target.

Following a decrease of more than 13% over the previous 7 days, the price of Bitcoin is currently trading at $57,701. In the last day, its market cap has plummeted by over 6%, while its trading volume has increased by about 61%.

Bitcoin

Arbitrum (ARB) Poised For Resurgence: Downtrend Reaching Climax?

Generally, the crypto market has been experiencing a pullback after Bitcoin and many other coins like Ethereum have recorded a new all-time high of which Arbitrum (ARB) was not left behind.

Arbitrum, which has a lot of potential with a market cap of over $3.8 billion and a circulating supply of 2,653,939,384 ARB has been trading below the 100-day Moving Average (MA) for some time now. However, recently the price of ARB has been showing some signs of reversing.

As of the time of writing, Arbitrum was trading around $1.45, indicating an increase of 1% in the last 24 hours. There are currently two major resistance levels of $1.799 and $2.278 ahead of the price.

Technical Indicators Show Signs Of Upward Movement In Arbitrum Price

4-hour RSI Indicator: Looking at the Relative Strength Index (RSI) indicator from the 4-hour timeframe, we can see that the RSI line is rising above the oversold zone and is heading toward the 50 level. This indicates a rise in the price, and if the RSI line rises above the 50 level, it might trigger the start of a new trend. 

The image below reveals more:

Arbitrum

4-hour MACD: looking at the formation of the MACD indicator from the 4-hour timeframe in the above image, we can also see that both the MACD line and the signal line having trended for a while below the MACD zero line have both crossed and are heading towards the MACD zero line. 

On the other hand, the MACD histogram is already trending above the MACD zero line. This suggests that a change in direction might soon happen from its downward movement to an upward movement.

1-hour bull power vs bear power histogram indicator: lastly, taking a good look at the chart from the 1-hour time frame with the help of the bull power vs bear power indicator, it shows that the histograms are already trending above the zero level. This suggests that buyers are gradually taking over the market from sellers as seen in the image below.

Arbitrum

In conclusion, if the price of Arbitrum manages to change its direction from downward to upward direction, it is possible that ARB could retest its previous major resistance levels of  $1.799 and $2.278 and even move further to create a new peak. Nonetheless, if Arbitrum fails to move upward, the crypto asset’s price might move further downward to create a new low.

Arbitrum

Ethereum Drops Below The 100-Day Moving Average – What’s Next?

The crypto market is experiencing a pullback after Bitcoin, the leading cryptocurrency, reached a new all-time high. However, Ethereum (ETH) is not left out in this downward move.

After setting a new yearly high of $4,094, the price of Ethereum has been moving downward and this has led to the price trading below the 100-day Moving Average (MA) both in the 1-hour and 4-hour timeframes, but this is not so in the daily timeframe. 

Will the price continue downward or will it change direction and start moving upward? At the time of writing, Ethereum’s price was trading around $3,360 and was up by 0.64% in the last 24 hours.

Ethereum Indicators And What They Suggest

Looking at the chart, technically we can see that a support level of $3,067 and a resistance level of $3,681 and $3,591 have been formed respectively. Nonetheless, there could be more support and resistance created if the price continues to move downward.

4-Hour Moving Average: A technical observation of the chart from the 4-hour timeframe as seen in the image below reveals that the price is trending below the 100-day moving average. This suggests that the price is on a downtrend and could potentially move further downward.

Ethereum

 4-Hour RSI indicator: With the help of the Relative Strength Index indicator (RSI) we can see the RSI signal line is trending below the 50 line. This is a strong indication that the price of Ethereum is in a downward trend as observed in the image above.

MACD Indicator: Taking a close look at the MACD indicator in the 4-hour timeframe, it appears that the MACD histogram has dropped below the zero line. In addition, both the MACD line and the signal line have crossed below the zero line. 

This setup indicates that the price is still bearish and there are possibilities that it could still move downward. The image below provides more details:

Ethereum

Possible Outcome

If the price of Ethereum continues downward and breaks below the support level of $3,067, it could move further downward to create a new support level. However, if the price fails to break below this support level, we could see a price reversal and may start a fresh trend upward. Thus there could be a possibility that the price could break above the resistance levels of $3,681 and $3,591 respectively, and continue its bullish run.

XRP Poised for Growth: Analyst Forecast Bullish Movement Ahead

XRP witnessed an uptick this week moving closer to its 2024 high, but several trends have been cited by crypto analysts that could drive the token even higher in the coming months.

XRP Poised For A Positive Upward Trajectory

Crypto Egrag, a well-known cryptocurrency expert and trader, has shared his latest insights on the price action of XRP with the community on the social media platform X (formerly Twitter).

His analysis came in light of the general correction witnessed in the crypto market a few days back. Egrag’s latest predictions delve into XRP’s potential to reach a new all-time high in the upcoming months or bull cycle.

According to the analyst, XRP is presently demonstrating momentum to surpass a bullish cross in the short term. He anticipates this to happen within the year, putting his target around April and August.

Crypto Egrag has pointed out two historical instances which he dubbed Cycle 1 and 2 that suggest XRP could reach an unprecedented within the aforementioned timeframe.

XRP

While drawing parallels to these historical trends, Egrag noted that the first cycle, which sent XRP to its peak, took around 280 days to reach the level after making a bullish cross. Meanwhile, the second cycle took XRP about 140 days to reach the same price level after forming the cross.

Consequently, the expert is extending his analysis to a comparable timeframe and duration from these data points. Thus, he has identified precisely the dates between April 8 and August 26 in which his forecast could be realized.

Hitherto, Egrag has urged the crypto community to remain unwavering and keep a watchful eye on these two dates, marking a significant day for the crypto asset.

Egrag’s X post was part of a previous analysis he made in August last year. In the post, the expert noted that the asset has formed a bullish cross, which usually ignites its price.

However, Egrag believes that one does not have to be a Technical Analyst (TA) to identify this action. Specifically, the bullish cross was formed by the “constant struggle” of the 21 weekly Exponential Moving Average (EMA) and the 100 Moving Average (MA).

Projected Time For The Token To Reach The $0.9 Threshold

Dark Defender, another crypto analyst, has pinpointed a timeframe for XRP to reach the $0.9 price mark. According to Dark Defender, the token arrived at several support levels and began to form a third (3rd) wave.

The wave was formed as a result of the altcoin reaching the mid-level Orange Resistance. Defender anticipates the coin to range between $0.7707 and $0.9191 between March 10 and 13 this year. 

Furthermore, he has predicted a price target of $0.6462 by March 1. Nonetheless, taking into account XRP’s wary advances in recent times, Defender’s forecast seems to be very lofty. 

XRP

XRP Price’s 7,000% Pump: Analyst Foresees Massive Move If This Happens

XRP may not have had the best start to 2024, but several cryptocurrency analysts and enthusiasts are still bullish about the crypto asset, predicting a possible price surge to new highs heights.

Popular cryptocurrency analyst Egrag Crypto has made a daring prediction for XRP, suggesting a rise to a new peak. Egrag Crypto’s forecast delves into the token’s potential to reach the $2 price mark and way beyond.

XRP Poised To Skyrocket To A New All-Time High

In his projections shared on the X platform, the analyst noted that XRP is presently caught between the two moving average indicators, the 21-exponential Moving Average (EMA) and the 55-moving Average (MA).

As a result, Egrag crypto has predicted a potential 7000% price rally if XRP breaks out of the moving averages. However, the expert believes the rally will occur when XRP’s price reaches $2.2.

XRP

If such a rise occurs during the aforementioned price level, it will increase to about $139, according to Egrag. His forecasts are supported by historical data, which he uses to highlight a similar trend in the 2017 bull run.

It is noteworthy that before the 2017 bull run, XRP was similarly hedged between the 21 EMA and the 55 MA. On the other hand, XRP initially saw a price spike to $0.0302 following a breakout, and then it soared by 7,000% to the $2 mark. 

The analyst has underscored that about 99% of people might not comprehend his projections now. Nonetheless, when utility starts to take off, it might just be the start of a multi-decade trend.

Even though a breakout from the 21 EMA and 55 MA presents a possible rally, there is also a risk for a potential decline. According to Egrag Crypto, this position could lead to a decline to around $0.45.

He further claimed that XRP closing above $0.60 would be crucial, pushing the asset above the 21 EMA. Additionally, it will rise above the level of local resistance in a “candle style.”

Several Factors Of The Mega Move 

Following the prediction, Egrag has pointed out multiple aspects that set his predictions aside. “This could be the prelude to a mega move, a breakout that occurs once in a lifetime,” he stated.

The first aspect highlighted by the analyst is that if the rally takes place, XRP would conclude “the W Formation.” After that, it could “finalize the ascending triangle formation.”

Meanwhile, for the last aspect, he noted that “it could trigger a 500% rise” from the current price of XRP. This might potentially start a big price surge from higher levels. So far, Egrag has urged the crypto community not to be misled by his chart, as his forecast could be a life-changing opportunity.

XRP

Bitcoin Bearish Signal: 600-Day MA Starts To Break Down

Charts show the Bitcoin price seems to be falling below the 600-day moving average, a sign that could be bearish for the crypto.

Bitcoin Begins To Lose 600-Day MA Support Line As Price Crashes Below $39k Again

As pointed out by an analyst in a CryptoQuant post, the price of the crypto is crossing below the 600-day MA curve now, a line that has served as support for BTC in the past.

A “moving average” (or MA in short) is an analytical tool that takes the average of any quantity over a particular time period. As the name already suggests, this average constantly updates itself as time passes and new values arrive.

What this tool does is that it removes any short-term fluctuations from the chart being studied (which is the Bitcoin price in this context), and smooths out the curve.

This makes moving averages quite useful for studying long-term trends, where local variations aren’t that important.

Related Reading | Is Bitcoin Gonna See Another Big Drop Soon? Historical Trend May Say Yes

MAs can be taken over any possible range, whether that be two days, two hundred days, or even only two minutes.

Now, here is a chart that shows the trend in the 600-day MA version of the Bitcoin price:

Looks like the price curve is dipping below the 600-day MA line now | Source: CryptoQuant

As you can see in the above graph, the Bitcoin 600-day MA curve has acted as support for the coin’s price many times in the year so far already.

However, the latest trend seems to suggest that this support line is now breaking down as the price line is crossing below the MA on the daily timeframe.

Related Reading | Time Vs Price: Why This Bitcoin Correction Was The Most Painful Yet

Though, the breakdown may not be yet fully confirmed. The quant in the post believes that if the breakdown fails here, Bitcoin may then use the level as a springboard to push higher.

In the case that the breakdown does stand, then a bearish outcome may perhaps be in store for the cryptocurrency.

BTC Price

At the time of writing, Bitcoin’s price floats around $38.8k, down 1% in the last seven days. Over the past month, the crypto has lost 12% in value.

The below chart shows the trend in the price of the coin over the last five days.

Looks like the price of the coin has plunged down over the last few days | Source: BTCUSD on TradingView

Bitcoin briefly seemed to have been on the path of recovery just a few days back as the coin broke above the $42k mark.

However, the cryptocurrency now seems to have plummeted down again as it once more revisits the sub-39k levels.

Featured image from Unsplash.com, charts from TradingView.com, CryptoQuant.com

The Bear Signal That Suggests Another Bitcoin Crash Is Coming

Bitcoin has recently recovered above $40,000 to much fanfare from investors. This has been a long time coming given how low the digital asset had gotten following the market crash. It is a significant point to cross in the road to another bull rally. One thing though, is that the cryptocurrency still has a long way before it is back in bull territory, which market analyst Justin Bennett puts at the $45,000-$46,000 level.

As the market tries to work its way towards this bull trend, there are also signals that suggest that a bull rally is not the only likelihood in the near future of the digital asset. In fact, bitcoin recently tripped a trigger that suggests that the market is likely to fall into another crash before bulls can take proper hold of the values.

Bitcoin Falls Below 50-Day Moving Average

Indicators like the moving average and simple moving average can often point investors and traders towards the next steps in the market. For the longest time, bitcoin continued to trade above its 50-day moving average, suggesting a continuation of the bull rally, which has mostly been the case. This time, however, the digital asset has not been able to hold above this important metric.

Related Reading | Dave Portnoy Is Now A Bitcoiner, Thinks You’re An Idiot If You Don’t Hold Any

For the first time in over a year, bitcoin has traded below its 50-day moving average. Now, this may not seem like a big enough deal to pay attention to given that the cryptocurrency just started to mark another bullish recovery trend. However, it becomes more pertinent data to look at when we take a look at what has happened historically when this happens.

BTC falls below 50-day moving average | Source: TradingView.com

Bitcoin has only traded below its 50-day moving average three times previously. Each time that this has happened, the outcome has always been the same; there is a crash. It followed this in 2014, 2018, and 2019. Once again, bitcoin has failed to trade above the 50-day moving average, and if history is any indicator, then BTC could very well be headed towards a price crash.

Where Are The Points To Sell?

For bitcoin and other cryptocurrencies, there is never a ‘perfect’ point to sell given that it is near impossible to predict where the market will swing. However, placing buys and sells between indicators can help one come close.

Related Reading | Bitcoin Hits Two-week High Imitating The Stock Rally

This trader expects the digital asset to see further downside before the bulls take over. This means that investors who do not wish to hold for the long term must decide the best points to offload their bags before bitcoin continues to decline.

BTC selloff coming with breakout sellers | Source: TradingView.com

The current head and shoulders pattern will see breakout sellers target the current bullish trend, making it short-lived. The time between when these sellers emerge and when the current bull run ends will be the sweet spot. From there, the imminent crash will see bears take over the market, and fast, too.

BTC trading north of $42K | Source: BTCUSD on TradingView.com
Featured image from Bitcoin News, charts from TradingView.com