GameStop Stock And Wolverine Memecoins Explode As Roaring Kitty Returns To The Spotlight

GameStop, the video game retailer that took Wall Street by storm in 2021, has once again become the talk of the town as its share price surges 100%. 

Fueling this rally is the return of the influential social media figure Keith Gill’s “Roaring Kitty.” After a long hiatus, Roaring Kitty’s recent activity on social platforms, including an image and video, has ignited excitement among investors and triggered a renewed frenzy for GameStop’s meme stock and the emerging world of memecoins. 

GameStop Memestock Frenzy

The meme-stock phenomenon gained widespread attention in 2021 when cash-rich investors pumped up the stock market and bet against short-selling hedge funds. 

Keith Gill’s “TheRoaringKitty” account and the subreddit “WallStreetBets” played a pivotal role in the meme stock frenzy, driving stocks like GameStop and AMC Entertainment to surge over 1,000% by the end of the same year. 

While some early investors reaped rich returns, hedge funds such as Gabe Plotkin’s Melvin Capital Management suffered significant losses, leading to closures.

According to Bloomberg, short sellers betting against GameStop initially enjoyed gains in the year’s first four months. Still, the volatile nature of meme stocks quickly erased those paper gains. Per the report, “skeptics” were up an estimated $400 million from January to April before slipping into the red by Monday morning.

The percentage of GameStop shares sold short relative to those available for trading has remained at approximately 24%, a relatively high level for a typical company but significantly lower than the 140% levels witnessed during the 2021 mania

As GameStop’s shares gained momentum, the cost to bet against the company increased. Recent data from S3 indicates borrowing costs exceeding a 10% annual financing fee range.

Roaring Kitty’s Ripple Effect

Roaring Kitty’s influence extended beyond GameStop, as Wolverine-themed memecoins flooded various blockchains. In response to a social media post featuring a video of Marvel superhero Wolverine, more than 30 new tokens were launched on platforms like Ethereum and Solana, as data by Dextools shows. 

Notably, the newly minted “Roaring Wolverine” token on the Ethereum blockchain experienced an astonishing 80% surge within hours of its release.

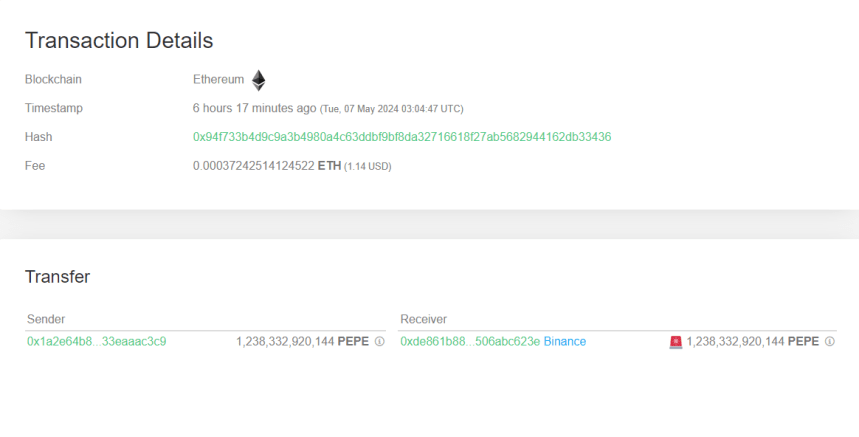
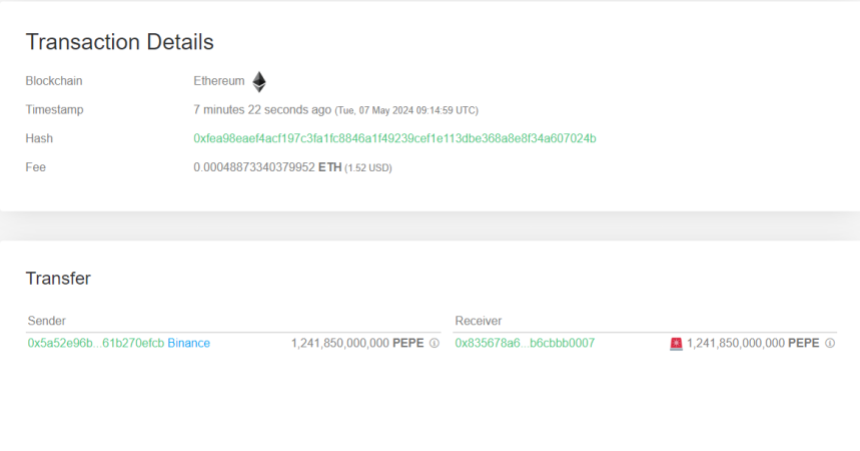
Furthermore, the memecoin market has witnessed a notable resurgence, with tokens such as Dogecoin (DOGE), Shiba Inu (SHIB), Pepe (PEPE), Dogwifhat (WIF), Floki Inu (FLOKI), and Bonk Inu (BONK) recording significant gains, according to CoinGecko data

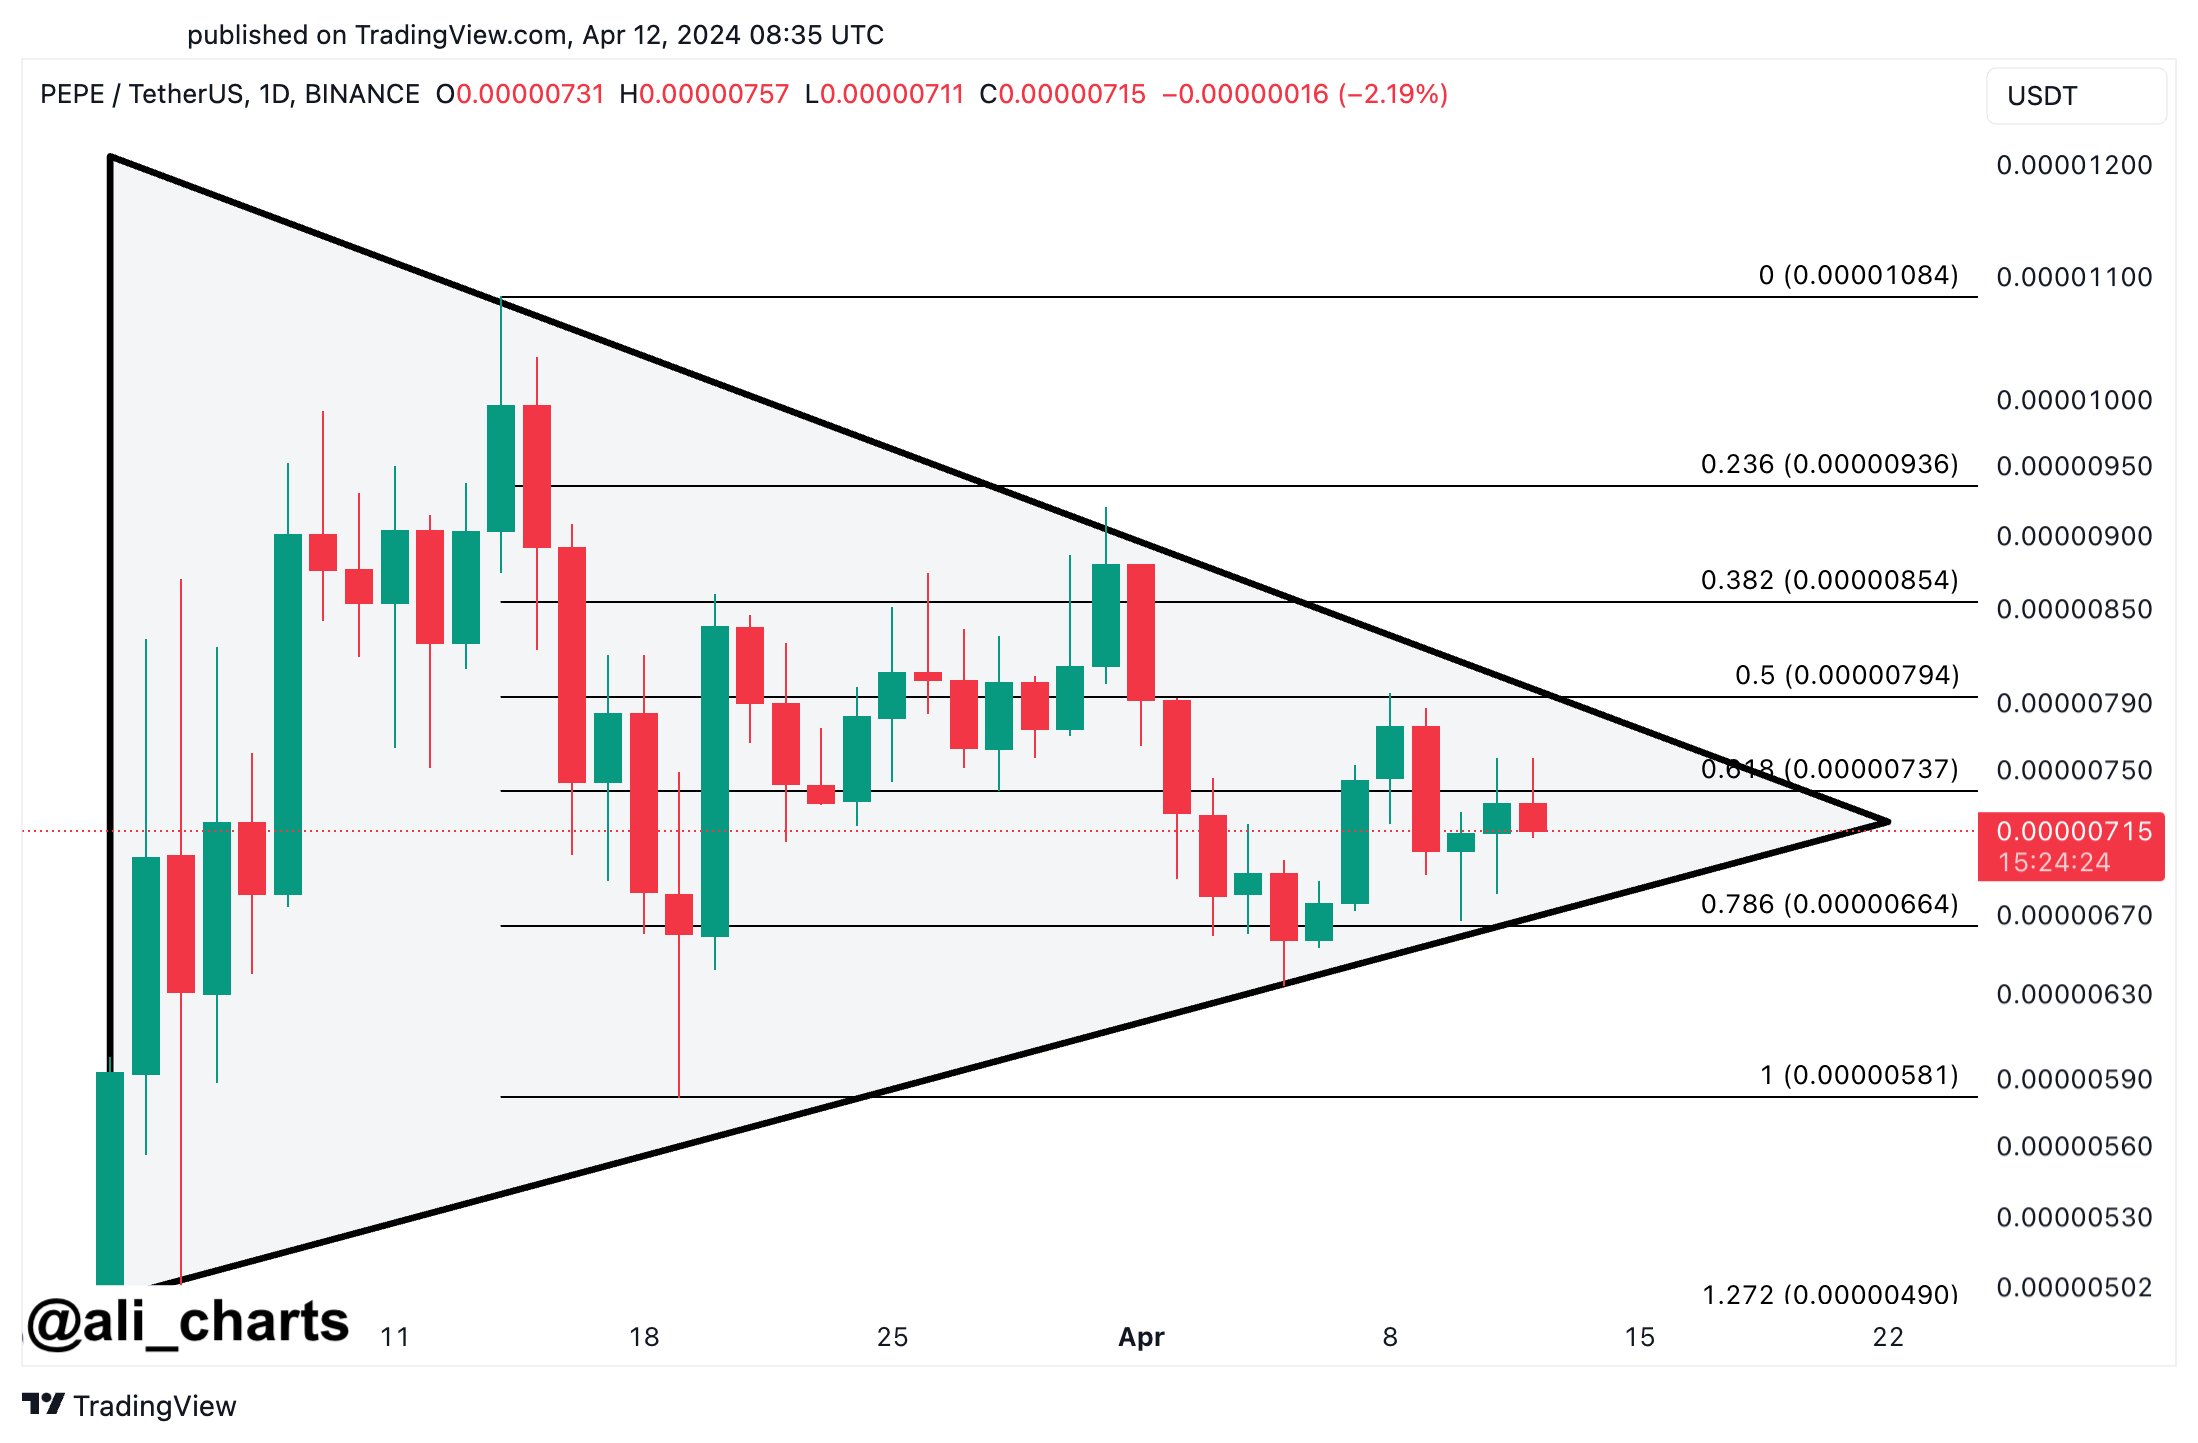
For instance, PEPE, the market leader, surged by 15% in the past 24 hours, complementing its 20% uptrend over the previous week. It reached a new high of $0.00001077 during early Monday trading.

GameStop

Ultimately, GameStop’s meme stock resurgence, fueled by the return of Roaring Kitty, inflicted substantial losses on short sellers of the meme stock on Monday. 

The impact of Roaring Kitty’s social media presence has extended to the memecoin market, with several Wolverine-themed tokens experiencing significant surges. 

Featured image from Shutterstock, chart from TradingView.com

PEPE Whales Move $21 Million Worth Of Coins – Here Are The Destinations

On-chain data shows PEPE whales have moved large amounts of the memecoin during the past day. Here’s where these tokens have been heading.

PEPE Whales Have Been Active On The Network Today

According to data from the cryptocurrency transaction tracker service Whale Alert, two large PEPE transactions have occurred in the space of a few hours during the past day. Both of these moves are of a scale that’s typically associated to the whales, humongous entities that can carry some influence in the market thanks to their ability to make such large transfers.

Because of their position on the network, their moves can be worth watching, as they may end up reflecting on the price of the cryptocurrency. As for how exactly the asset may be impacted by the transfers of these investors can come down to what they intended to achieve with the moves.

It can be hard to say about any exact motive, but the details of the transactions on the blockhain can sometimes provide hints about the context surrounding it.

Below are the details of the first PEPE whale transfer from the past day:

PEPE Whale Inflow

As is visible, the sending address in the case of this PEPE whale transaction was an unknown wallet, meaning that it was unattached to any known centralized platform like an exchange. Such wallets are usually the investors’ personal, self-custodial addresses.

The receiving address, on the other hand, does have a platform affiliated to it: the cryptocurrency exchange Binance. Thus, it would appear that the whale moved 1,238,332,920,144 PEPE (worth over $10.5 million at the time the transfer went through) from their personal wallet to the custody of the exchange.

Transfers of this type are known as exchange inflows. The investors make exchange inflows whenever they want to make use of one of the services that these platforms provide, which can include selling. As such, exchange inflows can end up being bearish for the price.

If the whale, in the current case, indeed made the deposit to sell, then PEPE could naturally be negatively impacted, given the large scale of the transaction. Fortunately for the investors of the meme coin, though, the second transaction from today is actually the exact opposite of this transfer; it’s an exchange outflow.

PEPE Whale Outflow

As displayed above, this PEPE whale moved coins from Binance to an unknown wallet through this transaction. Investors generally transfer to personal addresses when they plan to hold in the long term, as it’s safer to do so outside the custody of central entities. Thus, it’s possible this whale plans to HODL these coins.

Interestingly, the amount involved in this move, 1,241,850,000,000 PEPE ($10.5 million), is quite similar to the exchange inflow. Given that the same exchange is also involved in both, it’s possible that the same whale may in fact be responsible for the both of them.

Though, since the addresses don’t quite match, it’s still uncertain. Either way, the fact that an equal-sized exchange outflow has occurred mere hours after should be able to balance out any bearish effects arising out of the inflow, at least in theory.

PEPE Price

At the time of writing, PEPE is floating around the $0.000008445479 mark, up more than 21% over the past week.

PEPE Price Chart

69% Of PEPE Holders Left In Profits After 26% Plunge

On-chain data shows the percentage of the PEPE investors currently in the green has fallen to 69% after the 26% plunge the memecoin has seen in the past week.

69% Of All PEPE Addresses Are Carrying Some Gains Right Now

In a new post on X, the market intelligence platform IntoTheBlock has posted an update on how the investor profitability is looking for the memecoin PEPE currently.

The analytics firm’s metric gauges whether a holder is in profit or not by reviewing their address’s on-chain history. Based on when the wallet acquired the coins, the indicator calculates the investor’s average cost basis using the spot price of the asset at the time of those purchases.

If the current spot value of the cryptocurrency is higher than this average cost basis for any address, then that particular investor is carrying net gains currently. IntoTheBlock categorizes such addresses to be “in the money.”

Similarly, investors with a cost basis higher than the latest price are considered “out of the money.” Naturally, the two values being exactly equal would suggest the holder is just breaking even on their investment or is “at the money.”

Now, here is the data shared by the analytics firm that shows how this investor breakdown looks like for PEPE at the moment:

PEPE Profits

As is visible above, 69% of the total addresses holding PEPE have their cost basis higher than the current spot price of the coin, while 27% are in losses. 4% of the investors are sitting on their cost basis right now.

This profitability ratio isn’t that high, as, for example, 89% of Bitcoin investors are currently in profit, according to IntoTheBlock data. The reason behind the lower profits for the memecoin is that its price has seen a steep drawdown recently.

Historically, the addresses in the green have been more likely to sell to harvest their gains. As such, when the market profit-loss balance is overwhelmingly towards profits, a mass selloff can occur.

Naturally, this means the chances of a top being hit increase with increasing investor profits. However, a low percentage of investors being in profits can be conducive to bottoms forming, as profit-selling exhausts at these levels.

At present, PEPE is neither dominated by green investors nor red ones. In bull runs, however, profitability levels generally remain higher, so any cooldown can help prices rebound.

Thus, the fact that investor profitability has returned to the 69% level for the memecoin could be a sign that a bottom is close if the bullish regime has to continue.

PEPE Price

PEPE has returned to the $0.0000050913 mark after having declined more than 26% over the last seven days. The chart below shows the memecoin’s performance over the past month.

PEPE Price Chart

PEPE Preparing For A 54% Move? Analyst Thinks So

An analyst has explained how a PEPE daily close outside of a certain price range could lead its value to go on a rally of 54%.

PEPE Symmetrical Triangle May Hint At The Next Move For The Memecoin

In a new post on X, analyst Ali discussed the recent trend forming in the PEPE price. According to the analyst, the memecoin is currently forming a symmetrical triangle pattern on its one-day chart.

The “symmetrical triangle” here refers to a pattern in technical analysis (TA) that, as its name suggests, looks like a triangle. In this pattern, there are two lines of interest between which the asset’s price consolidates for a period.

The upper line connects successive tops, while the lower one joins together bottoms. The main feature of the pattern is that these two lines approach each other at a roughly equal and opposite slope (hence the “symmetrical” in the name).

There are other triangle patterns in TA, but those have either differently angled lines (as is the case with wedges) or one line parallel to the time-axis (ascending and descending triangles).

Like other TA patterns that represent a consolidation phase, the lines of the symmetrical triangle also serve as a point of potential reversal for the price. The upper line usually offers resistance (meaning tops can occur), while the lower line may provide support (bottom formation).

When a break takes place from either of these lines, the price may likely see sustained momentum in that direction. This implies that a break above the triangle could be a bullish signal, while one below may be bearish.

The symmetrical triangle may be viewed as a phase of the market in which the bulls and bears are at a standstill, hence why the price is ranging sideways. During a break, one of these wins out, and price action follows in that direction.

Naturally, as the lines converge towards a center point in this pattern, a breakout becomes increasingly probable the closer to the apex of the triangle the asset’s price gets.

Now, here is the chart shared by Ali that highlights the symmetrical triangle pattern that PEPE has been trading inside recently:

PEPE Symmetrical Triangle

As is visible in the graph, the 1-day price of PEPE has been approaching the triangle’s apex recently, implying that a break in a direction may be coming for the memecoin.

“Watch out for a daily close outside of the $0.00000793 – $0.00000664 range, which could lead to a 54% move for PEPE,” explains the analyst. Given the pattern that has been forming, it now remains to be seen how the asset’s price will play out from here.

PEPE Price

At the time of writing, PEPE is trading around $0.000006868072, up 3% over the past week.

PEPE Price Chart

PEPE Breaks Out Of Descending Channel: Analyst Puts These Targets

An analyst has explained that PEPE could be breaking out of a descending channel pattern currently and may be heading towards these targets.

PEPE Has Been Breaking Out Of A Descending Parallel Channel Recently

In a new post on X, analyst Ali pointed out how the 4-hour PEPE price is breaking out of a descending parallel channel currently. In technical analysis, a “parallel channel” refers to the area enclosed by two parallel trendlines where the price of the given asset has been traveling inside recently.

Generally, the price is likely to encounter resistance at the upper line of the channel, while the lower level could act as a source of support. Because of this reason, tops and bottoms are naturally probable to occur at the respective trendlines.

In the context of the current discussion, a parallel channel called a descending channel is of interest. As its name suggests, this channel represents a downtrend in the asset.

The upper line of the descending parallel channel is drawn by connecting together lower highs in the commodity’s price. Similarly, the bottom level joins together with lower lows.

Usually, breaks out of the channel can be significant as they may imply a continuation of the trend. This means that if the break is out of the upper line, it can be a bullish signal, while a drop under the lower level could be a sign that the bearish trend is strengthening.

Now, here is the chart shared by the analyst that highlights a descending parallel channel pattern that has been forming in the 4-hour price of PEPE recently:

PEPE Descending Channel

As displayed in the above graph, PEPE had been trending inside this descending parallel channel pattern until the last 24 hours, when the meme coin enjoyed a sharp 16% jump and broke out of the upper level of the channel.

This quick rise in the cryptocurrency’s price has come as the Bitcoin spot ETFs have gained approval from the US SEC. While BTC itself has only seen a 4% from this bullish news, altcoins around the sector have gone ahead and started showing sizeable surges.

As PEPE now appears to be breaking out of the descending parallel channel, the meme coin could be set to continue its bullish momentum, as it has often happened historically with such breakouts.

That would only be, of course, if the breakout truly gets confirmed, as the coin has only just begun to rise above it. In the chart, Ali has marked the levels that PEPE could end up reaching if this bullish pattern comes to fruition.

$0.0000016 and $0.0000019 are the two price levels that the analyst has highlighted for the asset, as they are at distances equal to half-length and full-length of the channel, respectively.

Should the coin touch the former of these, it would have rallied almost 11% from the current price level, while a rise to the latter one would suggest an increase of over 31%.

PEPE Price

Following the sharp surge from the past day, the asset’s price is now trading around the $0.000001446 mark.

PEPE Price Chart