PEPE Chart Heats Up: Crypto Analyst Calls It One Of The Most Attractive

Cold Blooded Shiller (@ColdBloodShill), a well-known figure in the crypto analysis community, recently shared a technical analysis of the PEPE/USDT pair on Binance, marking it as one of the most promising charts in the current market landscape. With his analysis, posted to his 272,000 followers on X, he describes the potential movements of PEPE, both bullish and bearish, as it approaches a critical juncture on its trading chart.

Why PEPE Is One Of The Most Attractive Crypto’s Right Now

The chart, set on a four-hour time frame, details PEPE’s price action and its interaction with significant technical levels. A key focal point of Shiller’s analysis is the resistance-turned-support zone between approximately $0.0000063 and $0.0000062. This level, highlighted in green, previously acted as a strong resistance zone, and its conversion to support suggests a foundational shift in market sentiment towards PEPE.

PEPE price analysis

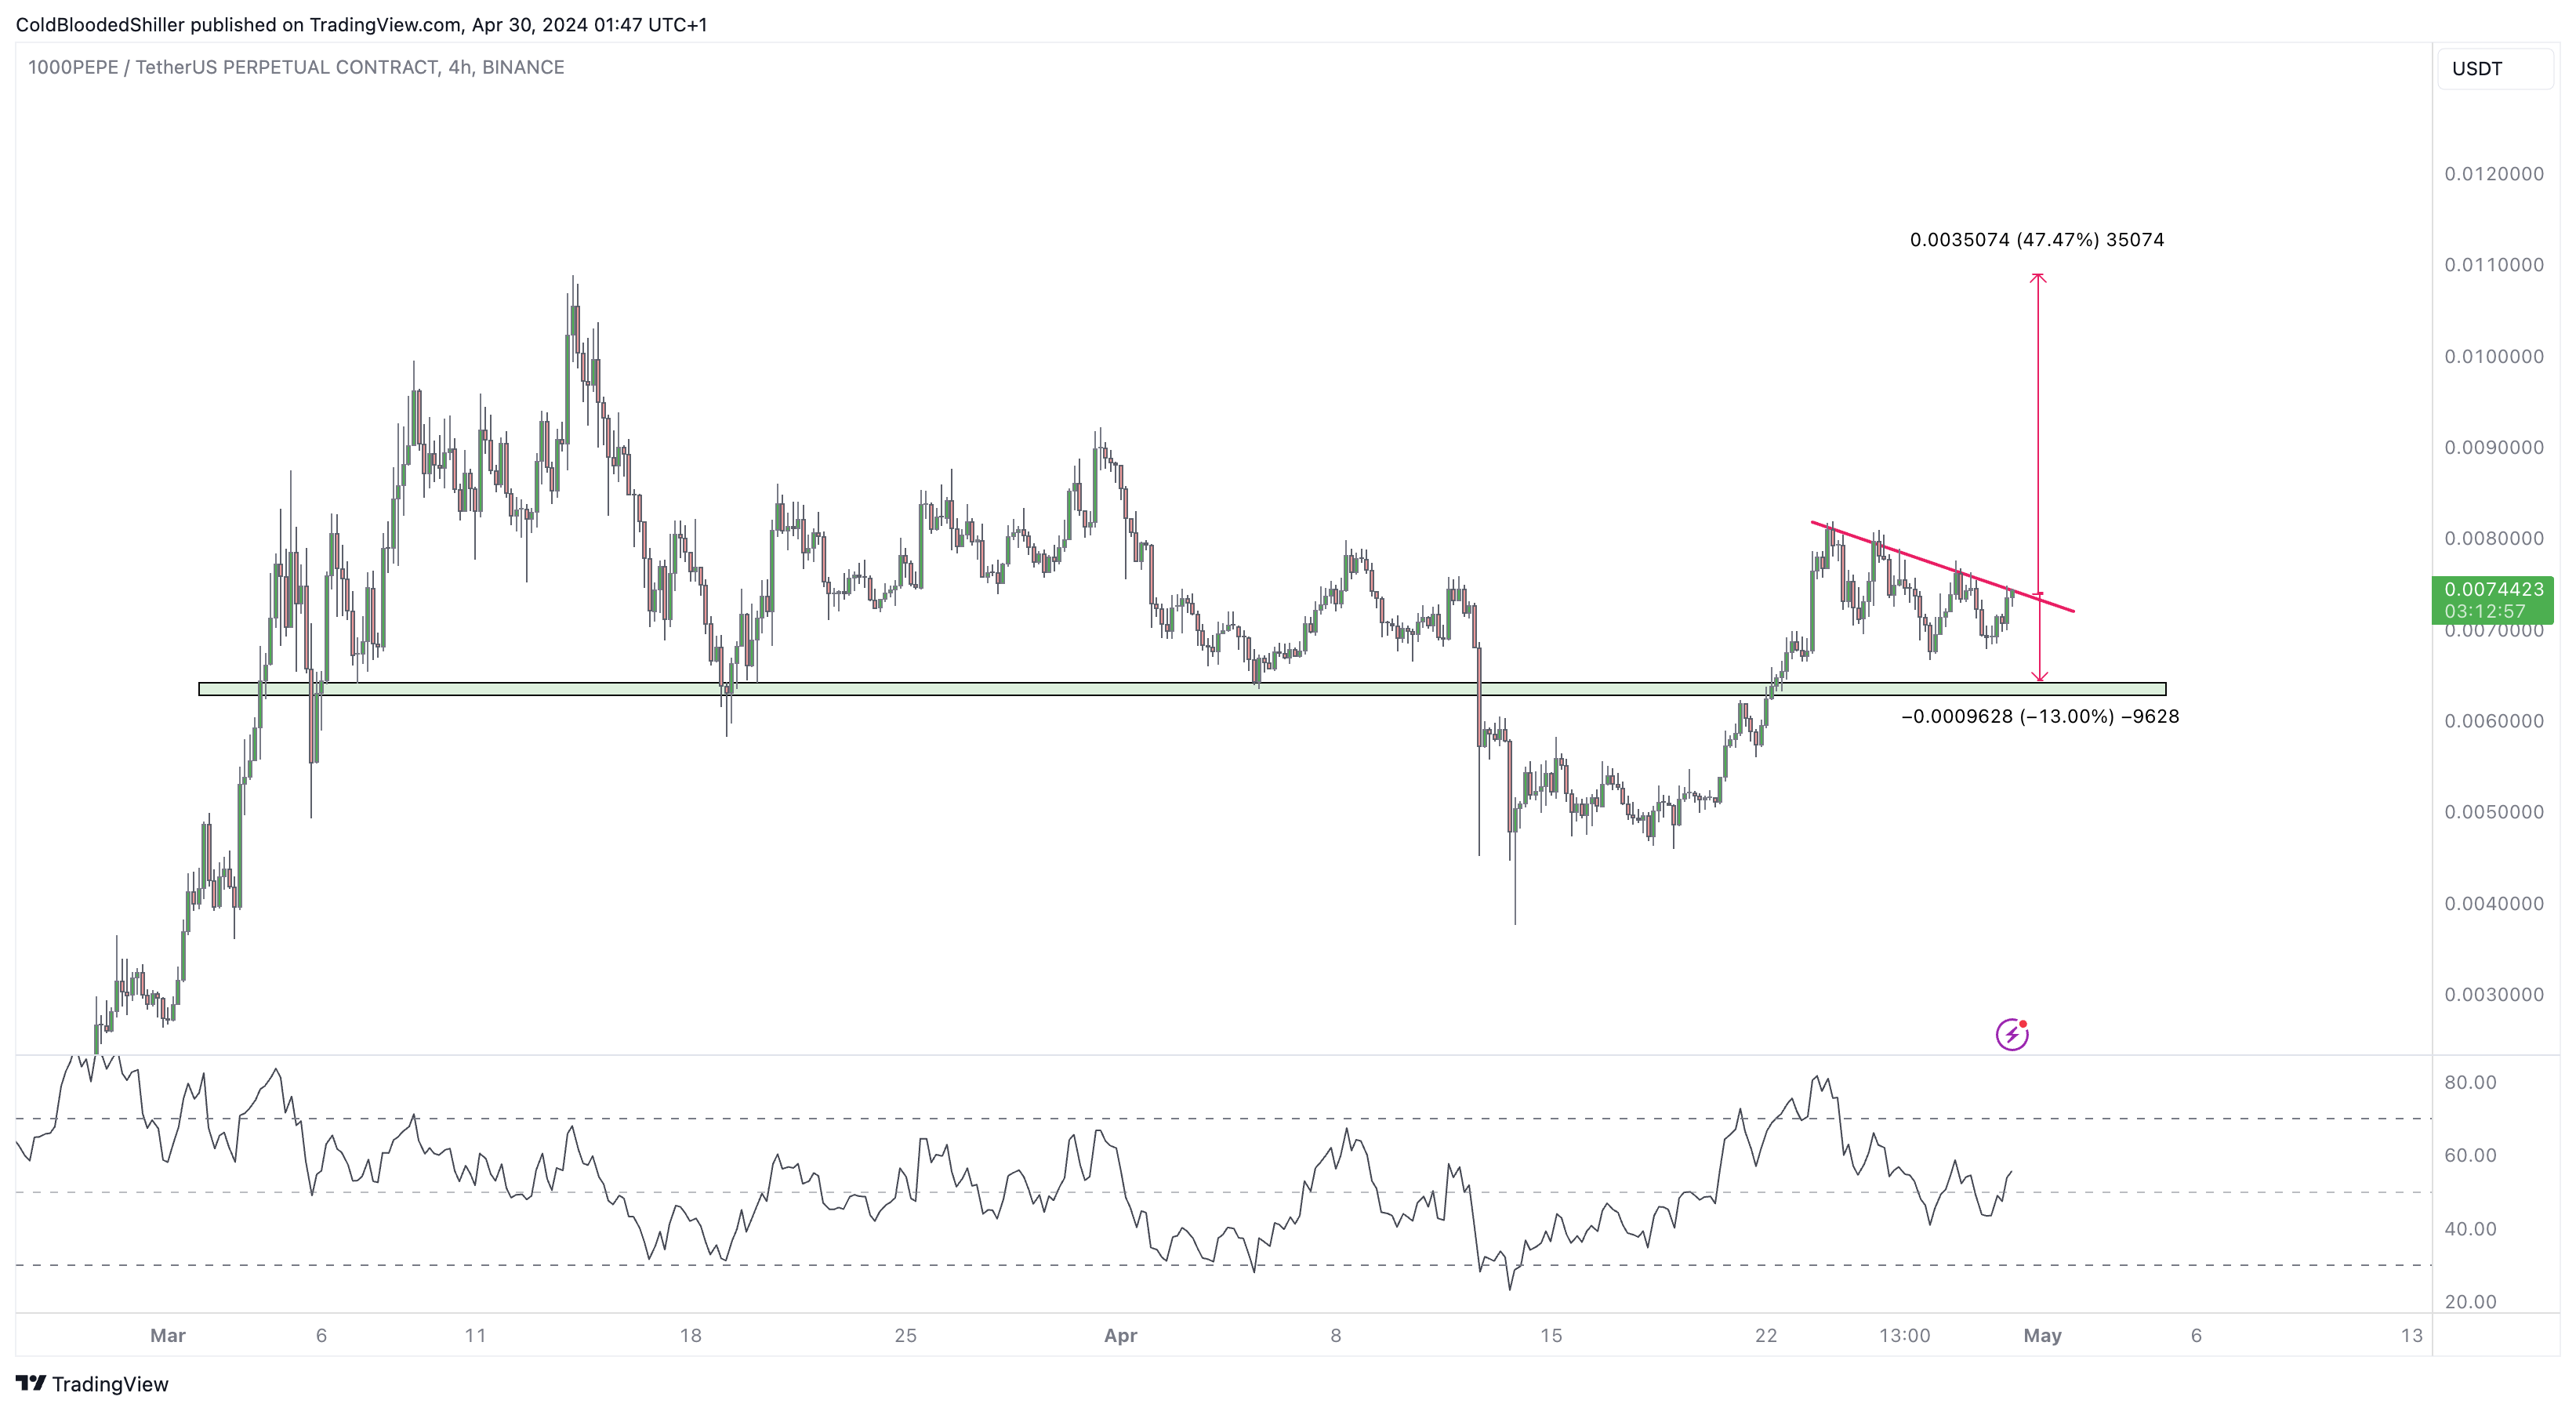
Moreover, PEPE is currently approaching a crucial resistance marked by a descending trend line in red, indicating a potential breakout point. However, Shiller cautiously notes that while the asset is on the verge of breaking this downtrend, there’s a risk of what he terms a “fakeout.” This scenario could see the price initially breaking above the trend line only to retract back below it, potentially leading to a decline of about 13% towards the established support zone at $0.0047423.

Should this support hold against market volatility—a common challenge in the crypto trading sphere—it may serve as a springboard for PEPE. Shiller speculates a possible rally that could result in a 47.47% increase from the support level, targeting an upper price level of $0.000011. Such a movement would not only confirm the strength of the current support but also signify a strong bullish market phase for PEPE.

The analysis also pays close attention to the Relative Strength Index (RSI) hovering near the 50 mark, a neutral territory that indicates the asset is neither overbought nor oversold. This positioning suggests the potential for significant price movement in either direction, emphasizing the importance of the upcoming potential breakout or fakeout scenario.

Cold Blooded Shiller’s analysis concludes with a nod towards taking a chance on PEPE if it begins to show signs of a firm breakout. His detailed observation and the technical markers he highlights suggest that, despite potential risks, the reward could indeed be substantial should favorable conditions prevail.

“PEPE [is] one of the sexiest looking charts out there right now. Consolidating above it’s former significant level. Does it have the chance for lower and some fuckery with a fakeout? Yes. Is it worth the opportunity shot if it starts to breakout? Absolutely yes,” he stated.

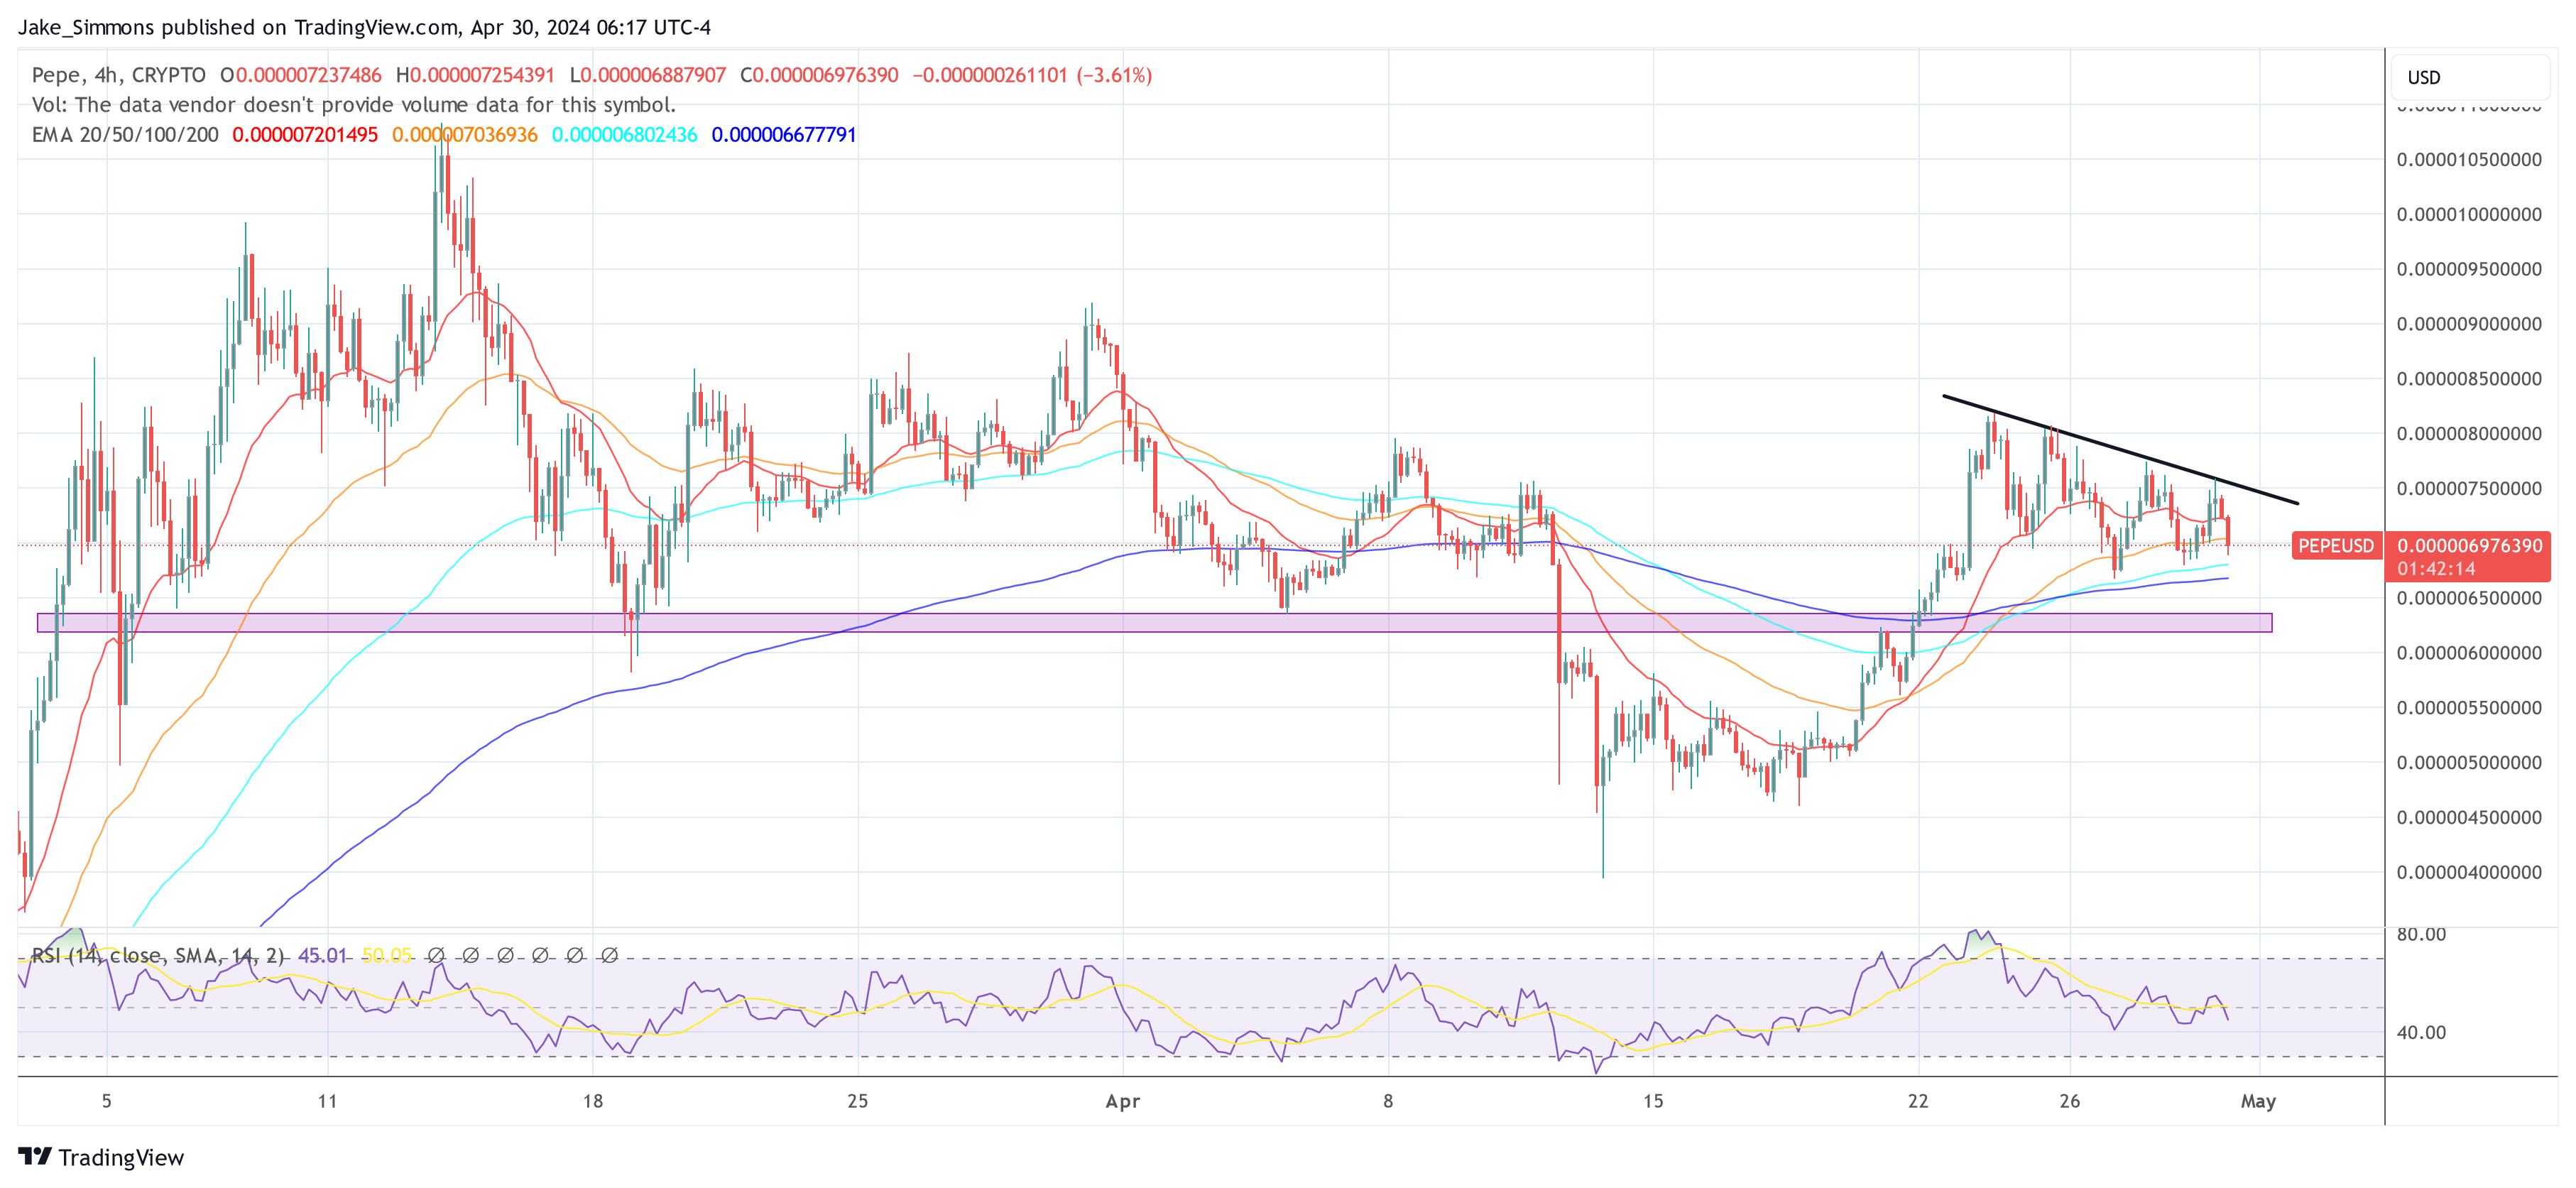
At press time, PEPE was trading at $0.000006976. Thus, the meme coin is approaching the 200-EMA at $0.000006677. If this support does not hold, a retest of the red support zone seems plausible.

PEPE price

PEPE Preparing For A 54% Move? Analyst Thinks So

An analyst has explained how a PEPE daily close outside of a certain price range could lead its value to go on a rally of 54%.

PEPE Symmetrical Triangle May Hint At The Next Move For The Memecoin

In a new post on X, analyst Ali discussed the recent trend forming in the PEPE price. According to the analyst, the memecoin is currently forming a symmetrical triangle pattern on its one-day chart.

The “symmetrical triangle” here refers to a pattern in technical analysis (TA) that, as its name suggests, looks like a triangle. In this pattern, there are two lines of interest between which the asset’s price consolidates for a period.

The upper line connects successive tops, while the lower one joins together bottoms. The main feature of the pattern is that these two lines approach each other at a roughly equal and opposite slope (hence the “symmetrical” in the name).

There are other triangle patterns in TA, but those have either differently angled lines (as is the case with wedges) or one line parallel to the time-axis (ascending and descending triangles).

Like other TA patterns that represent a consolidation phase, the lines of the symmetrical triangle also serve as a point of potential reversal for the price. The upper line usually offers resistance (meaning tops can occur), while the lower line may provide support (bottom formation).

When a break takes place from either of these lines, the price may likely see sustained momentum in that direction. This implies that a break above the triangle could be a bullish signal, while one below may be bearish.

The symmetrical triangle may be viewed as a phase of the market in which the bulls and bears are at a standstill, hence why the price is ranging sideways. During a break, one of these wins out, and price action follows in that direction.

Naturally, as the lines converge towards a center point in this pattern, a breakout becomes increasingly probable the closer to the apex of the triangle the asset’s price gets.

Now, here is the chart shared by Ali that highlights the symmetrical triangle pattern that PEPE has been trading inside recently:

PEPE Symmetrical Triangle

As is visible in the graph, the 1-day price of PEPE has been approaching the triangle’s apex recently, implying that a break in a direction may be coming for the memecoin.

“Watch out for a daily close outside of the $0.00000793 – $0.00000664 range, which could lead to a 54% move for PEPE,” explains the analyst. Given the pattern that has been forming, it now remains to be seen how the asset’s price will play out from here.

PEPE Price

At the time of writing, PEPE is trading around $0.000006868072, up 3% over the past week.

PEPE Price Chart

PEPE Breaks Out Of Descending Channel: Analyst Puts These Targets

An analyst has explained that PEPE could be breaking out of a descending channel pattern currently and may be heading towards these targets.

PEPE Has Been Breaking Out Of A Descending Parallel Channel Recently

In a new post on X, analyst Ali pointed out how the 4-hour PEPE price is breaking out of a descending parallel channel currently. In technical analysis, a “parallel channel” refers to the area enclosed by two parallel trendlines where the price of the given asset has been traveling inside recently.

Generally, the price is likely to encounter resistance at the upper line of the channel, while the lower level could act as a source of support. Because of this reason, tops and bottoms are naturally probable to occur at the respective trendlines.

In the context of the current discussion, a parallel channel called a descending channel is of interest. As its name suggests, this channel represents a downtrend in the asset.

The upper line of the descending parallel channel is drawn by connecting together lower highs in the commodity’s price. Similarly, the bottom level joins together with lower lows.

Usually, breaks out of the channel can be significant as they may imply a continuation of the trend. This means that if the break is out of the upper line, it can be a bullish signal, while a drop under the lower level could be a sign that the bearish trend is strengthening.

Now, here is the chart shared by the analyst that highlights a descending parallel channel pattern that has been forming in the 4-hour price of PEPE recently:

PEPE Descending Channel

As displayed in the above graph, PEPE had been trending inside this descending parallel channel pattern until the last 24 hours, when the meme coin enjoyed a sharp 16% jump and broke out of the upper level of the channel.

This quick rise in the cryptocurrency’s price has come as the Bitcoin spot ETFs have gained approval from the US SEC. While BTC itself has only seen a 4% from this bullish news, altcoins around the sector have gone ahead and started showing sizeable surges.

As PEPE now appears to be breaking out of the descending parallel channel, the meme coin could be set to continue its bullish momentum, as it has often happened historically with such breakouts.

That would only be, of course, if the breakout truly gets confirmed, as the coin has only just begun to rise above it. In the chart, Ali has marked the levels that PEPE could end up reaching if this bullish pattern comes to fruition.

$0.0000016 and $0.0000019 are the two price levels that the analyst has highlighted for the asset, as they are at distances equal to half-length and full-length of the channel, respectively.

Should the coin touch the former of these, it would have rallied almost 11% from the current price level, while a rise to the latter one would suggest an increase of over 31%.

PEPE Price

Following the sharp surge from the past day, the asset’s price is now trading around the $0.000001446 mark.

PEPE Price Chart

What Is Behind The 16% PEPE Price Recovery And Will It Continue?

Over the last week, the PEPE price has emerged as one of the best performers in the crypto market. This followed a long period of drawdown that dragged the meme coin’s price almost 90% below its June 2023 all-time high. This prolonged bear period coupled with its declining momentum is why the price reversal has caught the market by surprise.

Social Discussions Around PEPE Rise

To figure out why the PEPE price has been on a rally at a time when the broader crypto market has suffered declines, let’s take a look at the social discussions around the token. In particular, a report from on-chain tracker Santiment shows the social media discussion trends of top meme coins.

Santiment’s report which was shared on X (formerly Twitter) points out that meme coins have not really been on the radar of traders, except for PEPE. As the chart shows, discussions around the PEPE meme token saw an uptick this week.

PEPE price recovery

It is the only meme coin whose social media discussions rose during the week with the likes of Dogecoin seeing their own metrics drop to 3-year lows. This uptick could present the reason behind the PEPE price recovery this week.

Usually, when investors start getting interested in a coin, they will often talk about it on social media platforms. Depending on whether investors are collectively bullish or bearish, it can cause a swing in the price toward either direction. In this case, the uptick in discussions coincides with the rise in price, suggesting a higher level of bullishness.

PEPE Price Rises 16% In One Week

PEPE’s double-digit surge this week saw the altcoin hit a local peak of $0.00000075 on Wednesday, resulting in one of its highest levels in September 2023. This rally has since lost momentum but the meme coin continues to maintain a good chunk of its gains.

The PEPE price is up more than 16% on the weekly chart and enjoying a 92% surge in its daily trading volume over the last 24 hours. This increase in trading volume also shines a light on the rising investor interest, which could suggest a continuation of the rally once the correction finds a bottom.

However, with most of the crypto market still deeply in the throes of the bear market, it’s unlikely that the rally would be able to continue for too long, presenting a hindrance. If the coin fails to establish support above $0.00000071, then all of this week’s gains could be wiped out by the time the weekend is over.

PEPE price chart from Tradingview.com