PEPE Preparing For A 54% Move? Analyst Thinks So

An analyst has explained how a PEPE daily close outside of a certain price range could lead its value to go on a rally of 54%.

PEPE Symmetrical Triangle May Hint At The Next Move For The Memecoin

In a new post on X, analyst Ali discussed the recent trend forming in the PEPE price. According to the analyst, the memecoin is currently forming a symmetrical triangle pattern on its one-day chart.

The “symmetrical triangle” here refers to a pattern in technical analysis (TA) that, as its name suggests, looks like a triangle. In this pattern, there are two lines of interest between which the asset’s price consolidates for a period.

The upper line connects successive tops, while the lower one joins together bottoms. The main feature of the pattern is that these two lines approach each other at a roughly equal and opposite slope (hence the “symmetrical” in the name).

There are other triangle patterns in TA, but those have either differently angled lines (as is the case with wedges) or one line parallel to the time-axis (ascending and descending triangles).

Like other TA patterns that represent a consolidation phase, the lines of the symmetrical triangle also serve as a point of potential reversal for the price. The upper line usually offers resistance (meaning tops can occur), while the lower line may provide support (bottom formation).

When a break takes place from either of these lines, the price may likely see sustained momentum in that direction. This implies that a break above the triangle could be a bullish signal, while one below may be bearish.

The symmetrical triangle may be viewed as a phase of the market in which the bulls and bears are at a standstill, hence why the price is ranging sideways. During a break, one of these wins out, and price action follows in that direction.

Naturally, as the lines converge towards a center point in this pattern, a breakout becomes increasingly probable the closer to the apex of the triangle the asset’s price gets.

Now, here is the chart shared by Ali that highlights the symmetrical triangle pattern that PEPE has been trading inside recently:

PEPE Symmetrical Triangle

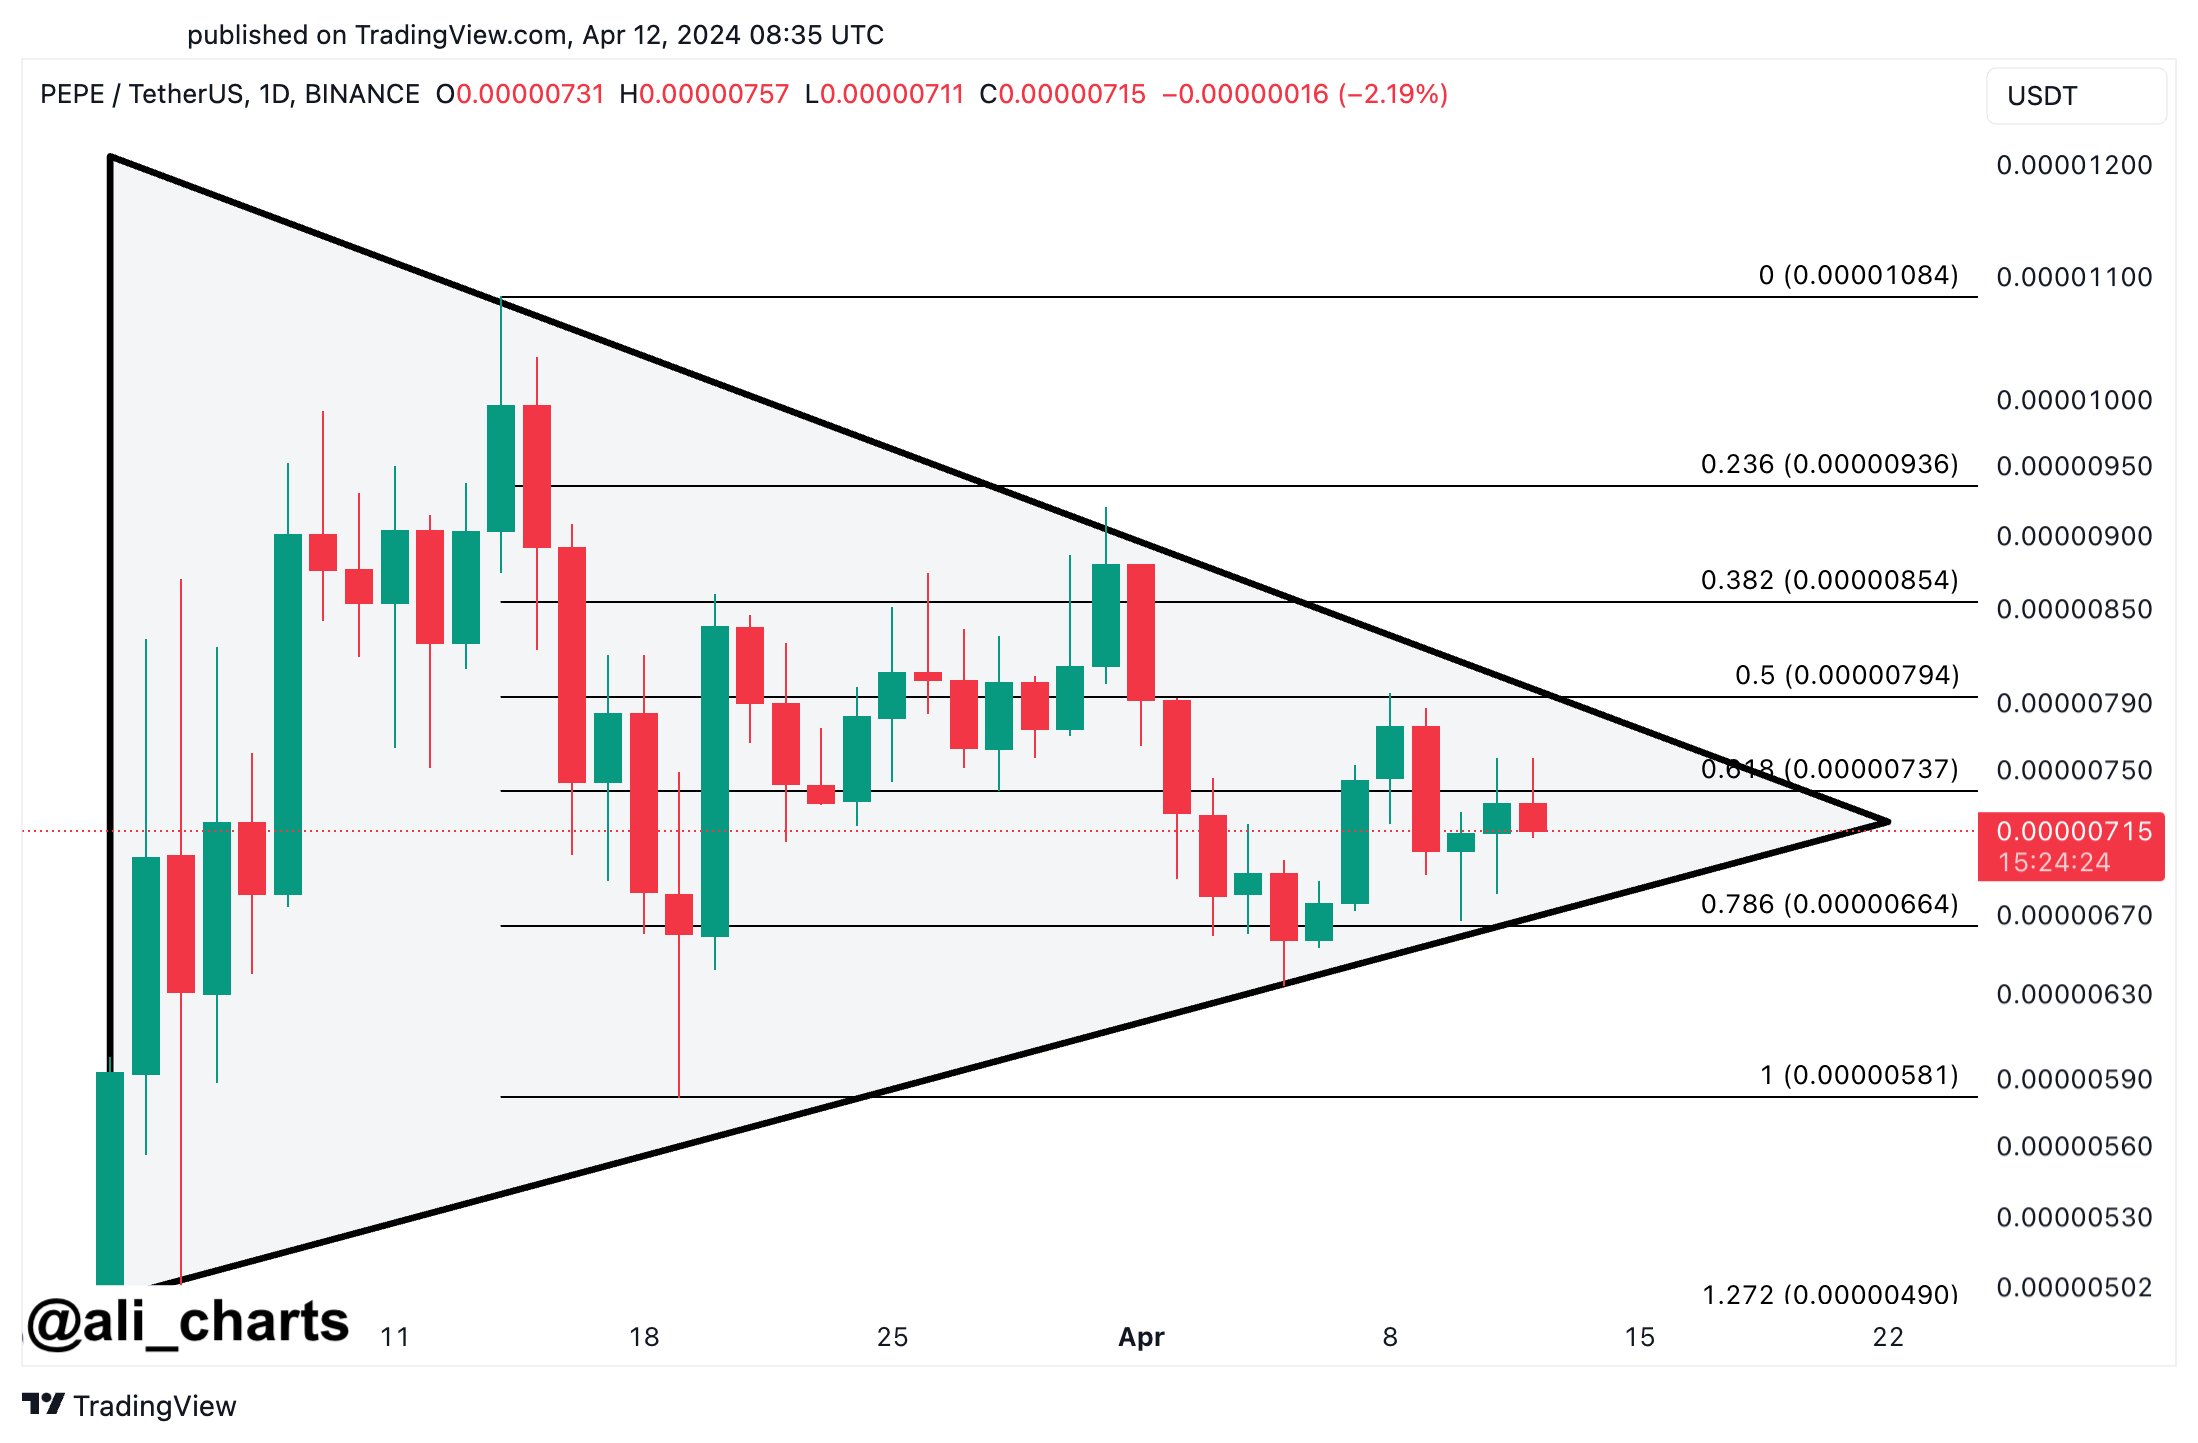
As is visible in the graph, the 1-day price of PEPE has been approaching the triangle’s apex recently, implying that a break in a direction may be coming for the memecoin.

“Watch out for a daily close outside of the $0.00000793 – $0.00000664 range, which could lead to a 54% move for PEPE,” explains the analyst. Given the pattern that has been forming, it now remains to be seen how the asset’s price will play out from here.

PEPE Price

At the time of writing, PEPE is trading around $0.000006868072, up 3% over the past week.

PEPE Price Chart

PEPE Breaks Out Of Descending Channel: Analyst Puts These Targets

An analyst has explained that PEPE could be breaking out of a descending channel pattern currently and may be heading towards these targets.

PEPE Has Been Breaking Out Of A Descending Parallel Channel Recently

In a new post on X, analyst Ali pointed out how the 4-hour PEPE price is breaking out of a descending parallel channel currently. In technical analysis, a “parallel channel” refers to the area enclosed by two parallel trendlines where the price of the given asset has been traveling inside recently.

Generally, the price is likely to encounter resistance at the upper line of the channel, while the lower level could act as a source of support. Because of this reason, tops and bottoms are naturally probable to occur at the respective trendlines.

In the context of the current discussion, a parallel channel called a descending channel is of interest. As its name suggests, this channel represents a downtrend in the asset.

The upper line of the descending parallel channel is drawn by connecting together lower highs in the commodity’s price. Similarly, the bottom level joins together with lower lows.

Usually, breaks out of the channel can be significant as they may imply a continuation of the trend. This means that if the break is out of the upper line, it can be a bullish signal, while a drop under the lower level could be a sign that the bearish trend is strengthening.

Now, here is the chart shared by the analyst that highlights a descending parallel channel pattern that has been forming in the 4-hour price of PEPE recently:

PEPE Descending Channel

As displayed in the above graph, PEPE had been trending inside this descending parallel channel pattern until the last 24 hours, when the meme coin enjoyed a sharp 16% jump and broke out of the upper level of the channel.

This quick rise in the cryptocurrency’s price has come as the Bitcoin spot ETFs have gained approval from the US SEC. While BTC itself has only seen a 4% from this bullish news, altcoins around the sector have gone ahead and started showing sizeable surges.

As PEPE now appears to be breaking out of the descending parallel channel, the meme coin could be set to continue its bullish momentum, as it has often happened historically with such breakouts.

That would only be, of course, if the breakout truly gets confirmed, as the coin has only just begun to rise above it. In the chart, Ali has marked the levels that PEPE could end up reaching if this bullish pattern comes to fruition.

$0.0000016 and $0.0000019 are the two price levels that the analyst has highlighted for the asset, as they are at distances equal to half-length and full-length of the channel, respectively.

Should the coin touch the former of these, it would have rallied almost 11% from the current price level, while a rise to the latter one would suggest an increase of over 31%.

PEPE Price

Following the sharp surge from the past day, the asset’s price is now trading around the $0.000001446 mark.

PEPE Price Chart

Can PEPE Build On Its 60% Rise? Here’s What On-Chain Data Says

PEPE has observed an impressive 60% rally recently. Here’s what on-chain data says regarding whether this rise can continue.

PEPE Has Seen Some On-Chain Metrics Light Up Recently

In a new post on X, the market intelligence platform IntoTheBlock has discussed how PEPE is looking in terms of its on-chain indicators currently. The first metric of interest here is the profit/loss breakdown of the memecoin’s user base.

PEPE Profit/Loss

As displayed above, about 35% of the holders/addresses of the cryptocurrency are carrying their coins with some net unrealized profit right now. On the other hand, the loss investors amount to 51% of the network’s user base, meaning that the majority of the holders are in the red currently.

The remaining 14% of the addresses are breaking even at the current price levels of the asset. Generally, the investors carrying profits are more likely to sell their coins to harvest their gains, which means that if there are many holders in profit, significant selling pressure could arise in the market.

In the current scenario, however, more than 50% of the investors are still carrying their coins at a loss despite the recent 60% surge that PEPE has enjoyed. Thus, the potential selling pressure in the sector may not be too much yet. This could certainly be a positive sign for the rally’s sustainability.

Next, IntoTheBlock has pointed out how the address activity related to PEPE has observed a significant boost recently.

PEPE Addresses

According to the analytics firm, the active addresses jumped 372% between October 19th and 25th, while the new addresses increased by 440% in the same period.

The “active addresses” metric keeps track of the daily number of addresses participating in some transaction activity on the blockchain. In contrast, the new addresses indicator measures the daily number of wallets coming online on the network for the first time.

The sharp growth in these indicators would imply that network activity has been high recently, both in terms of usage and adoption. Historically, rallies have thrived in such conditions, as a large number of active traders is what such moves require to be sustainable.

Lastly, IntoTheBlock has pointed out that while the PEPE whales haven’t shown concrete signs of accumulation yet, they have been potentially becoming active recently.

PEPE Whales

From the chart, it’s visible that the “large transactions volume” has observed some rise recently. The large transactions refer to transactions worth at least $100,000 in value, usually made by the whales and institutional entities.

While the uptick in the activity of these humongous investors hasn’t been that much, it’s still an optimistic sign that these investors have been showing at least some interest in PEPE during this rally.

PEPE Price

Since its sharp rise, PEPE has gone stale in the last few days as its price continues to trade around $0.0000011672.

Memecoin Price Chart

PEPE Roars Ahead: Dominates SHIB And DOGE With Record-Breaking 6.9T Burn

In the ongoing frenzy surrounding meme coins that have captivated the cryptocurrency market throughout 2023, PEPE has experienced a significant resurgence. 

After a prolonged decline from July 14 to October 3, the memecoin halted its downtrend and entered an accumulation phase. Subsequently, it embarked on a renewed bullish uptrend starting on October 20, outperforming Ethereum-based altcoin Shiba Inu (SHIB) and Elon Musk-backed Dogecoin (DOGE) by a significant margin. 

As a result of this uptrend, PEPE has reclaimed its position in the top 100 list of cryptocurrencies, currently ranking 96th.

Bitcoin’s Surge Beyond $35,000 Sparks Market Uptrend

This surge in value has been largely influenced by the market leader, Bitcoin (BTC), which surpassed the $35,000 mark on Tuesday. 

For many, the current uptrend is driven by anticipation of the approval of a spot Bitcoin exchange-traded fund (ETF), which could potentially bring a new wave of capital into the market.

Furthermore, Dogecoin is among the five popular meme coins influenced by Bitcoin’s rise to $35,000. Shiba Inu also experienced a 5.9% gain and is currently trading at $0.00000765, following a similar pattern to DOGE.

In a significant development, the dev team behind PEPE announced on X (formerly Twitter) that approximately 6.9 trillion $PEPE tokens, worth around $6,000,000, have been burned. 

Additionally, a new team of advisors has been brought on board to guide the future direction of Pepe. The original team is exploring using the remaining 3.79 trillion tokens, attributed to the Centralized Exchange (CEX) multi-sig wallet, for strategic partnerships and marketing opportunities. 

The PEPE community can expect regular updates on future token burns, movements, or uses through Twitter and the official telegram channel.

PEPE Price Skyrockets By 25.83% In 24 Hours

As of today, the price of Pepe (PEPE) stands at US$0.000000930549, with a 24-hour trading volume of $455,035,042.79. This represents a significant price increase of 25.83% in the last 24 hours and a 43.63% increase over the past 7 days. 

With a circulating supply of 420 billion PEPE, Pepe currently holds a market capitalization of $398,014,904.

PEPE

On the other hand, SHIB is currently priced at $0.00000739, with a 24-hour trading volume of $314,695,140.13. 

Over the past 24 hours, SHIB has experienced a price increase of 2.72% and a 6.04% increase over the past 7 days. With a circulating supply of 590 billion SHIB, Shiba Inu has a market capitalization of US$4,348,847,496.

Meanwhile, DOGE is trading at $0.065989, with a 24-hour trading volume of $1,064,277,555.26. Over the past 24 hours, DOGE has seen a price increase of 3.02% and an 11.02% increase over the past 7 days. 

With a circulating supply of 140 billion DOGE, Dogecoin holds a market capitalization of US$9,327,269,145.

The recent price movements and market activities of these meme coins reflect the renewed confidence and interest in the cryptocurrency market. Furthermore, these numbers solidify PEPE’s position as the standout performer in the market.

Featured image from Shutterstock, chart from TradingView.com 

PEPE Shines With 20% Gains As Market Sees Correction, What’s Next?

PEPE surged remarkably in the past week posting gains of approximately 20%. The $0.0000011079 support level on the daily chart acted as a price pivot for the gains in the last few days, indicating an attempt to enter the buy zone. 

PEPE’s previous attempts to break above the $0.0000015440 resistance zone between July 19-24 were unsuccessful. However, the bulls are in control, driving PEPE to attempt another break above the $0.0000015440 resistance. 

The rally in the past 7-days indicates a momentum shift for PEPE to a more positive outlook as the bulls attempt to seize control again. 

PEPEUSD price chart

PEPE Bulls Forcing Another Rally, But Bears Still Active

Price volatility is evident when comparing price data for PEPE on the daily, weekly, and monthly timeframes. It trades at $0.000001348 on August 15 with a 6.03% price drop in 24 hours, while it has dropped 17% on the monthly time frame.  

However, PEPE shows a more positive outlook on the weekly timeframe, although traders must tread cautiously as a price drop remains a possibility due to volatility. 

The Relative Strength Index (RSI) value is 55.71 in the neutral zone reflecting traders’ indecision in the market. Also, the Moving Average Convergence Divergence (MACD) is rising above the signal line, confirming the return of the bulls. 

However, the size of the candles indicates low trading activity despite the gains making the price action moving forward quite tricky. The close of the August 15 candle will bring confirmation of the next price direction. 

PEPE Shows Resilient Above $0.00000120 As Whale Comes Onboard

In recent days, there has been a resurgence in PEPE’s performance. This trend is attributable to substantial investments from prominent investors and a rise in social engagement. According to Lookonchain data, there is a significant surge in whale attention to the PEPE token.

The data shows a whale spent $ 1 million to acquire 807 billion PEPE tokens at $0.000001239. This whale involvement will likely have positive impacts on the price of PEPE.

Another instance of this type of Whale involvement occurred on August 7. A holder of PEPE tokens sold a substantial amount of 2.26 trillion tokens at the price of $0.000001121 per token.

Unfortunately, this action resulted in a significant decrease of $707,000 in the token’s overall market capitalization. Such contrasting maneuvers taking place in a short period might carry potential consequences for individual investors over an extended duration.

Meanwhile, the asset has been experiencing a notable resurgence, attracting investors’ attention. The steady upward trajectory has pushed it from $0.000001185 to approximately $0.000001356, with a trading volume of over $100 million.

PEPE Whales Load Up Their Bags As Memecoin Jumps 13%

Data shows the PEPE whales have been buying the meme coin as its price has observed a sharp 13% rally during the past 24 hours.

PEPE Whales Have Bought 1.56 Trillion Tokens During The Last Day

After consolidating straight for more than a month, the meme coin based on the popular internet frog avatar finally buckled a few days back and saw a sharp decline, as did others in the sector like Bitcoin and Ethereum.

The asset extended this decline in the days that followed, but the downtrend this time was much more gradual. And yesterday, the coin may have found its bottom, as it has observed a sharp surge since then.

PEPE Price Chart

While the rise in the meme coin’s price has been rapid, the asset has still not fully recovered to the levels it had been at before the earlier plummet. But nonetheless, if PEPE can keep this momentum up, it’s possible that it might retest those levels soon enough.

This latest rally has come as whales have been participating in some buying activity. According to Lookonchain on Twitter, an account that keeps track of moves being made by smart-money holders, two whales have bought sizeable portions of the meme coin using Ethereum during the past day.

The first of these humongous investors made a total purchase of around 874 billion PEPE using 600 ETH ($1.12 million), and at the time this holder made the transactions, the meme coin was floating around $0.000001286, meaning that by now, the investor would have made a profit of more than 9%.

PEPE Whale

As a Twitter user in the comments has pointed out, this whale (who goes by “yougetnothing.eth”) has been quite the enthusiastic altcoin trader during the last three months.

The other whale who made a large PEPE purchase today was a little late to the party, as they bought 658 billion PEPE with 500 ETH ($938,000) while the meme coin’s price was trading around $0.000001366.

PEPE Whale Purchase

This holder is also in profit, obviously, but their gains would be just around 3% at the moment, notably less than what the other whale would have managed to make.

The latest rise in PEPE has come as the original meme coin, Dogecoin, has also been enjoying bullish winds recently. While the former is still significantly in the red in the past week, the latter has outperformed the top assets with its 15% gains.

PEPE Market Cap

The sharp 13% surge during the past day has naturally meant that the meme coin’s standing in the wider cryptocurrency market has improved. At present, PEPE is 71st on the market cap list, as its total valuation is around $552 million currently.

At the time of writing, PEPE is trading around $0.000001408, up 13% in the last day.

PEPE Market Cap