Polkadot, the computing platform known for its interoperability and scalability, has shown remarkable growth in key metrics during the latter part of 2023, as outlined in a recent report by Messari.
Outpacing Crypto Market Growth
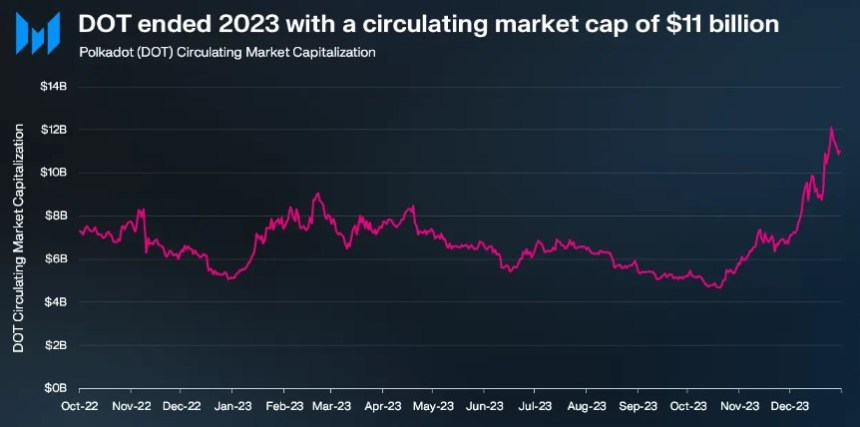
According to Messari’s findings, Polkadot’s circulating market cap experienced a remarkable 111% quarter-on-quarter (QoQ) growth, reaching an impressive $8.38 billion.
This growth outpaced the overall crypto market’s growth of 54% during the same period. Furthermore, Polkadot’s year-on-year (YoY) change reached 94%, solidifying its position among the top 15 crypto projects by market capitalization.
In terms of revenue, Polkadot witnessed a substantial surge of 2,880% QoQ, generating $2.8 million in Q4 2023. This surge was primarily attributed to the significant rise in extrinsic, driven by the introduction of Polkadot Inscriptions.
Messari suggests that even excluding the four-day spike from the Inscriptions, Polkadot’s revenue would have doubled from the previous quarter. It is worth noting that Polkadot’s revenue tends to be relatively lower compared to its competitors due to the structural design of its network.
Polkadot Witnesses Significant Increase In Active Addresses
Following the launch of OpenGov – the governance module and framework within the network – in June, the Polkadot Relay Chain experienced a surge in account activity, largely due to increased governance participation.
Because the Relay Chain is critical in facilitating governance processes, it experienced a spike in active addresses on October 24, when users claimed their locked DOT tokens from the first batch of parachain auctions held two years earlier.
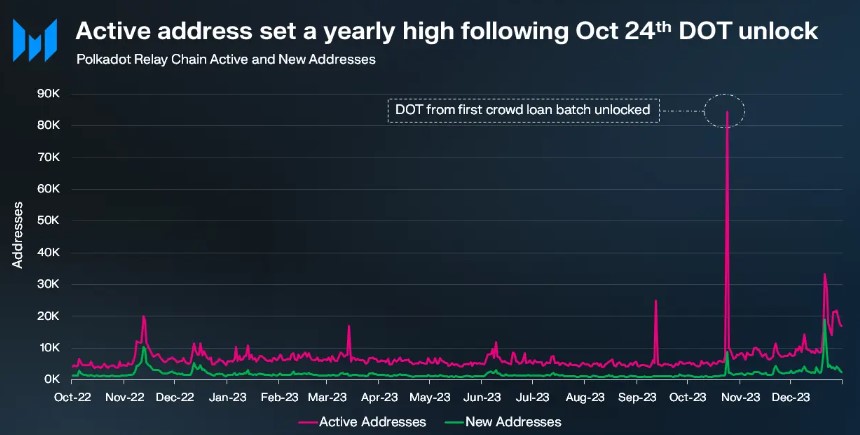
Throughout Q4, the Polkadot Relay Chain averaged over 10,000 daily active addresses, representing a substantial 90% QoQ increase. Excluding the October 24th activity related to DOT token claiming, the average number of active addresses still saw a significant 70% rise in QoQ, reaching 9,000.
Additionally, Cross-Chain Message (XCM) transfers on the platform increased by 150% QoQ, reaching an all-time high of 133,000. The total number of active XCM channels nearly tripled in 2023, reaching 203 by the end of the year.
According to Electric Capital’s rankings, Polkadot has 800 full-time and 2,100 total developers, making it one of the largest crypto ecosystems in developer participation.
DOT Price Shows Mixed Performance
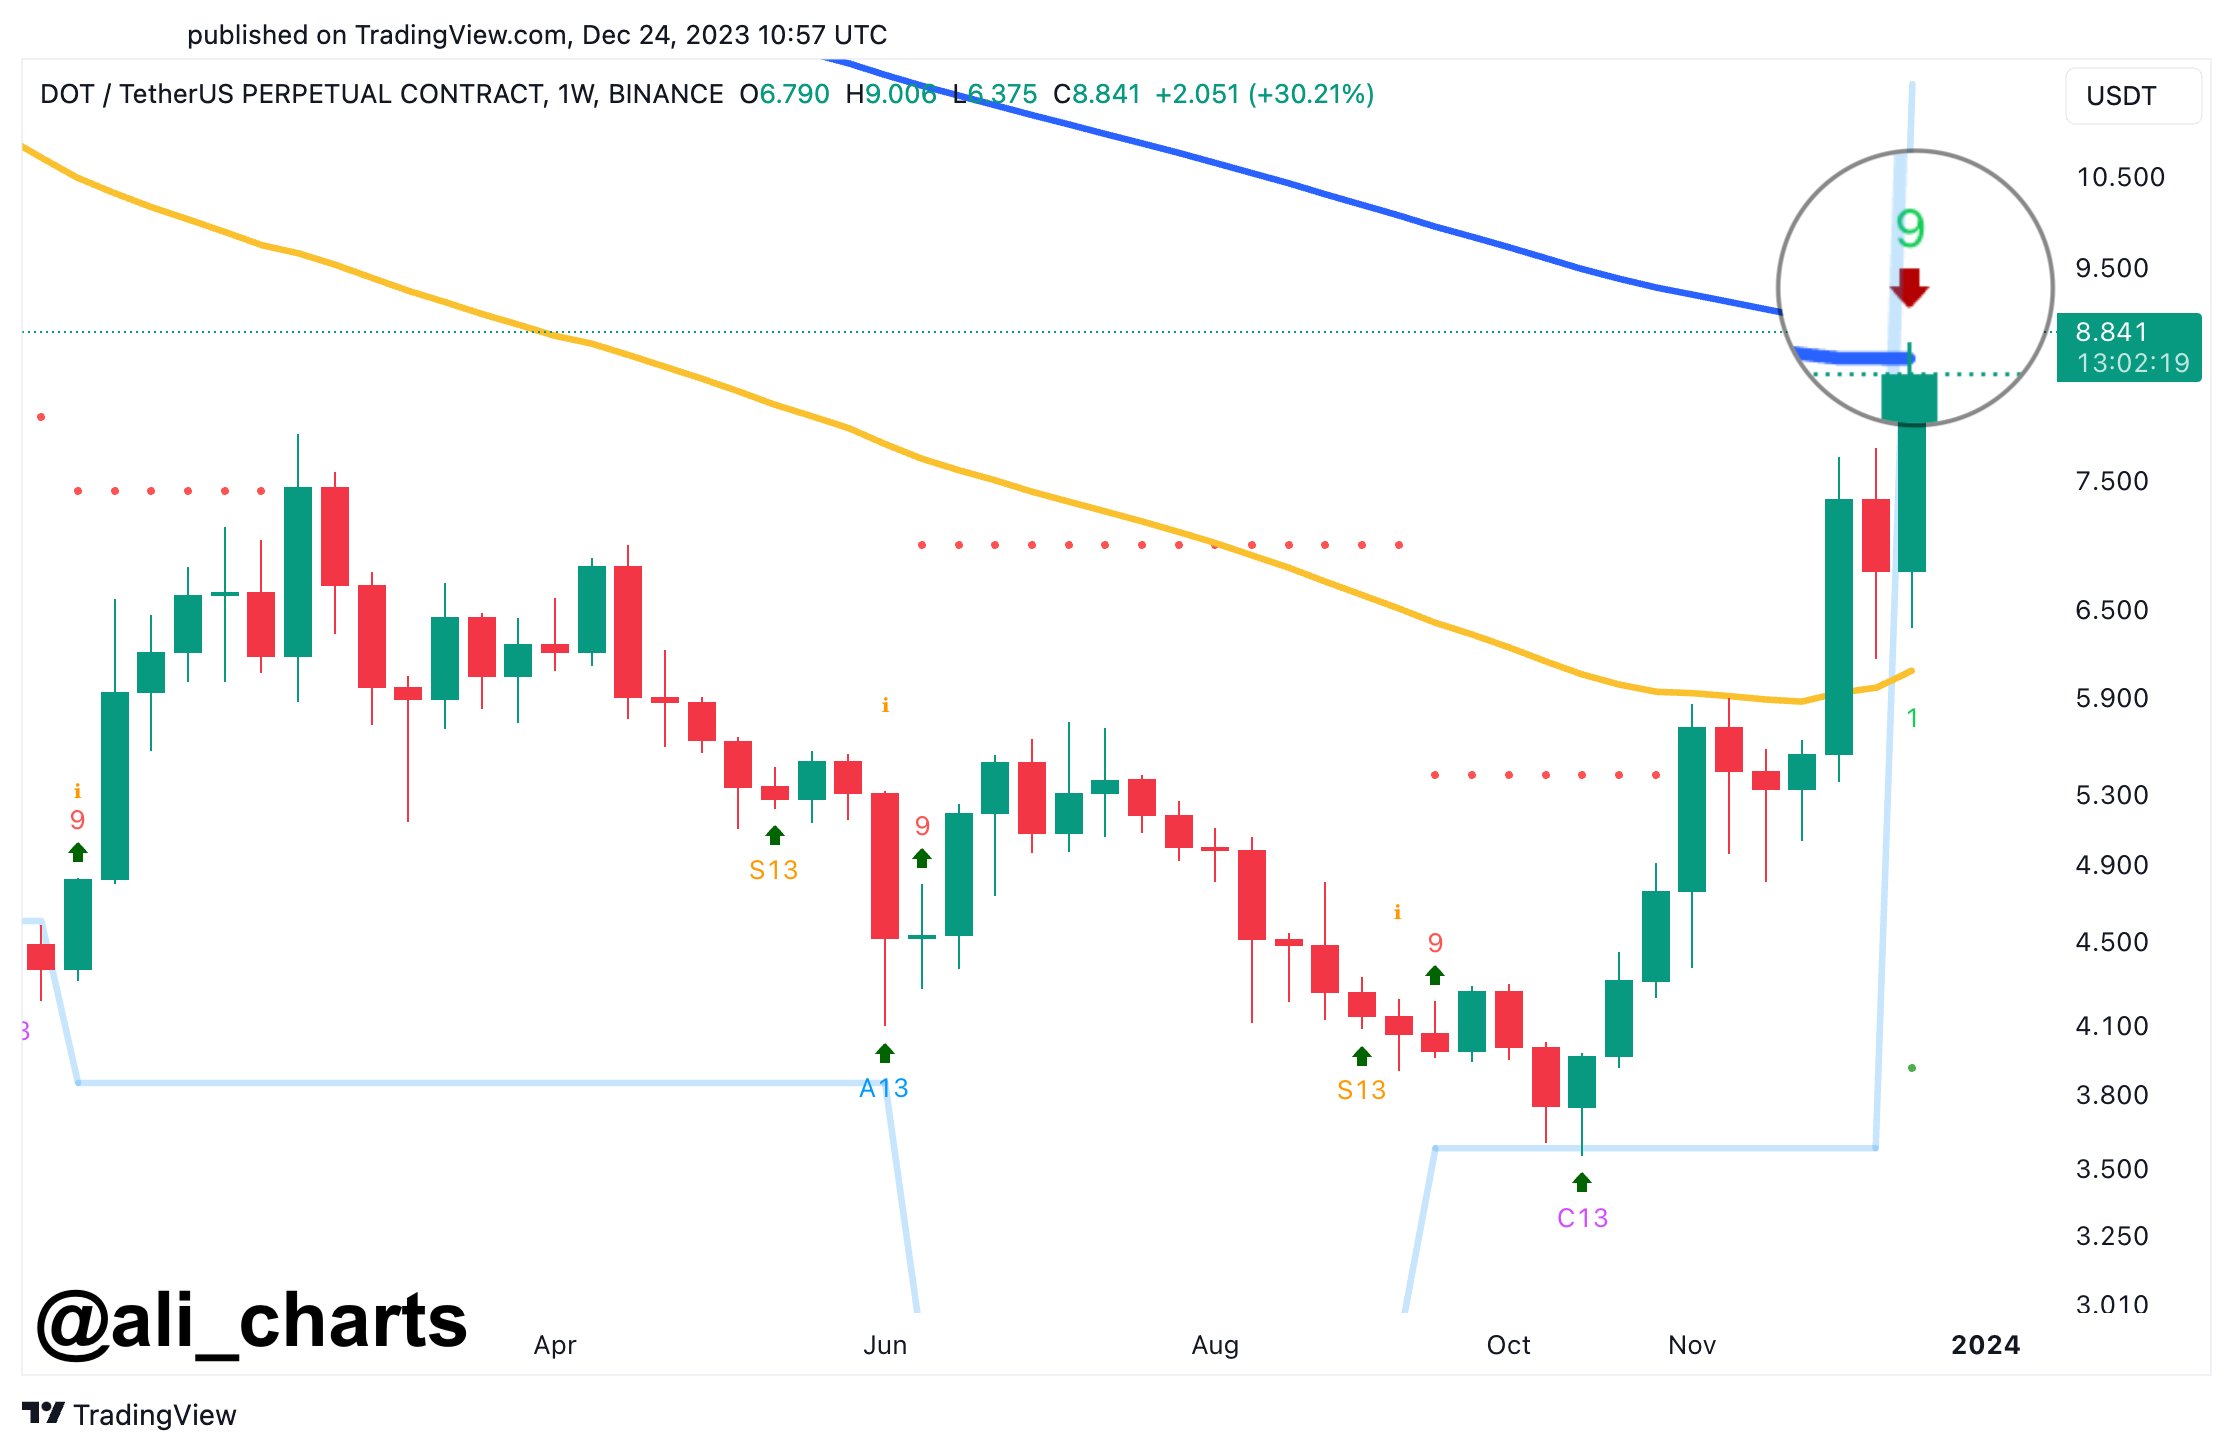
Despite notable growth in key metrics demonstrating the network’s expansion, the price of Polkadot’s native token, DOT, has not followed suit and has even experienced declines over longer time frames despite positive developments.
Currently, DOT is trading at $6.7420, representing a slight 0.3% price increase in the past twenty-four hours, coupled with a 9% year-to-date gain.
However, over the past fourteen and thirty days, the token has recorded a 6% and 22% price drop, highlighting the absence of bullish momentum and catalysts that could propel DOT to higher levels.
Although it reached a 19-month high of $9.5711 on December 26, the subsequent price drop has led DOT to a critical juncture, potentially erasing its gains over the past year.
If the current level and its nearest support at $6.3229 fail to halt further price declines, DOT could potentially drop to the $5.4830 level, which serves as the next major support in the token’s 1-day chart.
Conversely, if DOT surpasses its upper resistance at $7.0392, the next objective would be to break the short-term downtrend structure, facing the $7.5332 resistance and another resistance at $8.1631. This would pave the way for another consolidation phase at its 19-month high.
Featured image from Shutterstock, chart from TradingView.com