
This article provides a deep dive into leased proof-of-stake (LPoS), establishing how it works, its benefits, key features and its role in blockchains.
Cryptocurrency Financial News
This article provides a deep dive into leased proof-of-stake (LPoS), establishing how it works, its benefits, key features and its role in blockchains.

Mihailo Bjelic suggested that adding zero-knowledge proof technology could bolster the network’s security while still keeping fees low.


A Nansen in December noted that Ether staking solutions had been in high demand since Ethereum’s shift to proof-of-stake.


Lido protocol boasts $1 million in daily fee revenue for nearly a month, highlighting its growth in daily active users and Ethereum stakers.


Aptos’ blockchain claims to handle three times the amount of transactions per second than Solana but day one of its launch saw the network transacting a much lower amount.
The second largest cryptocurrency is making a new wave in space in inflows, Ethereum and its related products recorded massive inflows for a second week consecutively. CoinShares’ weekly fund flow report data indicated a total inflow of $5.6 million for Ethereum and its related products.
Data for the overall investment products of digital assets was about $10.3 million in inflows last week. In addition, the report noted that this is the third consecutive week of inflows for virtual assets. However, investors are still hesitant about the low flows.
Also, last week’s trading volumes of investment products amounted to $886 million. This is the lowest value recorded since October 2020.
For Bitcoin, it was a case of recording its third week of minor inflows of about $7.7 million. In addition, the primary crypto asset had its short recording inflow of approximately $2.1 million last week.
Other Altcoins Recorded Outflows For Last Week
The altcoins, with the exemption of Ethereum, had negative trends with outflows for last week. They recorded a total flow of about $3.5 million. Most assets with higher outflows include Cardano, Avalanche, and Polygon. Their outflows were $0.5 million, $0.8 million, and $0.9 million, respectively.
Last week, XRP and Cardano products recorded their first outflows of $300,000 and $500,000 since August. The values are on the high side in comparison with their previous inflows. Both tokens had recently encountered a drastic drop in their values, creating more fear in the minds of investors and traders.
Some areas recorded minor outflows during the last week. Except for Sweden, which had an inflow of $16 million, most European nations saw outflows. Also, Germany saw outflows amounting to about $9.1 million. But the US noted a cumulative inflow of about $7.7 million.
The statistical data for the month-to-month outflows for digital assets investment products is about $42.6 million. The year-to-year inflows are cumulatively at $448 million.
Ethereum Merge And Ethereum Outflows
There were some outflows from ETH-related products from the period preceding the Ethereum Merge on September 15. This is due to the division in sentiment concerning the Merge. While some believed that the transition to PoS would bring a price hike for Ethereum and its derivatives, some had a contrary opinion.
Hence, some investors hastened to sell off their holdings before the Merge creating increased outflows for the network during the period. But some decided to stick with the transition keeping their holdings intact. They opted to stake their Ether.
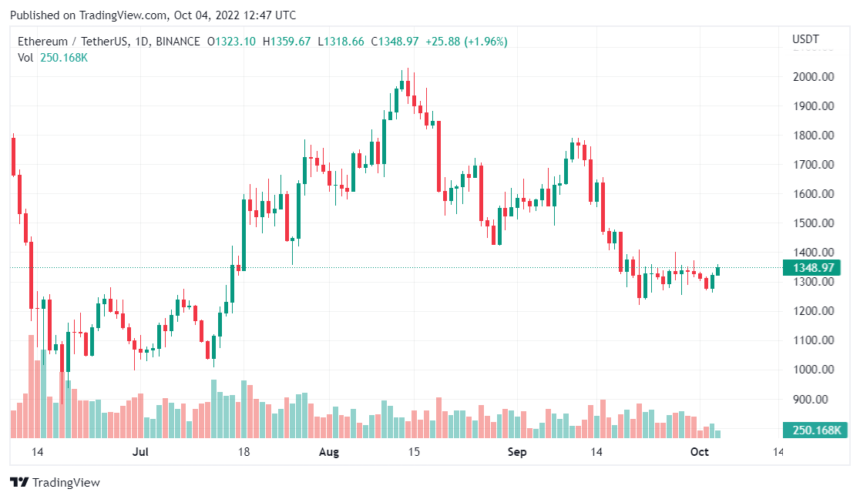
Ethereum follows an uptrend on the chart l ETHUSDT on Tradingview.com
Following the completion of the Merge event, the demand for Ethereum-related products is gradually rising. This resulted in the inflows for the products within the past two weeks.
Featured image from Pixabay, Chart: TradingView.com
As the integration has progressed, Ethereum’s price has slid precipitously. Since the general financial markets are facing a period of extreme pessimism, ETH could continue to fall over the next few days.
On the morning of September 15th, the Merge went into effect. The price of ETH dropped 11.91 percent during the day, wiping off all of the gains it has made since September 14.
The outlook for ETH after the integration is bleak because it suggests the crypto winter will continue through the summer months.
In the time after this article was written, the coin’s price has found support near the 61.80 Fib level, at around $1,329.91. A portion of the Donchian channel’s lower section has also been explored by the bears. This shift indicates a deeper descending pressure.
ETH Rebound Still A Big Possibility
ETH’s recovery is feasible, but only in the far future, as the Merge raised more concerns than it answered, and the broader financial markets are still battling to reestablish confidence.
A positive outlook for Ethereum’s future is something this occasion is meant to instill in traders and investors. Traders and investors, however, believe that the proof-of-stake system is a wrong turn for ETH.
According to a post in r/CryptoCurrency on Reddit, the proof-of-stake mechanism benefits the wealthy at the expense of the poor. Investors and dealers are under increased pressure to sell because of the combination of current market circumstances and skepticism surrounding the upgrade.
Momentum and stochastic RSI indicators reveal this information. The present convergence of the Stoch RSI is bearish, indicating that investor sentiment is at an all-time low.
Ethereum Bulls Feeling The Pain
Additionally, ETH’s momentum is a staggering -410.90. The bulls are experiencing anxiety in the broader financial markets and the Merge.
Ethereum also closely follows Bitcoin. As of the time of writing, the correlation coefficient is 0.69, indicating that the price fluctuations of the two closely track one another.
With the crypto market on a downward trend, it is easy to assert that ETH’s investors and traders are in it for the long haul.
Gary Gensler, chairman of the Securities and Exchange Commission, stated that staking might classify Ethereum as a security, exposing ETH to legal difficulties.
Ethereum is not, however, the only cryptocurrency that uses proof-of-stake. ADA, SOL, and DOT are based on the proof-of-stake protocol.
If Ethereum is categorized as a security, the other currencies could be subject to regulatory investigation, leading to additional price declines for Ethereum and other proof-of-stake currencies.
In the short run, $1,329.91 has proven to be a price level that can survive a bearish assault. Only time will tell whether Ethereum will rebound from this decline.
ETH total market cap at $164.5 billion on the daily chart | Source: TradingView.com
Featured image from Coinpedia, Chart: TradingView.com
(The analysis represents the author’s personal views and should not be construed as investment advice).

ETHW Core plans to split off from the main ETH blockchain and maintain a PoW version to keep ETH mining alive beyond The Merge.
This is the weirdest bear market to date. It seems like most people were prepared for it, even though the death spirals and Chapter 11 bankruptcies that started it came out of nowhere. In any case, every coin is in the red. The market should be in a state of fear, uncertainty, and doubt. That is certainly not the case for the two leading cryptocurrencies. The circumstances might be different for each one, but both markets show signs of unwavering conviction.
Long-time holders of bitcoin and ethereum seem to be laughing in the bear market ’s face. In the latest edition of The Wolf Den, the author uses Glassnode and Intotheblock’s data to show us how this is true.
The Bear Market Vs. Bitcoin
“On-chain evidence from Glassnode suggests that there has been no meaningful reduction in the conviction of long term believers,” the newsletter states. To prove this, The Wolf Den looks at the “Dormancy Metric.” The number that “tracks the average age of every Bitcoin that moves, determined by when it was mined. One of the ways to gauge the sentiment of long-term holders is to asses the average age of coins moving around the market.”
As attentive readers might suspect, the coins that are “moving around the market” are extremely young. In fact, their age “is at multi-year lows. The dormancy value is very low.” This is consistent with previous bear markets, in which dormancy values tend to be low. The newsletter quotes analysis from Glassnode:
“The decline in lifespan metrics actually bodes well for the longer-term, as it indicates old coins are stationary, and declining prices have little psychological impact on this cohort’s conviction.”
So, if we focus on the big picture, everything looks like it’s supposed to. A healthy habit during bear markets.
BTC price chart for 09/02/2022 on Cexio | Source: BTC/USD on TradingView.com
The Ethereum Merge Is Upon Us
For this section, The Wolf Den used data from IntoTheBlock. Before getting into it, the author clarified the sequence of events that compose the mythical “merge”. First of all, on September 6th, “the Bellatrix upgrade happens on the Beacon chain”. Then, between September 10th and 20th, “the official transition from Proof-of-Work (PoW) to Proof-of-Stake (PoS) will occur”. The Ethereum Foundation estimates that the merge will happen on September 15th.
To evaluate the Ethereum network’s state during this bear market, The Wolf Den looked into “netflows onto centralized exchanges”. Overall, more ETH is leaving the exchanges than entering, which is bullish. It tends to mean people are not looking to sell their assets. However, with the merge looming and the bear market among us, it could have other meanings.
On the one hand, people might be “bullish on the merge as users believe that the merge will happen successfully and are loading up on ETH for potential price action.” On the other, they might be anticipating the possible ETH Proof-Of-Work hard fork. If that happens, “all ETH being held in wallets can claim ETHW at a 1:1 ratio, traders might be preparing themselves to claim the most ETHW possible.”
Another curiosity about the bear market’s current state is this. Lately “the average inflow transaction size is generally larger than its outflow counterpart”. According to The Wolf Den, that’s not a problem because “netflows onto centralized exchanges” are low. And that’s a stronger indicator. However, those large inflow transactions might suggest something that makes sense. “Larger traders and institutional investors are more skeptical about the success of the merge”.
In any case, long-time bitcoin and ethereum holders show unwavering conviction despite the bear market’s conditions. For different reasons altogether.
Featured Image by congerdesign from Pixabay | Charts by TradingView

The difficulty bomb has been successfully delayed according to core dev Tim Beiko and Ethereum ecosystem developer Nethermind.
The worsening condition of the crypto market has seeped through Ethereum. The market cap of Ethereum was purged by more than $100 billion last month.
Ethereum was trading at $1,809.49, down -6.9% Wednesday, chart by Coingecko shows.
The bearish market stance is getting more consistent as Ethereum appears to settle at its comfort zone and trade below $4,000 this year.
Being second in line to the top crypto Bitcoin, Ethereum remains unassailable, with it maintaining its ranking as the second-biggest cryptocurrency in terms of market cap. ETH closed May with a market cap of more than $235 billion.
The price action revealed a staggering 31% plunge compared to its market value on an opening day. May 1 gave ETH that hint of hope when its trading volume hovered over $15.33 billion with a whopping market cap of $341.05 billion.
Suggested Reading | Axie Infinity Revenue Continues To Collapse – Here’s Why
ETH Price On A Downward Trend
Investor confidence waned in 2022, which propelled a massive sell-off of crypto assets. The panic worsened from May 9 to 13 because of Ethereum’s market cap drop.
The negative market sentiment was brought about by the dwindling economic situation, inflation, Russia’s invasion of Ukraine, and increase in interest rates.
ETH transactions in May reached over 16,950 at $1,947. This was followed by a humongous transaction amounting to 12.25 million ETH or equivalent to roughly $23.86 billion.
ETH opened at a price action of $2,072 and had a $1,748 intraday low. Trading volume registered at $42.46 billion, which signifies a market cap of $236.88 billion.
ETH total market cap at $218 billion on the daily chart | Source: TradingView.com
The figures show a collapse of 30% in ETH’s opening day market value. And experts say the lowest point of ETH can extend to July 2021.
What Triggered ETH’s Price Drop?
Ether has been down for the past few weeks. The following are the factors that could have attributed to its price drop:
Suggested Reading | Bitcoin Market Cap Shed Over $120-B Last Month – How Much More Can It Lose?
Ethereum advocates still continuously devour this digital asset despite the market remaining bearish.
ETH’s opening day on May 1 had its trading values at $2,730, which maneuvered to a monthly high of $2,957 come May 5. It tested on May 27 at a monthly low of $1,721 and then closed the month of May at $1,942.
The values ultimately show a reduction of 28% when comparing the values from the opening to the closing price of Ethereum in May.
Featured image from Daily Express, chart from TradingView.com

Ether could continue dropping against the U.S. dollar in a high interest-rate environment.

Solana Pay is an open protocol for developers to build on and customize, with standardized payment criteria.

MATIC price is still 50% below its all-time high, but the network’s TVL and DApp data hint that the layer-2 solution remains a serious contender.

The migration to the proof-of-stake consensus appears to be progressing well by all numerical accounts, potentially signifying an anticipatory demand for the network’s long-awaited upgrade.

“Gaming is the best use case the world has ever seen for blockchain and I believe we will see 10 million wallets interacting with blockchain games before the end of this year,” said Oasys founding member Gabby Dizon.

“By removing Eth2 terminology, we save all future users from navigating this confusing mental model,” the Ethereum Foundation stated.

An individual miner defied the odds and managed to collect 168 ETH from a solo mining pool this week worth 42 times the average block reward.

The second-largest cryptocurrency falls 13.30% versus Bitcoin’s 9.38% decline as China’s move scares investors away.

The upgrade to Ethereum 2.0 comes with many changes, including the migration to the proof-of-stake consensus algorithm, believed to make the network more secure and compensate participants accordingly.


