The cryptocurrency market has been battered by recent storms, with many altcoins experiencing significant price drops. XRP, however, seems to be weathering the tempest with a hint of defiance. While its price has dipped, on-chain data reveals intriguing trends that suggest a potential silver lining for XRP investors.
XRP Accumulation On The Rise: Diamond Hands Or Whale Whispers?
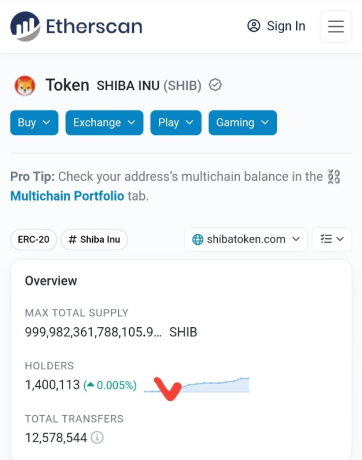
Despite the price decline, a surprising trend has emerged. The number of investors holding between a thousand and 1 million XRP tokens has actually grown by 0.20% over the past month, according to data from Santiment. This could signify a growing population of “diamond hands” – investors who hold onto their XRP despite market volatility, believing in its long-term potential.
However, another possibility exists. The decrease in the number of whales holding between 1,000 and 1 million XRP tokens could indicate these larger investors are consolidating their holdings, potentially accumulating even greater amounts of XRP. This consolidation could be a precursor to future market moves by these whales.
Technical Indicators Whisper Of A Price Reversal: Bullish Undercurrents?
Technical analysis paints a cautiously optimistic picture for XRP. The Chaikin Money Flow (CMF), an indicator that tracks the flow of money into and out of an asset, has been trending upwards despite the price decline.
This “bullish divergence” suggests that even as the price falls, there might be a hidden buying force accumulating XRP. Investors might be interpreting the price drop as a buying opportunity, anticipating a future upswing.
A Sea Of Uncertainty: Legal Battles And Market Headwinds
While the on-chain data and technical indicators offer some positive signs, it’s crucial to acknowledge the storm clouds still lingering over XRP. The ongoing legal battle between Ripple Labs, the company behind XRP, and the US Securities and Exchange Commission (SEC) continues to cast a shadow. The outcome of this case could significantly impact XRP’s price and overall market perception.
Furthermore, the general health of the cryptocurrency market remains a significant factor. If the broader market continues its downward trend, it could drag XRP down with it, regardless of any positive on-chain developments.
A Coin To Watch?
XRP’s current situation is a curious mix of resilience and vulnerability. The uptick in smaller investors and potential whale consolidation suggest some underlying belief in XRP’s future. The technical indicators hint at a possible price reversal, but the legal battle and broader market uncertainties create a complex landscape.
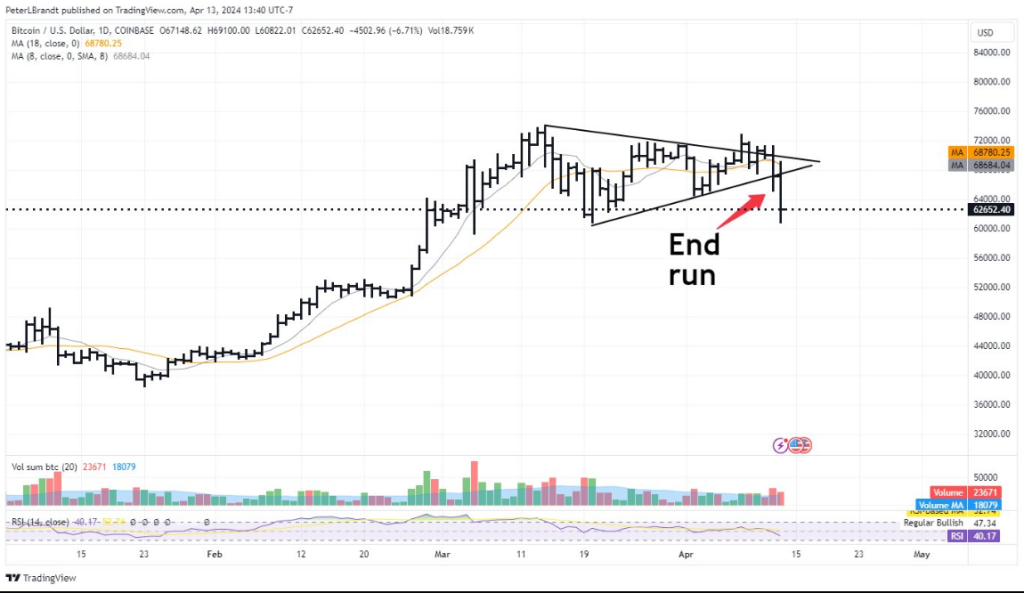
Featured image from VitalMTB, chart from TradingView

 Crypto (@MikybullCrypto)
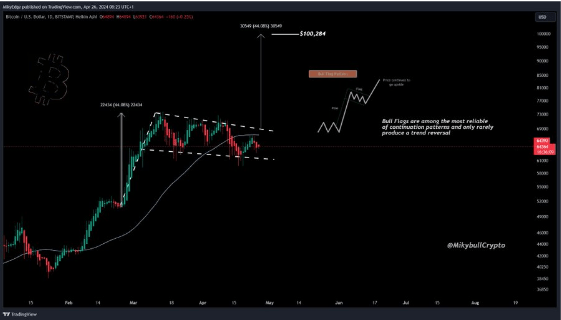

 The measured move suggests a target range between Fib 0.702-0.786 (0.38-0.47c),…
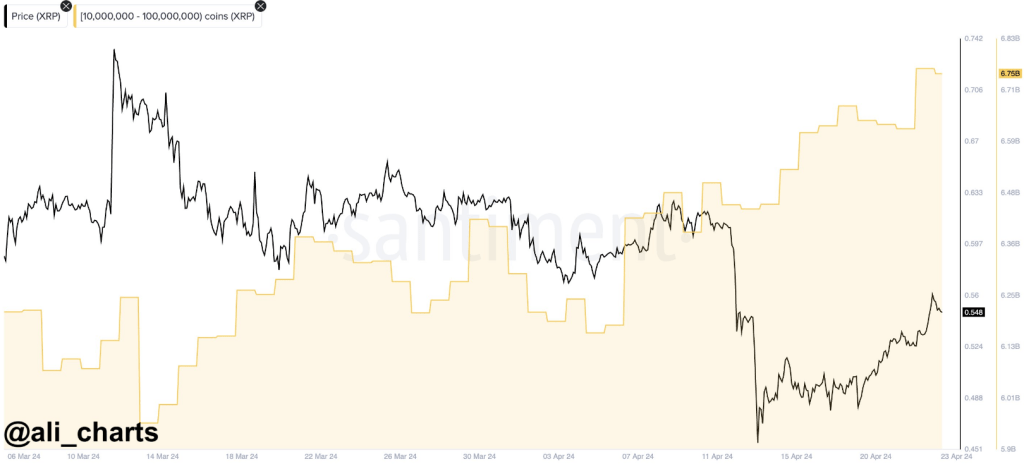
 The price of
  Macro target 1 – $70
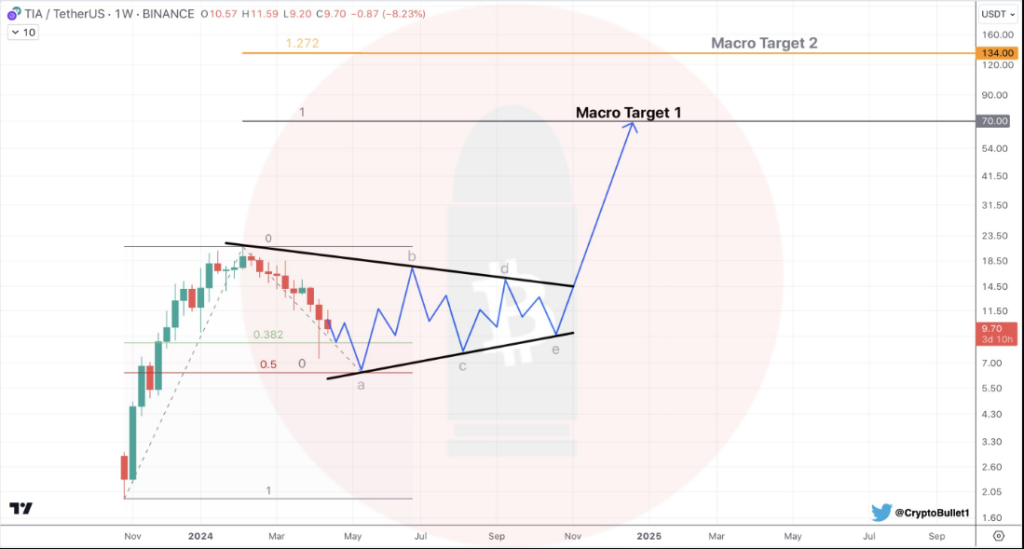

 MARKS (@JavonTM1)

 As
As