Bitcoin’s drop to $56,500 crushed bullish traders’ sentiment and took a heavy toll on altcoin prices but are generational buying opportunities emerging?
Cryptocurrency Financial News
Bitcoin’s drop to $56,500 crushed bullish traders’ sentiment and took a heavy toll on altcoin prices but are generational buying opportunities emerging?
Solana, the self-proclaimed high-speed blockchain darling, finds itself facing an uphill battle. A confluence of a broader crypto market downturn and persistent network congestion threatens to stall its momentum and cast doubt on its long-term viability.
The recent crypto market correction hasn’t spared Solana. The token, which enjoyed a stellar run for months, has mirrored the overall slump. On Tuesday, April 30th, Solana dipped to $127, marking a daily decline of 4% and a weekly drop exceeding 10%.
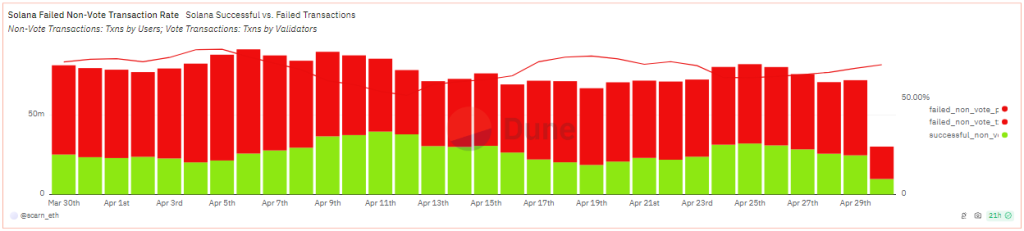
While the market downturn is a concern, a more pressing issue for Solana seems to be its network congestion woes. Recent updates aimed at fixing a bug related to the QUIC protocol haven’t delivered the promised network decongestion.
As of April 29th, the transaction failure rate remained stubbornly high at over 65%. This persistent network sluggishness directly contradicts Solana’s core value proposition of high transaction speed and efficiency.
The congestion issues are particularly worrisome for sectors like Decentralized Finance (DeFi) and Non-Fungible Tokens (NFTs), which rely heavily on fast and reliable transactions. Solana has carved a niche for itself in these areas, and prolonged congestion could tarnish its reputation and deter future projects and users.
Investor Optimism On Hold, But Long-Term Signals Remain
Interestingly, investor reaction to the congestion hasn’t been overwhelmingly negative – yet. Solana’s price movement has largely mirrored the broader market trend, suggesting investors might be taking a wait-and-see approach.
Perhaps there’s a flicker of hope that Solana can overcome these challenges. While the short-term technical indicators paint a bleak picture, some long-term signals, like the 200-day moving averages, still offer a glimmer of optimism.
Solana At A Crossroads
The coming weeks and months will be crucial for Solana. Can it address the network congestion issues definitively? Will it be able to regain the trust of developers and investors shaken by the recent performance?
Solana’s future hinges on its ability to navigate these rough waters. If it can overcome these hurdles and emerge with a more robust and scalable network, it might just weather the storm and reclaim its position as a leader in the blockchain space.
However, if the congestion problems persist, Solana could find itself falling behind competitors who can offer a smoother and more reliable user experience.
Featured image from Pexels, chart from TradingView
Shiba Inu (SHIB), the meme coin with a loyal following, experienced a whirlwind of activity in the Japanese market this week. The catalyst? The listing of a new SHIB/JPY trading pair on Binance Japan, a move that initially sent the price soaring.
On April 30th, Binance Japan announced the addition of the SHIB/JPY pair to its spot trading platform. This move provided Japanese investors with a convenient way to trade SHIB directly with their yen, eliminating the need for currency conversions. The news was met with excitement in the Shiba Inu community, particularly in Japan, where the dog-themed coin enjoys a strong following.
Binanceジャパンが2024年4月30日17:00より現物取引において日本円建ての取引ペア #SHIB/JPY を追加。
上記取引ペアは現在実施中の売買取引手数料無料キャンペーンの対象で、期間中はメイカー手数料およびテイカー手数料ともに無料とのこと。https://t.co/Fus96RbCN5
— KURO
SHIBARMY JPN
(@kuro_9696_9696) April 30, 2024
Following the listing, SHIB experienced a momentary surge, with its price briefly reaching ¥0.016666 (approximately $0.00011). This represented a staggering 360% increase from the opening trading price of the pair.
A prominent Japanese Shiba Inu community member, KURO, documented the surge on social media, further fueling the buzz.
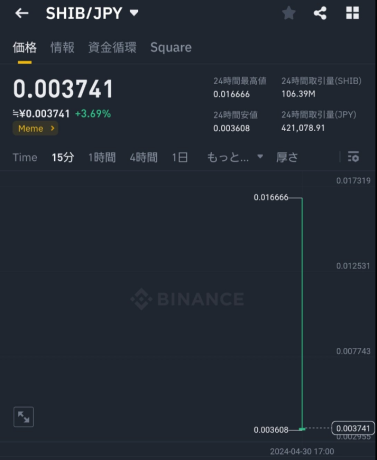
However, the jubilation proved short-lived. The price quickly stabilized at a much lower point, ¥0.003741 (around $0.000024), highlighting the volatility inherent in the cryptocurrency market. While the initial spike generated excitement, it’s crucial to remember that such surges are often fleeting and don’t necessarily translate to long-term growth.
一瞬だけSHIB 0.016666円
#柴犬コイン #シバイヌコイン https://t.co/asKUDx4Omu pic.twitter.com/DeBtIV9iYw
— KURO
The impact of the Binance Japan listing on SHIB’s long-term price trajectory remains to be seen. While it undoubtedly increased accessibility for Japanese investors, several factors will determine the coin’s future performance.
The cryptocurrency market itself is currently facing headwinds. Bitcoin, the world’s leading cryptocurrency, has seen a significant price correction in recent months, dragging other digital assets down with it. SHIB’s fate is likely intertwined with the overall market sentiment.
The success of the Shiba Inu development team’s ongoing projects, such as the Shibarium Layer 2 blockchain and token burning initiatives, could significantly impact the coin’s value proposition. If these projects gain traction and deliver on their promises, they could attract more investors and drive up demand for SHIB.
The Rise Of Litecoin As A Fiat Onramp
Interestingly, the increased focus on fiat-to-crypto gateways like the SHIB/JPY pair coincides with the growing popularity of Litecoin (LTC) as a method to buy other cryptocurrencies. Unlike Bitcoin, Litecoin boasts faster transaction times and lower fees, making it an attractive option for investors seeking a smoother entry point into the crypto market.
Whether LTC can capitalize on this trend and establish itself as a preferred fiat onramp remains to be seen, but it presents an alternative pathway for those hesitant about the volatility associated with direct fiat-to-meme coin purchases.
Featured image from Pexels, chart from TradingView
The cryptocurrency market continues to navigate a period of sluggishness. Yet, a recent whale activity has injected a flicker of hope for XRP, the native token of Ripple. On Tuesday, a significant investor, commonly referred to as a whale, acquired a hefty 23 million XRP, sparking renewed interest in the embattled token.
The purchase was identified by Whale Alert, a platform that tracks large cryptocurrency transactions. The tokens originated from a Binance exchange wallet, with the recipient address remaining undisclosed. However, the fact that the recipient was a Binance user suggests potential for further trading activity.
This whale movement is seen by some analysts as a potential turning point for XRP. Historically, large-scale purchases by whales have often preceded price surges. However, some experts caution against overinterpretation. Whale activity can be driven by various factors, and a single purchase doesn’t guarantee a sustained upward trend for XRP.
23,037,429 #XRP (11,550,284 USD) transferred from #Binance to unknown wallethttps://t.co/K00G3Ry7ab
— Whale Alert (@whale_alert) April 29, 2024
Adding a layer of complexity is the recent decline in XRP Open Interest (OI). As per data from Coinalyze, XRP OI has dipped by 2.12% over the past 24 hours. Open Interest reflects the total value of outstanding futures contracts for a particular cryptocurrency. A decrease suggests a potential reduction in leveraged positions, which could indicate short-term selling pressure.
However, analysts point out that the perpetual contracts, which constitute the majority of XRP OI, still hold significant weight at over $374 million. A renewed buying spree could trigger a reversal in the Open Interest trend, potentially propelling the price upwards.
The Lingering Shadow Of The SEC Lawsuit
It’s impossible to discuss XRP’s future without acknowledging the ongoing legal battle with the US Securities and Exchange Commission (SEC). The lawsuit, which alleges XRP is an unregistered security, has undoubtedly cast a long shadow over the token’s performance.
While the recent “remedies phase” of the lawsuit hints at a potential settlement, investors remain cautious. The final outcome and its timeline are still uncertain, leaving a cloud of ambiguity over XRP’s regulatory status.
XRP Price Outlook: A Glimmer Of Optimism?
Currently, XRP is trading at around $0.50, a significant drop from its all-time high of over $3. The price reflects the broader market slump and the ongoing legal battle.
The recent whale purchase, coupled with ongoing negotiations in the SEC lawsuit, offers a glimmer of hope for XRP bulls. However, a sustained price increase hinges on several factors. A favorable resolution to the lawsuit and a broader market recovery are crucial for XRP to regain its lost ground.
Featured image from Pexels, chart from TradingView

Bitcoin and altcoins are falling toward strong support levels, which appear likely to hold in the short term.
Polygon (MATIC), the high-speed scaling solution for Ethereum, has been on a rollercoaster ride this month. After a brutal price correction that saw MATIC tumble over 20%, a recent 24-hour surge has injected a dose of optimism into the market. But is this a sign of a full recovery, or a temporary reprieve before further decline?
CoinMarketCap data paints a sobering picture. MATIC has been steadily dropping down the ranks of the top 20 cryptocurrencies, currently sitting at number 18. This decline coincides with a significant price drop, with MATIC losing over a quarter of its value in the last 30 days.
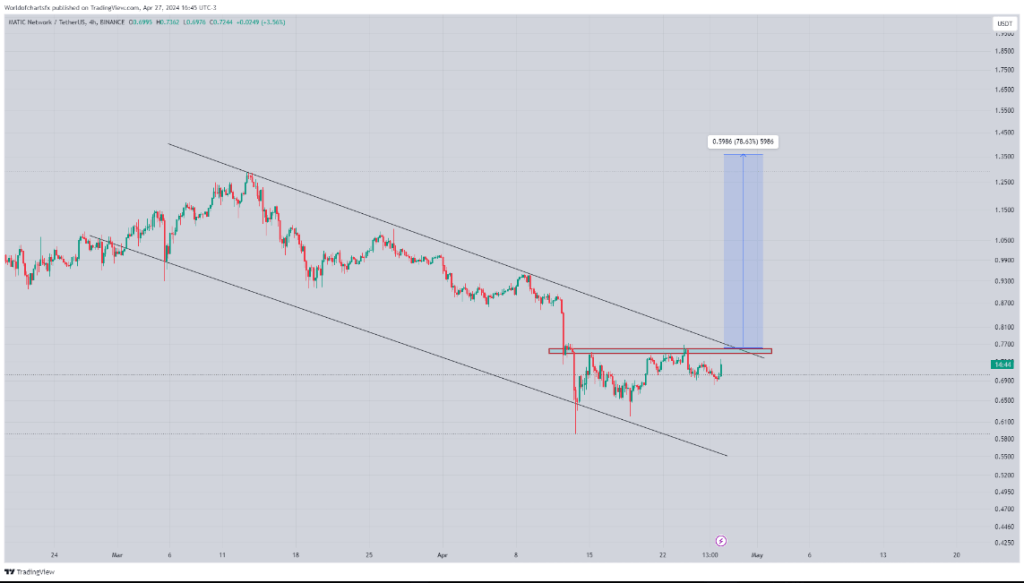
Analysts like World of Charts point to the descending channel pattern on MATIC’s daily chart, a classic indicator of a bearish trend. For a true price recovery, MATIC needs to overcome a crucial hurdle: the $0.77 resistance level. A breakout above this point could trigger a significant bull run to the $1 dollar level, but the climb won’t be easy.
$Matic#Matic Still Nothing Has Changed Consolidating In Descending Channel Successful Breakout Can Lead Massive Bullish Wave In Coming Days https://t.co/RBiSg4kaGb pic.twitter.com/fUwIbyW2hA
— World Of Charts (@WorldOfCharts1) April 27, 2024
The past 24 hours have offered a glimmer of hope for Polygon bulls. The token price surged by 5%, briefly eclipsing the $0.74 mark. This uptick coincides with an improvement in the MVRV ratio, which suggests a rise in the number of profitable MATIC investors.
Additionally, the bullish crossover on the MACD indicator hints at a potential increase in buying pressure. However, beneath the surface, some concerning trends remain.
Despite the recent price uptick, data suggests substantial selling pressure on Polygon. The exchange inflow has increased significantly, indicating investors moving tokens onto exchanges, often a precursor to selling. This trend is further corroborated by a rise in MATIC’s supply on exchanges, while the supply held outside of exchanges has dwindled.
Technical Indicators Paint A Mixed Picture
While the MACD offers a glimmer of hope, other technical indicators remain bearish. The Bollinger Bands suggest reduced volatility, which can be a sign of consolidation before a breakout or a further price drop. Both the Money Flow Index (MFI) and Chaikin Money Flow (CMF) have registered downticks, potentially signaling the end of the short-lived bull rally.
Polygon’s Path Forward
While the technical outlook for Polygon remains uncertain, a complete reversal isn’t out of the question. Continued positive developments within the Polygon ecosystem, coupled with broader market recovery, could propel MATIC upwards.
However, overcoming the selling pressure and technical resistance levels will be crucial for a sustained bull run. Investors should exercise caution and closely monitor market developments before making any investment decisions.
Featured image from Pexels, chart from TradingView
Bitcoin’s range-bound price action could lead traders to focus on NEAR, AR, CORE and BONK.
Render (RNDR), the cloud-based rendering network, is stirring excitement in the crypto market with technical indicators and analyst predictions hinting at a substantial price surge in the coming weeks or months.
Technical analysis paints a bullish picture for RNDR. The token has recently broken out of a bullish technical pattern known as the Dragon Pattern, also referred to as the supply line. This breakout historically signifies a potential shift in momentum, with prices likely to trend upwards.
Adding fuel to the fire, analysts are observing the formation of Three Rising Valleys on RNDR’s chart. This pattern suggests a potential market bottom has been established, indicating a reversal from previous downward trends.
Furthermore, a bullish divergence on the four-hour chart hints at weakening selling pressure. In simpler terms, sellers are struggling to push prices down, failing to break below previous lows.
$RENDER – It’s looking bullish in my opinion.
Here is why
• Dragon pattern aka the supply line which broke out already.
• Potential 3 rising valleys in the making while we established a potential bottom.
• 4 hour bullish divergence which means that sellers had a hard… pic.twitter.com/jMBzXWyG81
— Doji
(@SatsDoji) April 25, 2024
DoJi, a prominent crypto analyst, sees these technical indicators as a recipe for a price surge. Based on his analysis of the Three Rising Valleys, DoJi has set a price target of around $13 for RNDR. He even goes as far as suggesting a price explosion beyond $20 if historical price movements repeat themselves.
According to DoJi, surpassing a key resistance level of $9.20 could be the catalyst that ignites this bullish momentum.
In the previous half-year, RNDR’s value rose by an astounding 250%. The pattern of impulsive and corrective moves in the price fluctuation points to a turbulent market.
Forecasting the price trajectory of RNDR in the future offers both cautious and optimistic options. There is expected to be resistance at $10.90 and a larger barrier at $13.30.
If the price drops, $6.18 or even lower, $3.79, may provide support. RNDR network adoption rate and general market trends could drive price fluctuations, but long-term indications like the 100-day average point to a possible stabilization around $8.92.
Analyst Chimes In With Optimistic Predictions
Meanwhile, DoJi isn’t the only crypto expert bullish on RNDR. Inspector Crypto, another well-respected analyst, has identified a bullish Inverse Head and Shoulders Pattern on RNDR’s chart. This pattern typically precedes a price increase, and Inspector Crypto has projected a target range of $14-$16 for RNDR based on this pattern.
$RNDR | Inverse Head and Shoulders pattern target: $14-$16#RENDER #Solana #Bitcoin #AltCoinSeason2024 #Bullrun2024 #ADA #Xrp #AKT pic.twitter.com/VRO8gcTAiH
— Inspector Crypto
(@1nspector_G) April 26, 2024
The combined optimism from DoJi and Inspector Crypto reflects a broader sentiment of anticipation surrounding RNDR. While the token has experienced a slight dip in price recently, many analysts are closely monitoring its performance, waiting for the upswing signal.
Featured image from Pexels, chart from TradingView
The Bitcoin network has witnessed a surge in trading activity in the days after the halving, as shown by on-chain data. Although the just concluded halving brought a lot of attention to Bitcoin, the recent surge in trading activity can be attributed to something else.
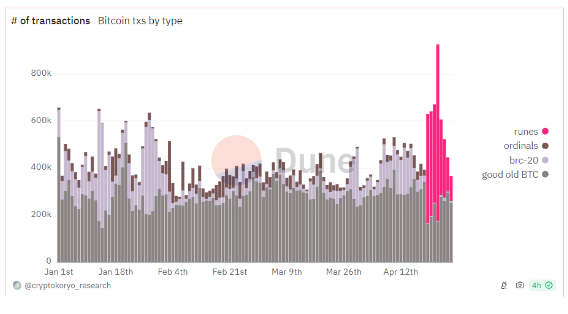
According to data from on-chain analytics platform IntoTheBlock, the number of daily BTC transactions has grown rapidly in the past few days to reach a new high of 927,000 thanks to a new token standard called Runes.
Bitcoin’s price has been skyrocketing since the beginning of the year with interest in the top cryptocurrency exploding. All that new interest means more people buying, selling, and trading BTC, which has led to a huge increase in the number of daily transactions.
Despite the increase in activity, the number of daily transactions failed to break above the 724,000 record for the past four months, until recently this week.
The main catalyst for this activity surge is the recent launch of the Runes token standard on the Bitcoin blockchain. The Runes Protocol is a new token standard on BTC that gives users a more efficient way of creating fungible tokens.
The additional functionality provided by Runes opens up new possibilities for Bitcoin, allowing users to create non-fungible tokens more efficiently than the existing BRC-20 token system.
The Runes token standard surged immediately among developers and users after launch, constituting over 68% of Bitcoin transactions recorded. According to Dune’s analytics dashboard, the number of Runes transactions surged to 753,000 on Tuesday, April 23. As a result, the total number of transactions on the day crossed over 927,000 to break the 724,000 record set in December 2023.
Bitcoin hit a new all-time high in daily transactions!
Following the launch of Runes, The number of Bitcoin transactions has increased rapidly, hitting 927,000 on Tuesday. This breaks the previous high of 724k set in December of 2023 pic.twitter.com/30JXbrLmdR
— IntoTheBlock (@intotheblock) April 26, 2024
On the other hand, the hype surrounding the Runes token standard seems to have faded so quickly. The number of transactions on Runes has now fallen to 104,800 in the past 24 hours, constituting 26% of the total number of transactions.
At the time of writing, Bitcoin is trading at $63,711 with a price resistance now around $64,500. Bitcoin’s price trajectory can be very tough to predict. Many Bitcoin analysts and traders are still looking forward to a bullish effect of the just concluded halving on the price of the cryptocurrency. A Bitcoin bull flag has just been formed which suggests the possibility of an uptrend very soon.
However, crypto expert Peter Brandt believes Bitcoin might have already reached its top in the current market cycle. His theory is based on the exponential decay thesis which shows that the percentage gain of Bitcoin price has reduced in succeeding market cycles.
Featured image from Pexels, chart from TradingView
Litecoin (LTC) defied the overall sluggishness of Proof-of-Work (PoW) coins this week, climbing 4% to a two-week high of $86 on April 26. This surge has rattled short sellers and ignited a potential short squeeze, with analysts predicting a bullish run towards the $100 mark.
While other cryptocurrencies have struggled to gain momentum this week, Litecoin bulls have managed to push slightly ahead. This unexpected rally has added a significant $190 million to Litecoin’s market capitalization, showcasing a renewed investor interest in the digital silver.
Market watchers attribute the surge to a confluence of factors. Firstly, a significant number of traders are betting big on Litecoin’s continued rise, evident in the overwhelming leverage applied in the derivatives market.
Data from Coinglass reveals a bullish sentiment, with the value of long leveraged positions exceeding shorts by a notable margin. This optimistic outlook places immense pressure on short sellers, who stand to incur heavy losses if the price keeps climbing.
The current price action suggests that a short squeeze might be brewing. Short sellers borrow LTC tokens, sell them at a higher price in anticipation of buying them back later at a lower price to pocket the difference.
However, if the price goes up instead of down, they are forced to buy back LTC at a loss to cover their positions. This buying activity to mitigate losses further pushes the price up, creating a snowball effect.
Analysts estimate that a mere 10% price increase, propelling LTC to $96, could trigger liquidations worth $16 million for short sellers. Conversely, bullish traders have amassed leveraged long positions exceeding $16 million around the current price point. This leverage disparity empowers the bulls to potentially drive the price towards the coveted $100 milestone in the coming days.
Volatility Ahead: A Word Of Caution
While the short-term outlook for Litecoin appears optimistic, experts advise caution. The current rally seems primarily driven by speculation and leveraged trading, not necessarily by fundamental advancements within the Litecoin ecosystem.
This dependence on market sentiment makes the price susceptible to swings. If the bullish momentum fizzles out, a price correction could trigger significant liquidations of overleveraged long positions, causing a reversal.
The coming days will be crucial in determining whether the bulls can maintain control and propel LTC to $100, or if the bears regroup and trigger a reversal of fortunes.
Featured image from Pexels, chart from TradingView
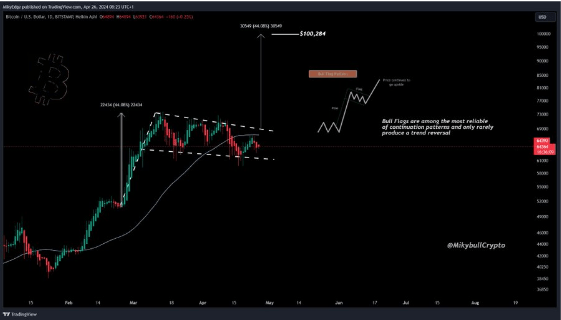
A bull flag recently formed on the Bitcoin chart, raising the possibility of a trend reversal soon enough as the flagship crypto makes significant moves to the upside. This crypto analyst suggests that the crypto could rise to as high as $100,000 when it makes that move.
Denis Baca, Head of Product at Zivoe Finance, noted that the bull flag formation on Bitcoin’s daily chart historically suggests that the crypto token is primed for more upsides. He added that the bullish pattern is “shaping up nicely” and that Bitcoin could potentially shoot up towards $100,000 once the declining volume picks up.
However, Baca further suggested that Bitcoin could drop below $60,000 before it makes such a parabolic move. He alluded to how the crypto token historically retests the support level of the 20-week SMA (small moving average) in May. This could cause Bitcoin to drop to $56,000, he claimed.
Baca opined that such price dips could be “healthy” for Bitcoin before it experiences a reversal. He elaborated that these dips “offer solid buying opportunities,” which could help spark Bitcoin’s move to record highs.
Crypto analyst Mikybull Crypto also shared his thoughts on what this bullish pattern could mean for Bitcoin. On his part, he suggested that the formation further proves the continuation of Bitcoin’s bull run and that a bearish reversal was unlikely.
#Bitcoin on a daily chart forming a bull continuation pattern.
According to Wyckoff’s law of cause and effect “the longer the consolidation, the more explosive the markup will be” pic.twitter.com/ArH0lNnyc2
— Mikybull
Crypto (@MikybullCrypto) April 26, 2024
He also hinted that the next leg up could be massive as he alluded to Wyckoff’s law of cause and effect, which states that “the longer the consolidation, the more explosive the markup will be.”
Andrey Stoychev, Head of prime brokerage at Nexo, remarked that any potential price rise for Bitcoin is unlikely to be realized without a catalyst. He noted that the flagship crypto token has managed to build resilient support at $64,000, but without any catalyst, it will merely continue to trade around the $67,000 range.
It is worth noting that the Spot Bitcoin ETFs, which previously served as a major catalyst to Bitcoin’s price surges, have recently suffered from declining demand. They have also experienced significant net outflows this month, leading to a wave of Bitcoin sell-offs from the fund issuers to fulfill redemptions.
Despite this, Stoychev is positive that Bitcoin won’t drop below $60,000. He predicts that the only thing that can cause Bitcoin to retrace to such a level is if high interest rates are maintained longer than expected, as this can affect sentiment toward crypto assets.
At the time of writing, Bitcoin is trading at around $62,900, down over 2% in the last 24 hours, according to data from CoinMarketCap.
Featured image from Pixabay, chart from TradingView

Bitcoin and altcoins could be en route to retest their recent strong support levels as bears try to extend the correction.
Stellar (XLM), a prominent player in the digital asset landscape, is experiencing a surge in optimism as analysts forecast a significant price increase in the near future. The cryptocurrency, currently priced at $0.1126, has demonstrated stability amidst market fluctuations, attracting investor interest and propelling a potential bullish trend.
This newfound optimism stems from a recent technical breakout. XLM successfully emerged from an Ascending Triangle pattern, a bullish indicator that often precedes price surges. This breakout was further bolstered by a retest of the breakout level, solidifying the potential for an upward trajectory.
Technical analysts are leveraging the measured move technique to predict XLM’s future price movement. This analysis suggests a target range spanning from 0.38 to 0.47 cents, aligning with Fibonacci levels 0.70 to 0.78. This range signifies substantial growth potential, enticing investors seeking profitable opportunities.
Beyond technical indicators, investor confidence is playing a significant role in Stellar’s projected rise. The recent 2.50% price increase over the last 24 hours underscores this growing momentum. This shift in market sentiment indicates a bullish trend, potentially leading to a notable price appreciation in the coming months.
Analyst Projects Stellar To Reach $0.47
Adding fuel to the fire, crypto analyst EGRAG CRYPTO recently shared a bullish forecast for XLM’s price trajectory. The analyst predicts a surge towards a promising target of $0.47, highlighting the potential for substantial growth. This bullish sentiment resonates with investors and enthusiasts, further bolstering confidence in Stellar’s future.
#XLM Rockets Towards 0.47c!
#XLM has successfully broken out of the Ascending Triangle and is currently retesting the breakout level. This sets the stage for a potential bullish move.
— EGRAG CRYPTO (@egragcrypto) April 23, 2024
The analysis digs deeper, identifying key Fibonacci retracement levels as crucial milestones for XLM. These levels not only serve as potential profit-taking targets for investors but also signify the strength of the upward momentum.
Interestingly, the analysis suggests that XLM has the potential to surpass traditional technical indicators. Should the cryptocurrency surpass the formidable Fib 1.618 level, it could embark on a remarkable ascent, exceeding expectations and venturing into uncharted territory.
Market Volatility Warns For Caution
While the outlook for Stellar appears promising, it’s crucial to remember the inherent volatility of the cryptocurrency market. Unforeseen events and market fluctuations can significantly impact prices.
Despite the inherent risks, the technical indicators and growing investor confidence paint a compelling picture for Stellar’s future. As the digital asset landscape continues to evolve, Stellar’s potential for significant growth is undeniable.
Featured image from Pexels, chart from TradingView
Bitcoin and altcoins continue to be rocked by macroeconomic and geopolitical uncertainty, but data shows bulls continue to buy each dip.
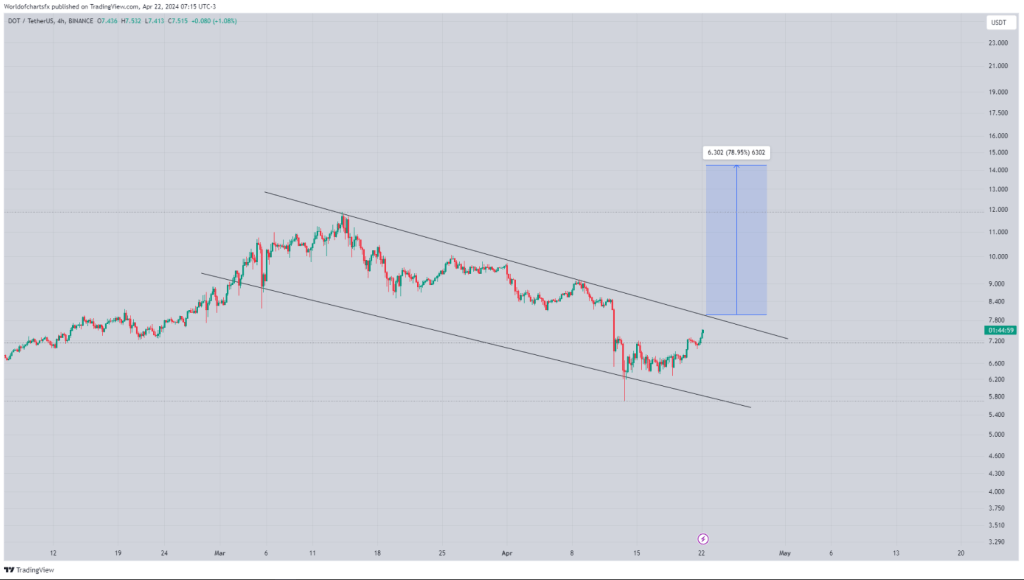
Polkadot (DOT), the interoperable blockchain platform designed for connecting different blockchains, is currently caught in a tug-of-war between technical indicators suggesting a potential price dip and bullish predictions from some analysts.
Recent price movements paint a somewhat gloomy picture. DOT breached the lower boundary of its ascending trend channel, a technical indicator often interpreted as a sign of weakening momentum.
Trading volume also leans bearish, with sellers dominating the market and putting downward pressure on the price. Support seems to be holding around $6.30, but resistance sits stubbornly at $9.40, hindering any upward movement.
However, not everyone is ready to count DOT out. Proponents point to a bullish flag pattern, suggesting a consolidation phase. This consolidation, they argue, is a healthy pause after recent fluctuations and allows for accumulation before the next significant price move.
This interpretation finds support from prominent crypto analysts like World of Charts. They believe the current price action is a bullish flag, a technical pattern often seen as a precursor to a breakout. Should this breakout occur, they predict a surge in value, with DOT potentially reaching $15 in the coming weeks.
$Dot#Dot Consolidating In Bullish Flag In H4 Timeframe Expecting Upside Breakout & Incase Of Successful Breakout Expecting Move Towards 15$ In Coming Weeks #Crypto pic.twitter.com/nZkfjMoeDL
— World Of Charts (@WorldOfCharts1) April 22, 2024
The conflicting technical signals make Polkadot’s future trajectory difficult to predict. The short-term outlook appears shaky, with potential for a price dip in the coming days or weeks.
However, the long-term picture remains more optimistic. Polkadot’s core technology offers a compelling solution for blockchain interoperability, a major hurdle in the crypto industry. If the project continues to develop and gain traction, a significant price increase in the future remains a possibility.
While the potential for a $15 price tag in the coming weeks is enticing, the current technical indicators suggest caution. Ultimately, the price of Polkadot, like all cryptocurrencies, remains highly volatile and susceptible to unforeseen events. The coming weeks will be crucial in determining whether the bulls or the bears will prevail in this ongoing battle.
Polkadot JAM Protocol: Integrating Ethereum Smart Contracts, Boosting DOT’s Potential
In another development, Polkadot has been at the forefront of blockchain innovation, drawing significant attention from industry stakeholders with recent developments and promising future prospects. A notable milestone is the unveiling of the Join-Accumulate Machine (JAM) Gray Paper, representing a fusion of Polkadot and Ethereum protocols.
This protocol, as explained by the team, aims to establish a global singleton permissionless object environment akin to Ethereum’s smart-contract ecosystem, while also integrating secure sideband computation parallelized across a scalable node network, a concept pioneered by Polkadot.
Moreover, the JAM protocol introduces a crucial service supporting existing parachains, allowing developers to continue utilizing Substrate for blockchain deployment.
This integration of Polkadot’s infrastructure with Ethereum’s smart contract capabilities and its commitment to DOT underscores a strategic alignment towards interoperability and scalability, potentially reshaping the landscape of decentralized applications and blockchain development.
Featured image from Pexels, chart from TradingView
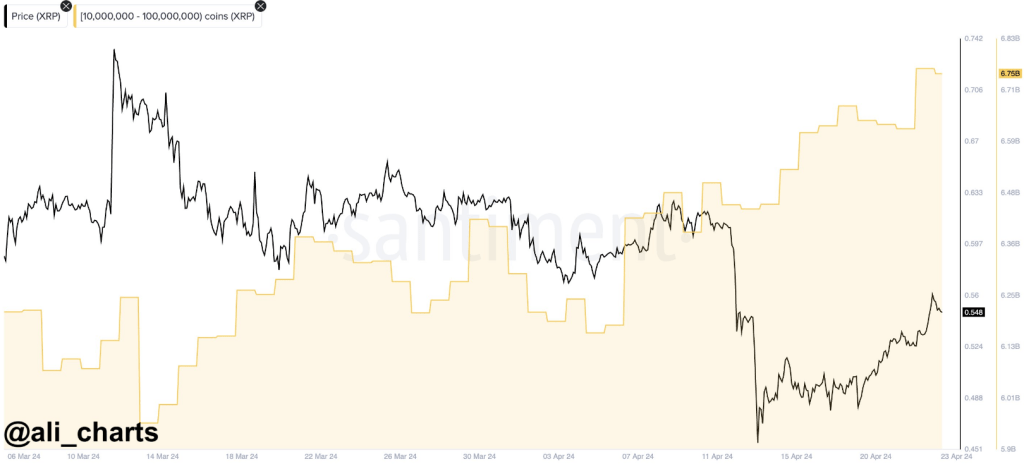
The cryptocurrency market continues to grapple with volatility, and XRP has been no exception. After a promising start to the year, the price of XRP has mirrored the broader market slump triggered by Bitcoin’s correction. However, amidst the bearish sentiment, a different story is unfolding underwater – one involving deep-pocketed investors, or “whales,” accumulating the altcoin at a significant clip.
While the price of XRP has dipped considerably from its highs in March, whale addresses have been quietly going on a buying spree. According to data from market intelligence platform Santiment, analyzed by market researcher Ali Martinez, addresses holding between 10 million and 100 million XRP have been steadily adding to their holdings since early April.
This buying frenzy intensified after XRP’s sharp price drop in mid-April, with whales capitalizing on the lower prices in a classic “buy-the-dip” strategy.
$XRP dropped from $0.62 to $0.41, and #crypto whales took notice. They’ve bought over 31 million #XRP in just the past week! pic.twitter.com/3FCA3PR3hi
— Ali (@ali_charts) April 23, 2024
The data reveals that these whales have scooped up a staggering 30 million XRP tokens in the past week alone, bringing their cumulative holdings to a hefty 6.75 billion units. This buying spree indicates a potential shift in sentiment among these large investors, who seem unfazed by the short-term price fluctuations and might be betting on XRP’s long-term prospects.
Taking a deeper dive, latest data suggests that this accumulation trend began even earlier, on April 5th. Interestingly, this coincides with the tail end of a selling period by these same whales, where they offloaded some of their holdings.
However, since April 5th, the buying spree has been relentless, with whales amassing over 600 million XRP in just two weeks. This significant accumulation suggests a renewed confidence in XRP, potentially signaling a bullish outlook from these key market players.
Further bolstering this notion is the recent surge in the number of addresses holding at least 1 million XRP. These “mid-tier whales” have been steadily increasing, with their ranks reaching a near-record high of 2,013 on Tuesday. This broader participation from various tiers of large investors adds weight to the idea that XRP might be undervalued at its current price point.
The price of #XRP has jumped ahead of the #altcoin pack, jumping +6% and as high as $0.5687 today. The amount of wallets, 2,013, holding at least 1M $XRP has been surging over the past six weeks (rising 3.1%), and is within 1 wallet of the #AllTimeHigh. https://t.co/2ZfC9v79x9 pic.twitter.com/rqKgcOYJJx
— Santiment (@santimentfeed) April 22, 2024
XRP Outperforms Other Altcoins
Meanwhile, Santiment disclosed that XRP is outpacing the other altcoins in terms of wallet size. Wallets holding 1 million or more coins have increased, with a 3% gain over the last six weeks. The increase of significant XRP holdings indicates that investors’ interest and confidence are rising.
While whale activity can be a significant indicator of sentiment, it shouldn’t be the sole factor driving investment decisions. However, the recent buying spree by XRP whales is a noteworthy development, suggesting a potential shift in sentiment and a possible turning point for the coin’s price.
Featured image from Pixabay, chart from TradingView
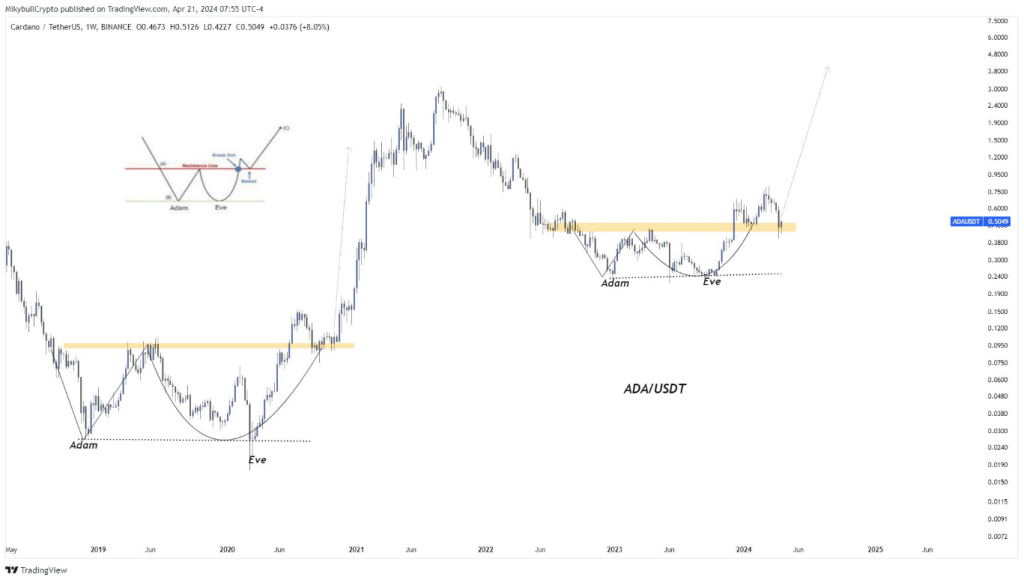
Cardano (ADA), the tenth largest cryptocurrency by market capitalization, has been a rollercoaster ride for investors in recent months. After a steep price decline in March, ADA has seen a minor uptick, leaving analysts divided on its future trajectory. Could a repeat of a historical price pattern propel ADA to new heights in 2024, or are there warning signs lurking beneath the surface?
Hopeful investors are clinging to a familiar chart pattern. According to popular crypto analyst Milkybull, ADA’s price movement appears to be mirroring its action in 2020. Back then, an “Adam and Eve” double bottom pattern preceded a significant price surge. If history rhymes, a breakout from this pattern could see ADA revisit its all-time high this year.
It’s following the same path of 2020 that initiated an explosive rally. pic.twitter.com/rI5FDzcn4P
— Mikybull
However, historical comparisons are a double-edged sword. While past trends can offer some insight, blindly relying on them can be misleading, especially in the ever-evolving cryptocurrency market.
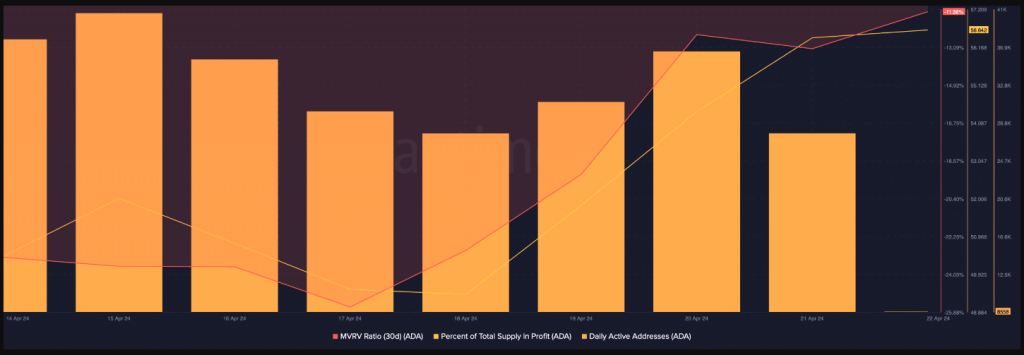
Technical indicators often used to gauge market sentiment seem to be painting a bullish picture for Cardano. The Relative Strength Index (RSI) and Chaikin Money Flow (CMF) are both trending upwards, suggesting a potential price increase.
Meanwhile, a crucial metric paints a contrasting picture. Cardano’s daily active addresses, which reflect the number of unique users interacting with the network, have dipped slightly in the past few days. This decline in network activity could be a cause for concern, as it might indicate dwindling user interest in the Cardano ecosystem.
Cardano’s Future: A Balancing Act
The outlook for Cardano remains uncertain. While the potential for a bull run based on historical patterns and bullish technical indicators exists, the decline in network activity raises questions about its long-term sustainability. Investors should carefully consider these conflicting signals before making any investment decisions.
Further developments within the Cardano ecosystem, such as the successful rollout of smart contracts or increased adoption of decentralized applications (dApps) built on the Cardano blockchain, could significantly impact its price.
Additionally, the overall performance of the broader cryptocurrency market will also play a role in determining ADA’s future trajectory.
Featured image from Pexels, chart from TradingView
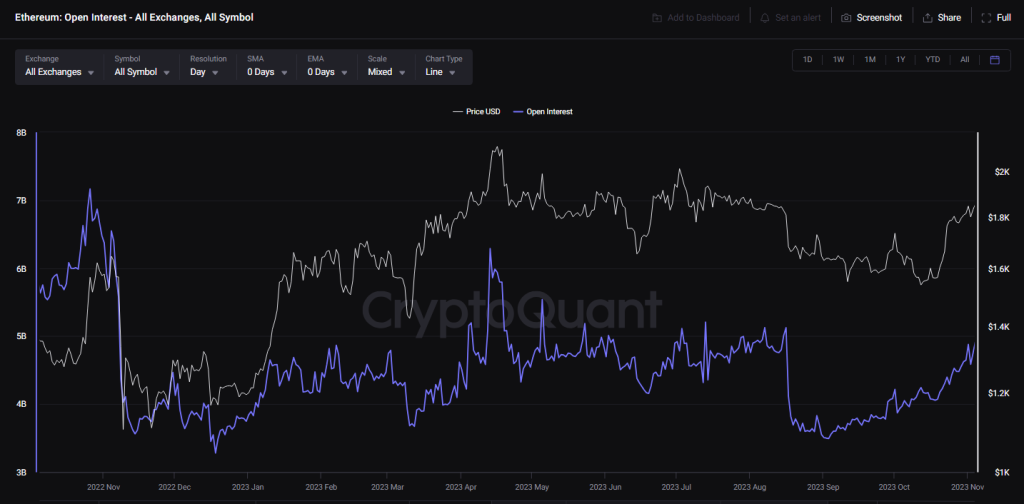
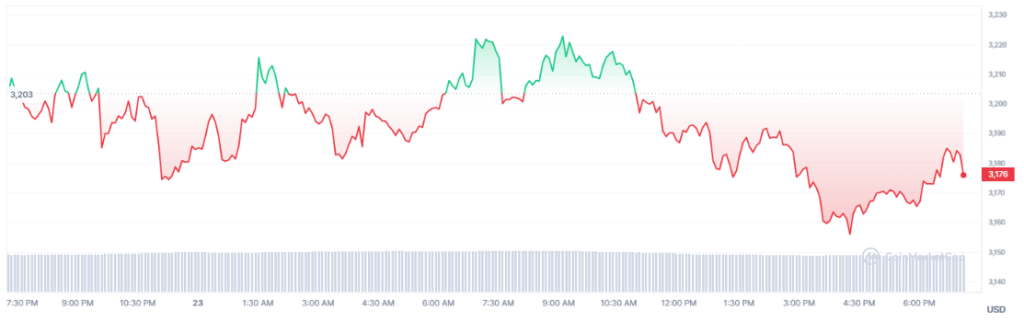
Ethereum (ETH) stands as a bellwether for the industry’s ebbs and flows. As of press time, Ethereum was trading at $3,174, its price trying to reach the crucial $3,000 mark. However, beneath the surface of these seemingly stable waters lies a complex interplay of market forces and investor sentiment.
Since last week, the lower timeframes have seen repeated breaches of the $3,000 psychological threshold, and the enthusiasm surrounding the altcoin king has significantly waned.
This downward pressure is further underscored by the notable drop in Open Interest (OI) behind ETH futures contracts, which plummeted from $10 billion to $7 billion in April alone.
Such a decline suggests a recalibration in the futures market, potentially signaling a cooling-off period for speculative trading activity.
However, amidst the uncertainty, there exists a glimmer of hope for ETH bulls. Historical precedents, such as the mid-February 2021 correction, offer insight into the resilience of Ethereum’s price.
Following a similar dip from an all-time high of $1,900 to $1,400, Ethereum experienced a V-shaped reversal, demonstrating the market’s propensity for swift recoveries. This historical context serves as a guiding light for investors navigating the choppy waters of cryptocurrency volatility.
On the social sentiment front, Ethereum’s trajectory has been a tale of two halves. While sentiment was strongly positive in February and briefly in mid-March, a negative sentiment has dominated as prices entered a correction phase. Factors such as high gas fees on the Ethereum network have likely contributed to this shift, highlighting the impact of practical considerations on market sentiment.
Ethereum: Fundamental Metrics
Examining Ethereum’s fundamental metrics provides further insights into its current state. Network growth has slowed in recent months, signaling a potential decline in demand. However, a closer look reveals a silver lining: the 90-day mean coin age has trended steadily higher since late March, indicating a network-wide accumulation of ETH.
As Ethereum continues to navigate these turbulent waters, all eyes are on key resistance levels. Breaking above the $3,300 barrier could instill confidence among traders and investors, potentially heralding a new wave of bullish momentum. However, uncertainties loom large, particularly in light of the broader market dynamics and the selling pressure on Bitcoin, Ethereum’s perennial counterpart.
While challenges abound and uncertainties persist, Ethereum’s historical performance and fundamental strengths offer hope for a brighter future. As investors brace for potential headwinds and opportunities alike, Ethereum stands poised to weather the storm and emerge stronger on the other side.
Featured image from Pexels, chart from TradingView
Celestia (TIA), a red-hot cryptocurrency in the modular blockchain space, has experienced a rollercoaster ride in recent weeks. After reaching a peak of nearly $16, TIA underwent a correction, plummeting to $7.5 according to CoinMarketCap data.
However, the token has displayed remarkable resilience, bouncing back to $11.50 and showcasing strong trading volume – a sign that investors haven’t abandoned ship.
The past 24 hours have been particularly kind to Celestia. The token price surged by a significant 6.20%, indicating a shift in investor sentiment towards optimism. This bullish momentum is further bolstered by analyst predictions and market psychology.
TIA’s price action reveals a struggle between bullish and bearish forces. While the Fear & Greed Index sits at 72 (“Greed”) and price predictions lean bullish, the current price of $11.70 remains significantly lower than its February 10th, 2024 ATH of $20.85.
This signals a potential continuation of the downtrend. However, a key technical detail to note is the price staying above the cycle low of $7.61. This could indicate the beginning of a price recovery, but further technical analysis is necessary to confirm this.
Some 46 cryptocurrency exchanges, including Binance and KuCoin, allow traders to trade Celestia. Celestia changed hands for $549.60 million in the previous day.
Crypto analyst CryptoBullet has offered a long-term perspective on Celestia’s trajectory, focusing on its one-week chart. The analyst predicts a consolidation phase where TIA will likely trade below its previous high of $20 for an extended period.
I think #TIA will consolidate below the $20 high for quite a while (maybe it will print a giant Symmetric Triangle, who knows)
In my opinion, only after this re-accumulation $TIA will be ready to go much higher
Macro target 1 – $70
— CryptoBullet (@CryptoBullet1) April 18, 2024
This consolidation could potentially form a bullish “Symmetric Triangle” pattern, a technical indicator often seen before significant price breakouts. CryptoBullet believes that after this consolidation and re-accumulation period,
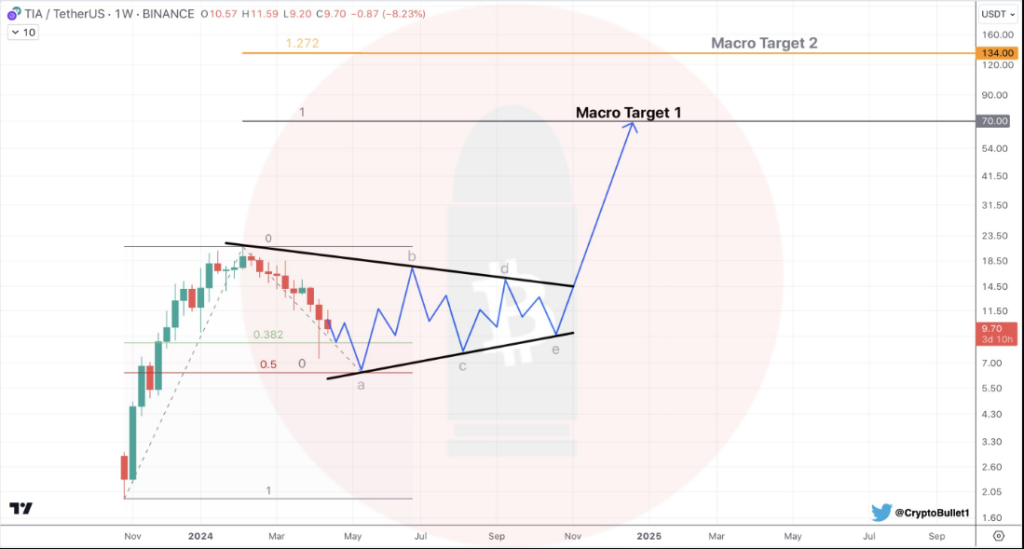
TIA will experience a substantial rise, with ambitious macro price targets set at a staggering $70 and even $130. While these targets are lofty, they highlight the analyst’s belief in Celestia’s long-term potential.
Celestia’s Underlying Value Proposition
The recent bullish sentiment surrounding Celestia isn’t solely driven by speculation. Celestia is a modular data availability network, a foundational technology that underpins the scalability and security of blockchains.
By offering a secure platform for developers to launch their own blockchains, Celestia positions itself as a crucial piece of infrastructure in the burgeoning blockchain ecosystem. This underlying value proposition, coupled with the recent positive market forces, is propelling Celestia into the spotlight.
Will TIA Reach $130?
While predicting specific price points like $130 is inherently difficult in the volatile cryptocurrency market, Celestia’s future trajectory remains intriguing. Bullish sentiment and a Greed market mood suggest potential for price appreciation.
However, the significant drop from its all-time high and the unknown influence of future news and developments necessitate caution. Technical analysis using indicators and monitoring upcoming events can provide more clarity on Celestia’s price direction.
Featured image from Pexels, chart from TradingView
Investors are accumulating Ethereum in droves amidst what could become a return to bullish sentiment for the cryptocurrency. Ethereum is currently ranging around $3,170, with its price undergoing volatility in the past seven days.
Amidst this price volatility, on-chain data has revealed an accumulation trend from Ether investors during the week. Additionally, transaction data has shown an uptick in whale movement of ETH to and from exchanges, with recent market happenings indicating a transformation in the price of the crypto asset.
Ethereum is now at a fundamental junction which could see its price surging in the new week and beyond. This fundamental catalyst for a price surge has come through the recent entry of Spot Ether ETFs into the Asian market.
Regulators in Hong Kong have greenlit the launch of Spot Ethereum ETFs along with Spot Bitcoin ETFs in the country, prompting investors to make strategic ETH movements in light of an incoming price surge.
Particularly, on-chain data from IntoTheBlock shows a strategic accumulation pattern from ETH investors, with over $500 million worth of ETH leaving centralized exchanges in the past week. Interestingly, this surge in movement is the highest single-week outflow from exchanges recorded on the Ethereum network since February.
Half a billion $ETH was withdrawn from CEXs this week, the highest since February pic.twitter.com/rwvftXjiOz
— IntoTheBlock (@intotheblock) April 19, 2024
When investors withdraw crypto from exchanges, it usually means they’re looking to hold it for the long term. This behavior shows that these investors have confidence that the price of ETH will increase in value in the near future.
Similarly, data from whale transaction tracker Whale Alerts shows an uptick in ETH whale transactions during the week, with whale outflows from exchanges outpacing inflows.
— Whale Alert (@whale_alert) April 20, 2024
Despite the outflows from exchanges, a concurrent selloff in exchanges drove the price down below $3,000 during the week to bottom out at $2,878. However, the currency has since reversed to the upside and is showing signs of a bullish momentum. At the time of writing, Ethereum is trading at $3,180 and is up by 4% in the past 24 hours.
Fundamentals surrounding Ethereum point to steady price growth during the weeks as the bulls look to clear the $3,200 price hurdle. One example of such catalysts is a new draft bill aimed at legitimizing stablecoins in the United States. As the blockchain network with the biggest stablecoin market, Ethereum is set to benefit from a clear-cut positive regulation regarding stablecoins.
While the US SEC continues to hesitate about the approval of Spot Ethereum ETFs in the country, this investment class is set to be launched at the end of April in Hong Kong. Ethereum ETFs hitting the Asian market signals growing institutional interest in the altcoin in all corners of the globe. This, in turn, could lead to the price of Ethereum surging past its current yearly high of $4,066.
Featured image from Pexels, chart from TradingView


