Smart contracts platform Avalanche (AVAX) is generating excitement in the crypto community with a potential breakout signal. Prominent analyst World of Chart has identified a bullish technical pattern that could propel AVAX prices significantly higher in the coming days.
Falling Wedge Pattern Hints At Upside
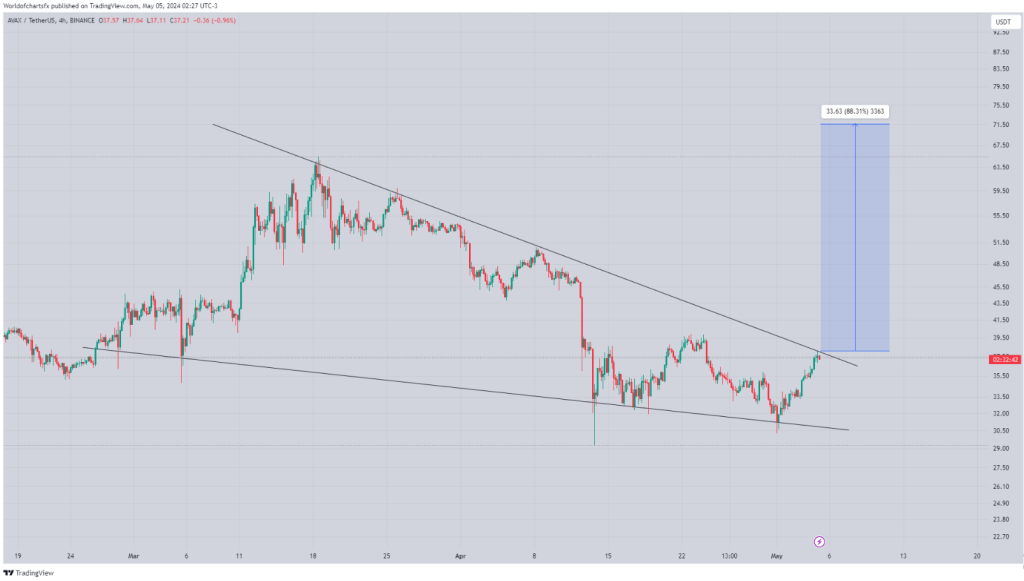
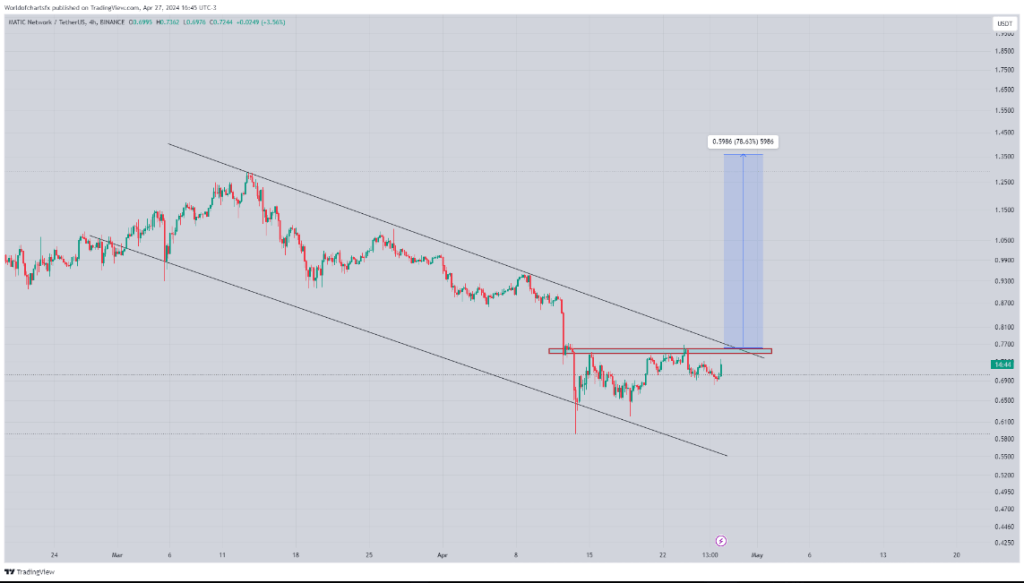
World of Chart points to the presence of a “falling wedge” pattern on AVAX’s price chart. This pattern typically forms during a consolidation phase, with price action confined between two converging trendlines that slope downwards.
Forming Falling Wedge Incase Of Breakout Expecting Upside Continuation Successful Breakout Can Lead Massive Rally In Coming Days#Crypto #Avax pic.twitter.com/YJHJYarrSw
— World Of Charts (@WorldOfCharts1) May 5, 2024
The key aspect of this pattern lies in the diminishing price range within the wedge, suggesting a buildup of buying pressure. A breakout from the upper trendline is often interpreted as a bullish signal, indicating a potential reversal of the downtrend and the start of a price surge.
Avalanche Poised For Takeoff?
AVAX might see a significant upswing if it is able to break above the upper trendline of the falling wedge, according to World of Chart.
Following the breakout, there may be a substantial price increase as a result of this ascent, which would confirm the bullish formation. The expert draws attention to the possibility of significant momentum and an explosive upward advance.
The possibility of an AVAX breakout has ignited discussions and speculation among crypto investors and traders, particularly those who actively follow technical analysis.
Investor Caution Advised Despite Bullish Outlook
While the potential for a bullish breakout is high, World of Chart emphasizes the inherent volatility and uncertainty of the cryptocurrency market. External factors beyond technical analysis can significantly impact price movements.
Technical Indicators Paint A Positive Picture
Beyond the falling wedge pattern, other technical indicators seem to be adding weight to the bullish narrative for AVAX. The recent price increase of over 16% in a single week suggests a potential shift in investor sentiment.
Additionally, the impressive surge in trading volume signifies heightened market activity and growing investor interest in AVAX.
Eyes On The Prize: Will Avalanche Deliver?
The coming days will be crucial, with all eyes glued to the price action and any signs of a breakout. A successful breakout could lead to significant gains for AVAX holders, while a failed breakout could dampen investor enthusiasm.
Featured image from Pexels, chart from TradingView


 SHIBARMY JPN
 (@kuro_9696_9696)
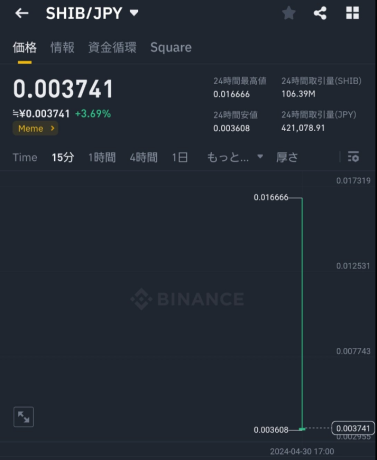


 (@SatsDoji)
 (@1nspector_G)
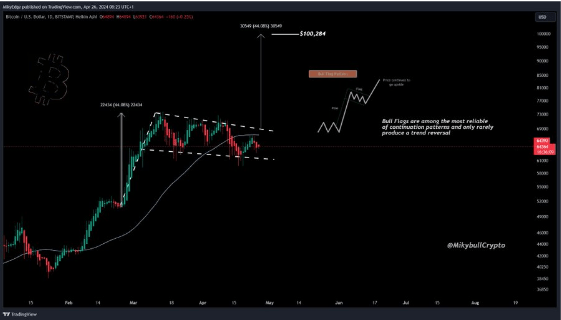
 Crypto (@MikybullCrypto)