
Veteran trader Peter Brandt sparked debate after suggesting BTC may have already hit its peak this cycle, but even he didn’t put much stock in the theory.
Cryptocurrency Financial News
Veteran trader Peter Brandt sparked debate after suggesting BTC may have already hit its peak this cycle, but even he didn’t put much stock in the theory.
The cryptocurrency world is abuzz with speculation after a deep learning model projected a dramatic price increase for Bitcoin (BTC) within the next month. However, despite the AI’s bullish outlook, financial experts urge investors to approach the prediction with a healthy dose of skepticism.
For the past week, Bitcoin has been stuck in a holding pattern, hovering stubbornly around the $64,000 mark. This lack of volatility has left many investors scratching their heads, unsure of the market’s next move. But a deep learning model developed by CryptoQuant, a leading blockchain analytics platform, has thrown a curveball into the mix.
The model, trained on a massive dataset of historical price movements and on-chain activity, predicts a significant price surge for Bitcoin in the coming weeks. According to the analysis, Bitcoin could break past the $77,000 barrier within the next 30 days, marking a new all-time high (ATH).
While the AI’s prediction is certainly eye-catching, some analysts are taking a wait-and-see approach. They point to several bullish metrics that seem to align with the model’s forecast. The network-to-value (NVT) ratio, a metric used to gauge an asset’s relative valuation, has dipped significantly, suggesting Bitcoin might be undervalued.
Additionally, exchange reserves have been dropping, indicating a decrease in selling pressure. These factors, coupled with the model’s prediction, paint a potentially optimistic picture for Bitcoin’s immediate future.
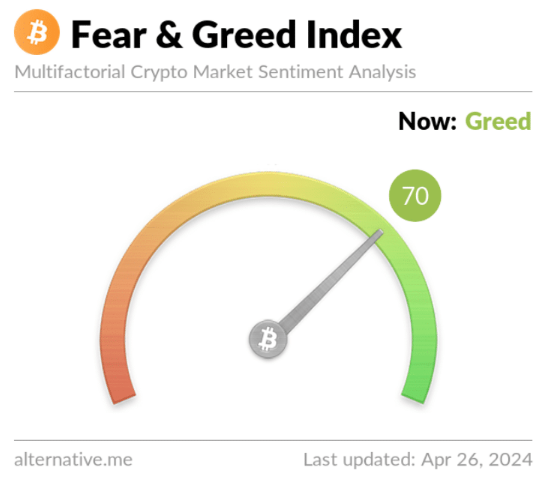
However, a lurking shadow of uncertainty remains. The Fear and Greed Index, a measure of investor sentiment in the cryptocurrency market, currently sits firmly in “greed” territory. Historically, periods of extreme greed have often been followed by market corrections.
This raises concerns that the current price stagnation might not be a prelude to a surge, but rather a sign of an overheated market ripe for a pullback.
Stalemate Before Potential Breakout?
Technical analysis of Bitcoin’s daily chart reveals further complexities. The price has repeatedly failed to breach its 20-day Simple Moving Average (SMA), a key indicator of short-term momentum.
Both the Chaikin Money Flow (CMF) and Relative Strength Index (RSI) are hovering sideways, suggesting a lack of clear direction in the market. These indicators imply that investors might be in for a few more days of sluggish price movement before a potential breakout, either upwards or downwards, occurs.
A Calculated Gamble
The deep learning model’s prediction offers a glimmer of hope for Bitcoin bulls, but it’s crucial to remember that AI forecasts are not infallible. The confluence of bullish metrics certainly adds weight to the model’s argument, but the ever-present risk of a market correction fueled by greed cannot be ignored.
Featured image from Pixabay, chart from TradingView
AVAX, the native token of the Avalanche protocol, presented a mixed experience for investors in the month of March. The altcoin initially rose by over 64% to trade above $65 for the first time since May 2022 before declining by 18.44% in the last two weeks.
Unsurprisingly, AVAX’s price movement has drawn much attention from investors and market experts alike. Notably, a popular crypto analyst with the X handle Rekt Capital has advised against panic, stating the recent decline of the altcoin could prove to be rather beneficial for investors.
In a post on X on March 30, Rekt Capital shared that AVAX has suffered an overall decline since encountering the $65-$70 price zone in mid-March. However, the analyst has described this price drop as a “healthy dip,” which could result in the token returning to previously high levels.
Avalanche rallied to the $65-$70 area
And is now dipping towards the December 2023 highs (red)
This is a healthy dip to set AVAX up for the next uptrend back to the $65-$70 area again, over time#AVAX #Crypto #Avalanche https://t.co/o7s9sU4eIN pic.twitter.com/5QJG2e581Y
— Rekt Capital (@rektcapital) March 30, 2024
Currently, AVAX trades in the range of $52-$54, but Rekt Capital predicts the altcoin is heading to the region of $44-$49, which represents its highest price points recorded in December 2023. On entering this price zone, Rekt Capital expects the token to find support and embark on an uptrend back to the $65-$70 region.
However, in the presence of overwhelming bearish pressure, the analyst technical analysis revealed that AVAX could drop further to around $32.66, indicating a potential price decline of 39.62% and 49.9% from the coin’s current price and its peak price in March, respectively
At the time of writing, AVAX trades around $53.50 with no significant price movement in the last day, while recording a 0.51% decline over the past week based on data from CoinMarketCap. Meanwhile, the crypto asset’s trading volume is down by 16.62% and valued at $370.86 million.
However, AVAX has generally been one of best best-performing assets in the last six months boasting a market gain of 471.35% within this period. Notably, in December 2023, the altcoin rose by about 150% to move from $20.41 to a monthly high of $49.98.
Off the market, AVAX has also scored some positive strides. Most recently, the Avalanche network announced a collaboration with fellow blockchain Chainlink and the prestigious Australia and New Zealand Banking Group (ANZ) targeted at exploring the use of crypto assets in global financial settlement systems. The use of AVAX in such a project would largely amplify the token’s adoption, which would elicit a positive effect on its market price.
AVAX trading at $53.30 on the daily chart | Source: AVAXUSDT chart on Tradingview.com
Featured image from Zipmex, chart from Tradingview
XRP, the native token of Ripple, is stirring up excitement in the crypto market with analysts predicting a potential short-term price explosion. However, the extent and timing of this surge remain a point of contention.
In a recent analysis of the cryptocurrency market, several market analysts have expressed optimism about the short-term prospects of XRP, the digital asset associated with Ripple. These analysts believe that XRP could experience a substantial increase in price, potentially reaching new heights before the peak of the current market cycle.
Capt Toblerone, a prominent crypto analyst, recently ignited the discussion with a bold claim: XRP could see a staggering 15-fold increase (1500%) before the current bull market reaches its peak. This translates to a price target of roughly $10 by July 2024, a significant leap from its current price hovering around $0.62.
$XRP chart update. 3 day MACD turning bullish at the right time.
pic.twitter.com/VgJAjO0Bru
— CAPT. PARA8OLIC TOBLERONE (@CaptToblerone) February 16, 2024
Toblerone isn’t alone in his optimistic outlook. Analyst Jake Gagain believes a $5 price point for XRP is achievable in the near future, while crypto founder Nick envisions a more ambitious target of $10 by the cycle’s end. This bullish sentiment echoes the broader market expectation of a potential $5-$10 range for the altcoin.
The underlying rationale for this bullishness hinges on XRP’s historical performance. Back in late 2017, XRP witnessed a meteoric rise, culminating in its all-time high of $3.84. Analysts like Toblerone see parallels between the current market conditions and 2017, hoping for a similar price explosion.
Bullish 2025 Crypto Price Predictions. $BTC $ETH $SOL $XRP $ADA pic.twitter.com/xGQKZYRrpm
— JAKE (@JakeGagain) March 21, 2024
However, a closer look reveals cracks in the bullish narrative. Toblerone’s previous prediction for Q2 2024 placed XRP within a range of $2.5-$11. With just ten days left in the quarter, achieving even the lower end of that prediction seems highly unlikely.
Furthermore, the article lacks any mention of concrete factors driving the anticipated surge. While past performance offers a glimpse into possibilities, it’s not a guarantee of future results. The cryptocurrency market thrives on innovation and adoption, and without evidence of significant developments for Ripple or XRP, the predicted price surge might be wishful thinking.
Not all analysts share Toblerone’s enthusiasm. Some, like Dark Defender and EGRAG, propose a more conservative range of $5-$17 for XRP in the coming weeks. This more measured approach acknowledges the inherent volatility of the crypto market and avoids relying solely on historical parallels.
The divided opinions highlight the importance of caution for investors considering XRP. While a price increase is certainly possible, the predicted 15x surge might be overly ambitious.
Featured image from Pexels, chart from TradingView
Digital asset analyst with X handle Crypto Patel has recently shared a bullish prediction on MATIC price movement in the coming weeks. This forecast comes amidst MATIC’s poor performance in the last seven days, during which it lost 6.68% of its market value, based on data from CoinMarketCap.
The Polygon native token had been one of the best-performing assets in 2024 rising by over 76.38% between January to March. However, the altcoin has now recorded a 22.83% decline over the last two weeks, drawing much concern over its future price movement.
In a post on X on March 23, Crypto Patel presented a bullish case for MATIC despite the token’s current downtrend, naming the forecast the “MATIC BULL RUN ROADMAP.”
Firstly, the analyst stated that a MATIC bullish pennant was being formed. For context, the bullish pennant represents a price pattern that typically follows a string of upward movement in price (the flagpole) followed by a period of consolidation (pennant).
$MATIC BULL RUN ROADMAP
1⃣ #MATIC Forming Bullish Pennant In HTF
2⃣ 2021 Bull Run: Did 100x in Last bull Market After Bull Flag Breakout
3⃣ If MATIC/USDT Break $1.20 Level in HTF then Ready for $10-$15 Target
4⃣ I am Bullish in #POLYGON for Long Run
5⃣ If Market Crash then… pic.twitter.com/FJEvGiHd4U— Crypto Patel (@CryptoPatel) March 23, 2024
A bullish pennant is characterized by converging trendlines, which indicates the continuation of the previous uptrend once the price breaks out of consolidation. Importantly, Crypto Patel emphasized that MATIC’s bullish pennant was being formed on a higher time frame (HTF), such as the weekly chart.
Following historical trends, the complete formation of the bullish pennant could result in Polygon native asset experiencing a 100x price increase in the highly anticipated crypto bull run, as observed in 2021.
However, with a focus on short-term targets, Crypto Patel has stated that MATIC reaching the $1.20 price zone on the HTF could trigger a surge to a range of $10-$15, representing a potential 1500% gain on the asset’s current price. Albeit, in the advent of an unexpected crash, the crypto analyst expects MATIC could be significantly affected but should find support around the $0.60-$0.70 price zone.
At the time of writing, MATIC trades around $0.9817 with a 1.30% gain in the last 24 hours. Meanwhile, the token’s daily trading volume has declined by 31.82% and is valued at $291.65 million. With a market cap value of $9.7 billion, MATIC is ranked the 16th largest cryptocurrency and one of the world’s most prominent digital assets.
MATIC trading at $0.9771 on the daily chart | Source: MATICUSDT chart on Tradingview.com
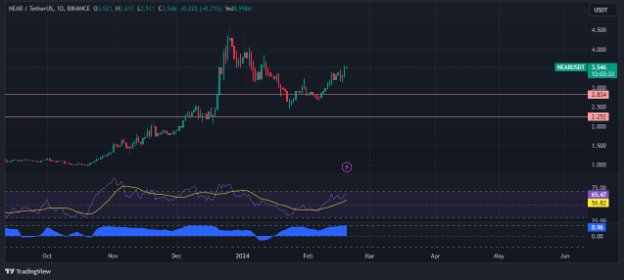
NEAR, the native token of the Layer 1 (L1) public blockchain NEAR Protocol, has substantially risen during this bull run after registering remarkable gains since the end of 2023.
As the price of Bitcoin continues to soar, NEAR has recorded an over 130% price surge in the past month, and analysts forecast that the bullish momentum isn’t over yet.
At the end of 2023, the NEAR token showed a remarkable performance by doubling its price in mid-December. Since then, the crypto market has been propelled to heights like those seen during the last bull run.
NEAR continued its growth alongside the market, and crypto analyst Altcoin Sherpa considers that the gains for the token are far from over.
$NEAR: Consolidation for the next leg up soon IMO. #NEAR pic.twitter.com/pII6Uanwaz
— Altcoin Sherpa (@AltcoinSherpa) March 12, 2024
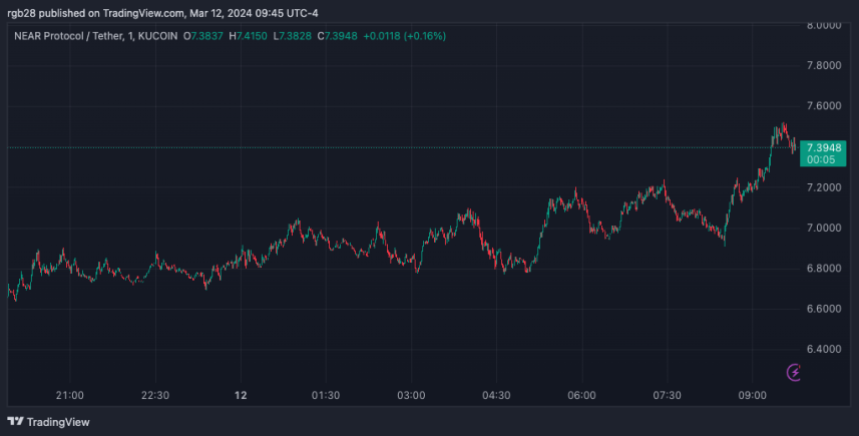
In an X (former Twitter) post, the analyst shared a chart showing NEAR’s performance in the last few days. This performance displays the token has oscillated between two levels since yesterday.
NEAR hovered between the $6.7- $7.17 price range for the past 24 hours, Altcoin Sherpa’s chart shows. As the analyst highlights, this is the “consolidation for the next leg up” coming soon.
Previously, Sherpa warned about the $6.9 price level being a “danger area approaching.” However, the token broke that resistance level over the weekend.
Moreover, crypto trader and analyst Rekt Capital shared a chart showing that NEAR revisited its multi-year macro downtrend. Breaking above it would further fuel the bullish momentum that could drive the price to revisit its all-time high (ATH) resistance area of $20.
Finally – Near Protocol has revisited its multi-year Macro Downtrend
Now #NEAR will try to break this to further build on its current bullish momentum
Breaking this Macro Downtrend would likely see price revisit the old All Time High resistance area
#BTC #NEARprotocol… https://t.co/VmcLjkWFPn pic.twitter.com/wboVljOJsc
— Rekt Capital (@rektcapital) March 11, 2024
NEAR has been closely following Bitcoin’s price performance during the past week. As the chart below shows, in the last 24 hours, the token’s price has closely followed the trajectory of the flagship cryptocurrency.
At writing time, NEAR is trading at $7.3, a 4.2% surge in the past hour. The token registered a stellar 67.8% and 83.1% price surge in the weekly and bi-weekly timeframe.
Crypto trader Doctor Profit foresees NEAR to reach $10 soon, as his previous prediction of the token reaching this price by the end of the year seems closer than expected.
That the token’s price of $3 was easily doubled in a matter of days. This suggests to the analyst that NEAR’s next goal of $10 will come very soon.
As optimistic predictions continue, the token’s market cap of $7.74 billion shows a 7.7% growth in the last day. By this metric, NEAR is inside the top 20 largest cryptocurrencies, currently being the 19th, according to CoinMarketCap data.
However, the daily trading volume has dropped 20% in the last 24 hours, with $993.5 million traded. This hints at a recent decline in market activity despite the positive performance and community support.
XRP, the native token of the Ripple network, has been a cryptocurrency on a rollercoaster ride. After a year marked by significant price swings and a high-profile lawsuit, XRP finds itself at a crossroads. Could a technical indicator signal a long-awaited rise, or are recent dips a sign of profit-taking before a potential fall?
Technical analysts are keeping a watchful eye on XRP’s price movement. The cryptocurrency appears to be on the verge of breaking out of a multi-year symmetrical triangle formation. This pattern, characterized by converging price channels, often precedes a significant price increase. If XRP can decisively surpass the resistance level of $0.6201, it could trigger a bullish run for the token.
$Xrp#Xrp Still Trying To Clear Multi Year Symmetrical Triangle Expecting Successful Breakout Soon After Successful Breakout Expecting Massive Bullish Wave In Coming Months#Crypto https://t.co/KIWel0U5Z5 pic.twitter.com/fRKM5WbZk9
— World Of Charts (@WorldOfCharts1) March 6, 2024
However, recent market volatility has proven to be a formidable obstacle. Despite a brief surge above the resistance level, XRP failed to maintain momentum. This highlights the ongoing uncertainty surrounding the cryptocurrency market, where external factors can quickly disrupt even the most promising technical signals.
At the time of writing, XRP was painted in red, and trading at $0.62, down 0.7%, 0.1%, and 1.1% in the hourly, daily and weekly timeframes, data from Coingecko shows.
While the potential breakout offers a glimmer of hope for XRP holders, a different story is unfolding in the short term. The token’s price has dipped slightly in recent days. Analysts attribute this decline to two key factors.
Firstly, the month of March has seen a significant exodus of XRP from investor wallets. Holders have reportedly cashed in on profits totaling $370 million. This profit-taking spree, particularly by those who accumulated XRP during its lows, is a natural market response and can contribute to price fluctuations.
Secondly, the looming deadline in the ongoing SEC vs. Ripple lawsuit casts a shadow over XRP’s price. The March 22nd deadline for the SEC to file its remedies-related brief injects uncertainty into the market. Investors often adopt a cautious approach during legal battles, leading to potential price drops.
A Balancing Act Between Technicals And Market Realities
The current situation for XRP presents a classic case of conflicting forces. On the one hand, the technical indicator suggests a potential breakout, hinting at a future price surge. On the other hand, profit-taking behavior and pre-lawsuit jitters are putting downward pressure on the token’s price in the short term.
The coming weeks will be crucial for XRP. The outcome of the SEC lawsuit and the token’s ability to break through the resistance level will determine its price trajectory. Whether XRP embarks on a bullish run or retreats further depends on how these factors play out.
Featured image from Pexels, chart from TradingView
Chainlink (LINK) continues to remain among the headlines following a negative performance, which saw the token’s price decline by 7.63% in the last week based on data from CoinMarketCap. However, despite this discouraging price loss, investors and market experts appear to remain bullish on the altcoin. For instance, popular crypto analyst Michaël van de Poppe has recently released a price prediction that states LINK could double its market price in the coming months.
In a Friday post on X, Michaël van de Poppe presented a bullish case for Chainlink using the LINK/BTC 3-day chart. The analyst began his prediction by noting LINK’s positive stint in the first two weeks of February, during which the token rose by 32.77% to trade above the $20 price mark.
#Chainlink had another leg upwards in their $BTC pair towards the crucial resistance.
Failed to break out.
It’s looking for a higher low & support and then a reversal towards 4500 sats again.
I think $LINK is likely to run to $30-40 in the coming months. pic.twitter.com/HtwHogdvsJ
— Michaël van de Poppe (@CryptoMichNL) February 23, 2024
However, despite this impressive price gain, the prominent altcoin failed to breach a crucial resistance zone at 0.00480 BTC, thus failing to initiate a breakout. Following this event, van de Poppe believes that Chainlink is now seeking a higher low to serve as its support level. For context, a higher low In technical analysis refers to a pattern on a price chart in which a successive low point in a trend is higher than the previous low point. It is usually interpreted as a bullish signal indicating a potential trend reversal or continuation of an upward trend.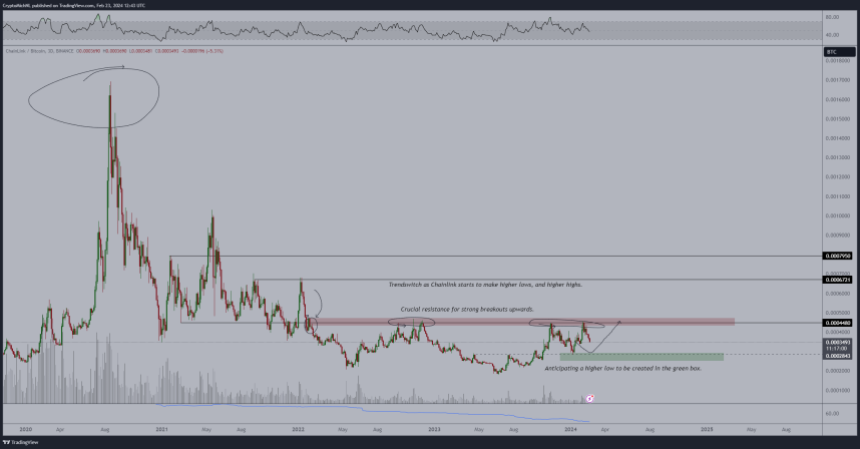
After successfully finding its higher low, van de Poppe anticipates LINK to experience a price reversal, gaining by 4,500 satoshis, which is currently valued at $2.29 at the current Bitcoin price of $50,761. Thus, Chainlink could soon return above the $20 mark. Furthermore, the analyst believes this price gain could lead to LINK finally initiating a breakout, hitting a price in the range of $30-$40 within the next few months. If this prediction proves true, the altcoin could experience a potential maximum gain of 122.71% on its present market price.
At press time, Chainlink continues to exchange hands at $17.96 with a 0.11% gain in the last day. Meanwhile, the token’s daily trading volume has experienced a slight decline of 0.70% and is now valued at $426.65 million. Based on market shares, Chainlink is ranked as the 12th largest cryptocurrency with a total market cap value of $10.55 billion.
LINK trading at $17.944 on the daily chart | Source: LINKUSDT chart on Tradingview.com
Amidst the dynamic world of cryptocurrencies, Ethereum, the second-largest digital currency, has ignited investor enthusiasm, driven by a bold prediction from Michaël van de Poppe, CEO of MN Trading.
Van de Poppe’s forecast projects a remarkable climb for Ethereum, anticipating a potential surge to the range of $3,800 to $4,500. This optimistic outlook gains momentum as Ethereum’s current valuation hovers around $2,980, showcasing a robust performance while its counterpart, Bitcoin, grapples with market challenges.
Several factors contribute to Ethereum’s bullish momentum, a sentiment emphasized by Van de Poppe. Ethereum’s recent outperformance relative to Bitcoin, coupled with a noticeable shift in investor sentiment, is evidenced by data illustrating funds flowing from alternative digital assets into Ethereum. These dynamics are pushing Ethereum’s value closer to the psychological barrier of $3,000.
#Ethereum is on its way towards $3,800-4,500. pic.twitter.com/TfoBGloBsH
— Michaël van de Poppe (@CryptoMichNL) February 19, 2024
Noteworthy events on the horizon, such as the DenCun upgrade and a speculated temporary peak in Bitcoin’s price, are identified as potential catalysts for Ethereum’s continued growth. Van de Poppe even raises the intriguing question of whether Ethereum can reclaim a specific ratio against Bitcoin during these events, hinting at the possibility of reaching even loftier heights.
While optimism surrounds Ether, a balanced perspective is essential. The report acknowledges the volatile nature of the cryptocurrency market, despite the surge in open interest for Ethereum futures contracts across various exchanges.
Cautionary signals emerge, expressing concerns about potential liquidations leading to short-to-mid-term price dips that could dampen the prevailing optimistic mood.
Emphasizing the unpredictable dynamics of the cryptocurrency market, the report underscores the importance of independent research and thorough risk assessment before making any Ethereum-related investment decisions.
The rotation towards #Ethereum seems to be happening.
It’s up to close to $3,000, while the rest lags behind.
Happily skewed with my portfolio towards $ETH for the coming period.
— Michaël van de Poppe (@CryptoMichNL) February 19, 2024
Navigating Uncertain Terrain
Van de Poppe’s optimistic Ethereum outlook positions the cryptocurrency as a potentially lucrative investment opportunity. However, the report advocates for a measured approach, emphasizing the significance of recognizing the inherent risks and uncertainties associated with Ether and the broader cryptocurrency market.
Featured image from Pixabay, chart from TradingView
With AI enveloping much of the media we consume nowadays, Render (RNDR) rides the bullish wave around generative content. According to Coingecko, the token is up over 26% this week with the biggest jump occurring at the monthly timeframe at 60%. It shows that investors are still excited by Render’s possible role within the media space.
The protocol is continuing to develop its capabilities relative to the needs of the media and AI industries. For example, 2023 brought Render to the eyes of the broader public as it carried out its first rendering jobs for the Las Vegas Sphere and Apple with its Apple Vision Pro.
The Render Network’s position as a decentralized GPU-based rendering solution provider is strengthened by this year’s developments in generative AI. One example that has been making rounds on the internet is Sora, OpenAI’s newest entry in the realm of generative content. Capable of creating high-fidelity prompts, Sora becomes the poster child of generative content.
“What is exciting about this level of quality is how well defined 4D scene elements are preserved in latent space – IMO that is key to blending/decomposing neural generated assets within a rendered scene graph,” said the founder and CEO of OTOY Jules Urbach, highlighting the role of Render in the coming future.
.@EMostaque 100% Yes!
And – beyond pixels – Gen AI at this fidelity means we are closing in on generating true rendering primitives (rays/surfaces/BDRFs).
We need to get there for non-raster devices and endpoints: real time video games, spatial platforms – or as @sama, myself… https://t.co/8ca5qNoR33
— Jules Urbach (@JulesUrbach) February 15, 2024
“I believe crossing over this threshold in the very near future will be life-changing for many creators and artists. High friction pain points in digital content creation may soon be re-imagined – without limiting the value and artistry of authentic human creativity and expression,” Urbach added.
Along with the variety of AI products released by big tech companies like META, NVIDIA, and Google, investors are eyeing the growth of Render as a major player in the cloud-based rendering space.
Since its implementation of RNP-004, partnerships with other Web 3 organizations has grown. This month, Nosana was added after RNP-008 was passed in the final vote. The new addition joins the likes of IO.net, Beam, and FedM1.
RNDR Slows As Market Becomes Sluggish
As the hot and bullish market cools, RNDR follows the broader market in its decline in the coming weeks. Investors and traders should be wary of how RNDR reacts to outside pressure. With this in mind, bulls should target the 50% retracement level to slow down any bearish pressure in the short to medium term.
If the bulls fail to materialize any resistance against the bears, the bears can bring RNDR down to $4.6.
Featured image from Pexels, chart from TradingView
NEAR has consistently followed the market trend since the start of the year. The latest market data shows the token is up nearly 30% bi-weekly. This is evidence that investors are still hyped by the recent growth featured within the broader market and the recent developments on the NEAR Protocol.
NEAR is continuing its mission to be the one-all-be-all for entry-level and professional entities within Web 3. Account aggregation, or the consolidation of Web 3 and crypto accounts into one NEAR account, is their current focus.
Account aggregation is, according to their most recent blog post, a “critical pillar of advancing Chain Abstraction.”
It essentially groups every single account you have across the crypto world into a single access point: your NEAR Protocol account. The technology is still in development, but it seems to incite excitement in investors.
If NEAR can implement this innovation seamlessly within its ecosystem and beyond, it will cement itself to be a true innovator within the DeFi and Web 3 space.
According to a recent development overview done by Reflexivity Research, NEAR’s position allows it to be the bridge of all bridges within the crypto space.
Overview of @NEARProtocol‘s Q4 developments:
NEAR Protocol stands as a Layer-1 (L1) smart contract blockchain that couples a state-of-the-art sharded architecture with an emphasis on offering a user experience reminiscent of Web 2 platforms. While maintaining the security and… pic.twitter.com/LzKcMldJy7
— Reflexivity Research (@reflexivityres) February 16, 2024
By distilling various blockchains to create a seamlessly integrated Web3 encounter, the advantages extend beyond mere enhancements in user experience. This approach has the potential to not only enhance UX but also diminish liquidity fragmentation and tribalism inherent in a decentralized crypto ecosystem constructed around disconnected, isolated blockchains, as underscored in a response by NEAR to a Reflexivity post on X.
“abstracting away different blockchains for a seamless Web3 experience has benefits beyond simply improving UX. It can potentially also reduce the liquidity fragmentation and tribalism associated with a fragmented crypto economy built around disparate, siloed blockchains.” https://t.co/nxXMBKdMeJ
— NEAR Protocol (@NEARProtocol) February 16, 2024
In simple terms, NEAR’s recent development can unite the fragmented Web 3 space, onboarding new users and bringing new growth to the crypto world.
In its current situation, NEAR is following Bitcoin very closely in its price changes. Investors should then be careful of possible pitfalls within Bitcoin’s bullish market that may affect NEAR’s ability to climb.
If bearishness does take over the market, investors can rely on the $2.8 price level to slow down any bearish attempt in the short to medium term. However, investors and traders should try and consolidate on this line if NEAR follows any downward pressure from the broader market.
Featured image from Adobe Stock, chart from TradingView
A few outliers continue to break through the bearish attitudes looming over the crypto horizon of late. UNI is one of those tokens, with an impressive jump of over 12% in the past 24 hours, investors have flocked to this altcoin in search of a bullish continuation.
The first quarter of this year brings a lot to the table for investors. Just this month, Uniswap reported that its deployment on Arbitrum led to the swap volume on the latter to jump by a significant amount. The news is also coupled with exciting new info on Uniswap’s latest agenda: the launch of Uniswap v4.
Arbitrum swap volume has grown more than 4x since this time last year
pic.twitter.com/w4iEhKGUty
— Uniswap Labs
(@Uniswap) February 16, 2024
After news that Ethereum, Uniswap’s L1, will have its Dencun upgrade in this year’s first quarter, Uniswap then announced that their latest iteration of the protocol would be launched sometime in Q3 2024.
Now that the launch of Dencun on Mainnet has been scheduled for March 2024, we’re excited to provide an update to the community!
Uniswap v4’s launch is tentatively set for Q3 2024.
From community-built Hooks (https://t.co/WyaGr1Ti1t), to events, to Twitter Spaces, the…
— Uniswap Foundation (@UniswapFND) February 15, 2024
In essence, Uniswap v4 is a more efficient and cost-effective brother of v3. According to Uniswap’s own website, it is a “non-custodial, non-upgradeable, and permissionless automated market maker protocol.”
In the announcement, v4 is currently in its first phase with the developers finalizing the core functionalities and features of the upgrade. The update would let the team create new features on top of the current AMM design of the protocol. This eliminates the need for creating an entirely new design from the ground up.
Uniswap is also ramping up its effort in providing funding for innovators in the Web 3 space. Last week, the Uniswap Foundation X account released a detailed look at the organization’s new granting strategy.
Our vision is simple: to make the @Uniswap Protocol the liquidity layer of the Internet.
As stewards of the Protocol and the Community, we have evolved our grants strategy to turn this vision into reality.
Here’s why and how
— Uniswap Foundation (@UniswapFND) February 7, 2024
In short, the new strategy revolves around granting a minimum of $250,000 in four audience-specific categories: developers, researchers, delegates, and innovation (all stakeholders).
For now, no date of implementation has been announced for these new grants.
UNI: Challenging Week Ahead For Investors
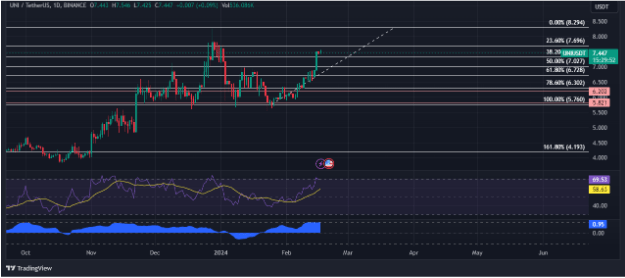
The lead-up to the month of March has certainly brought a level of hype around the broader market, but thus hype has since died down and was replaced by profit-taking attitudes. UNI will inevitably experience this bearishness taking hold in the coming weeks as the market potentially dips.
If this happens, investors and traders have strong support on the 50% and 38.20% price levels. These supports will slow down any bearish advance, stabilizing UNI’s price at the $7.3 and $7 range.
Featured image from Adobe Stock, chart from TradingView
At the time of writing, ORDI is experiencing a substantial increase in price after several events in the crypto world unraveled. Coingecko data reveals that ORDI is up nearly 12% in the past 24 hours. However, it remains to be seen whether this uptick in price will erase the bearishness experienced in the past few weeks.
But right now, the crypto market, as a whole, is up a huge amount. The latest market data shows that the broader market is up nearly 3% after the bullishness brought by major coins and tokens like Bitcoin.
After 11 Bitcoin spot exchange-traded funds were approved by the Securities and Exchange Commission earlier this month, the competition surrounding the Bitcoin ETF space grew this month. According to recent news, Fidelity’s Bitcoin ETF has outpaced Grayscale’s GBTC in inflows. JP Morgan also said that the outflows from GBTC were directed to its newer competitors with lower fees.
“GBTC profit taking has largely happened already…This would imply that most of the downward pressure on Bitcoin from that channel should be largely behind us,” said JPMorgan analysts led by Managing Director Nikolaos Panigirtzoglou in a recent statement.
The financial institution also points to Blackrock and Fidelity’s individual Bitcoin ETFs to dominate the market in the long term. However, Grayscale’s CEO Michael Sonnenshein believes that the majority of the recently approved ETFs won’t survive in the long term. He also defended the higher feeds imposed by Grayscale compared to its competitors.
“Investors are weighing heavily things like liquidity and track record and who the actual issuer is behind the product. Grayscale is a crypto specialist. And it has really paved the way for a lot of these products coming through,” said Sonnenshein in a recent interview with CNBC.
ORDI is mostly following Bitcoin’s pace in the broader market. As of writing, BTC is sitting at $43.4k and rising. If Bitcoin continues to sail the bullishness, we might see ORDI follow suit.
In the context of ORDI, events such as those mentioned above will also put the spotlight on BRC-20 standard tokens which has gained momentum since last year. As of now, ORDI’s position remains attractive for investors and traders as it rides the bullish wave that Bitcoin created.
If this bullishness continues, bulls will have enough momentum to settle on the 50% retracement level, which will provide a solid base to pump higher in the future. However, a more conservative bullish prediction is ORDI stabilizing above the 61.80% retracement level. If this happens, investors and traders will still experience profits with a much more stable platform for future price movements.
Featured image from Shutterstock, chart from TradingView
The cryptocurrency has dipped following the most bullish recent event in crypto history, the launch of spot bitcoin ETFs, apparently causing a crisis in faith.
Following the launch of bitcoin ETFs, market watchers are looking for the next event that could drive market prices.
Crypto analyst EGRAG crypto recently posted an analysis of the various scenarios for the price trajectory of XRP in the near future. XRP, like most top cryptocurrencies, has received many price predictions in the past few months, as the entire crypto market witnessed a consistent increase in activity throughout the fourth quarter of 2023.
However, predicting the future outlook of cryptocurrencies can be a very tricky endeavor, but this crypto analyst, known for his bullish stance on XRP, outlined different trajectories for XRP in the coming months, with some of them being more bullish than others.
XRP has been on a roller coaster ride this year. The crypto went through the first half of the year still carrying on the burden surrounding Ripple’s lawsuit with the SEC since 2020. By the second half of 2023, XRP became the first cryptocurrency with legal clarity in the US. This caused its price to skyrocket from $0.46 in less than 24 hours to $0.82, the highest point in 15 months.
Despite the crypto still being up by 80.45% this year, the price has since corrected, and XRP is now trading at $0.6225. According to crypto analyst EGRAG’s analysis, the crypto is still in a bullish mindset that would send it over $1 in the coming months, a price level it hasn’t seen since November 2021.
#XRP Color Code To $1.4:
If #XRP triumphantly closes above the Fib 0.5 level at 0.57C with undeniable confirmation, we’re setting our sights on the $1.4!. This meteoric rise is just around the corner.
But remember, there’s more to this story! Dive into the color-coded clues… pic.twitter.com/DC0ss6Ip27
— EGRAG CRYPTO (@egragcrypto) September 21, 2023
Under the first scenario presented by EGRAG, XRP will reach $1.10 by February 2024. However, the crypto could revisit another swing low at $0.55 to $0.58 before making this bullish run. If this happens, it would make it much easier for the crypto to to achieve multiplier factors over 10X and 20X.
In the second possible outcome, XRP will surge to $1.4 in the first quarter of 2024. EGRAG noted that the eventual approval of spot Bitcoin ETFs in the US could turn out to be a sell-the-news event, which could see XRP crashing back down to $0.75 to $0.80 between July and September 2024. If this scenario were to play out, the $0.80 to $0.85 price level would become a strong “MACRO Resistance” for future price action.
In the third and most bullish scenario, XRP and the entire crypto market will surge alongside Bitcoin after the approval of spot ETFs in the US. As a result, XRP could easily surpass its current all-time high by March 2024 and might peak between $2.2 to $2.8.
It’s important to note that the crypto industry will become open to traditional investors by this point, including big Wall Street investors. EGRAG warned of potential manipulation of retail investors by the “big boys,” adding that “they are ruthless and only few will survive and emerge victorious.”
Featured image from Pexels
In the past week, Bitcoin recorded an overall positive performance, gaining by 3.45%, according to data from CoinMarketCap. This price rise adds to BTC’s bullish form in the last 30 days, during which the maiden cryptocurrency has surged by 16.78%. However, despite this market uptick, there appears to be a growing trend of caution among Bitcoin traders, indicating fear of a potential price dump.
In an X Post on Saturday, popular crypto analyst Ali Martinez shared an interesting observation regarding the Bitcoin market with his 37,000 followers.
According to Martinez, there is a significant decrease in the estimated leverage ratio in the BTC market across all exchanges. This indicates that traders are reducing their leverage risk and are now treading carefully in the BTC market, even amidst the current price gain.
As #Bitcoin price climbs, we see a decrease in the Estimated Leverage Ratio – a sign that traders are reducing their leverage risk. This suggests a more cautious approach in the #crypto market despite the $BTC price uptick. pic.twitter.com/421FjfyV6b
— Ali (@ali_charts) December 22, 2023
For context, leverage is a trading function that allows users to borrow funds in order to increase the size of a position beyond what would be possible with one’s own capital alone. Leverage allows traders to amplify their profits potentially, albeit it also comes with increased risk.
Now, the Estimated Leverage Ratio is a metric that quantifies the extent to which traders in the market are using leverage. Thus, a decreased estimated leverage ratio implies that traders are reducing the amount of borrowed funds relative to their own capital in their positions. In other words, they are decreasing the level of leverage they are using, which can be seen as a sign of caution among traders against a potential market dump.
The BTC market, which is currently on an uptrend, has witnessed similar puzzling events recently. On Friday, NewsBTC reported that Bitcoin whales sold 50,000 BTC worth $2.2 billion in the last week. All these movements are indicative of investors preparing for a possible bearish trend.
At the time of writing, Bitcoin trades around $43,626, with a 0.09% decline in the last day. Meanwhile, the token’s daily trading volume is significantly down by 29.63% and is currently valued at $17.22 billion.
For now, there is no clear indicative danger to BTC’s bullish form. Albeit, there is a high level of anticipation in regard to a potential approval order of the spot Bitcoin ETF in January.
While many analysts predict a spot Bitcoin ETF will lead to increased demand for Bitcoin, others are fearful of turning the maiden cryptocurrency into a state-controlled financial asset. However, Bitget chief analyst Ryan Lee anticipates Bitcoin to trade between $32,000 – $50,000 depending on the effects of this investment fund.
After an impressive 300% rally in the past week, Terra Luna Classic (LUNC) is now facing bearish pressure as it slumped nearly 10% this week.
Despite positive internal news for LUNC, the bears still hold the market at a chokehold. According to CoinGlass, a total of $222,000 worth of long positions were wiped out in the past 24 hours despite the open interest remaining positive.
Terra Luna Classic is making some noise online with its community X account being fairly active this month. Enterprise Protocol, a project powered by Terra Luna Classic, recently announced that the protocol can now create cross-chain treasuries on the Juno Network.
1/10 It’s official: cross-chain treasuries are LIVE on Enterprise DAO!
With the addition of cross-chain treasuries, Enterprise DAO becomes an even more powerful no-code DAO platform. See the announcement for details, or read on
https://t.co/12HOpE6RJW
— Enterprise Protocol (@enterprise_dao) November 24, 2023
1/ Big announcement!
Enterprise DAOs can now create cross-chain treasuries on @JunoNetwork
What this means for DAOs and the $JUNO community

— Enterprise Protocol (@enterprise_dao) December 14, 2023
“Enterprise is dedicated to simplifying DAO management. This includes no-code setup, voting & treasury management, and easy distribution of rewards to members. But limiting the fun to one chain would be sad. Which is why Enterprise DAO is expanding cross-chain!” the dev team said in a recent thread.
2/ Enterprise is dedicated to simplifying DAO management. This includes no-code setup, voting & treasury management, and easy distribution of rewards to members.
But limiting the fun to one chain would be sad
Which is why Enterprise DAO is expanding cross-chain!
— Enterprise Protocol (@enterprise_dao) December 14, 2023
This development would bring more throughput to the network, potentially increasing its exposure to other investors. Even though LUNC enjoys an active community, the market still holds a large sway on the token’s price. As of writing, the market is slowly cooling down after an enormous rally in the past week.
LUNC’s current price is standing above $0.00017491. As it currently stands, the token is at a crucial price point as any movement here can make or break future price movements. Investors and traders should exercise caution in the next couple of days as the market slows down and assets return to a more stable price point.
LUNC’s main problem is its reliance on major market movements to instigate a hike in price. According to Coingecko, both Bitcoin and Ethereum are experiencing major pullbacks in price after a successful rally last week.
Although LUNC is included on the gainers list, investors should not hold this to heart as any pain in the broader market will hurt short to medium-term gains.
But there is hope on the horizon as the US economy enters a dovish phase with market leaders speculating about rate cuts in 2024.
“The soft landing that many doubted was possible is becoming more realistic every day,” Ryan Detrick, chief market strategist at Carson Group, said in an interview with Reuters.
“Inflation is no longer the problem it was and we still have a very healthy consumer, judging by today’s retail sales data,” he added.
Featured image from Shutterstock
In a recent analysis, a crypto market expert has discovered key elements that could trigger a massive surge in the Bitcoin price.
Head of Research at CoinShares, James Butterfill has published an in-depth analysis of a revelation that could catalyze a significant increase in Bitcoin’s price. Butterfill’s research delves deep into the present dynamics of the crypto market surrounding the potential approval of Spot Bitcoin ETFs and the inflows that could follow.
Using an analysis by Galaxy, Butterfill deduced that if 10% of the $14.4 trillion addressable assets within the US were to go into Spot Bitcoin ETFs, each with a 1% allocation, then over $14.4 billion inflows would be witnessed. If the predictions prove true, Butterfill has stated that it would signify the largest influx ever seen in the financial markets.
“One could assume that perhaps 10% invest in a spot bitcoin ETF with an average allocation of 1%, which would equate to US$14.4 billion of inflows in the first year. If this were correct then it would be the largest inflows on record, with the largest so far being in 2021, which saw US$7.24 billion of inflows, representing 11.5% of assets under management (AuM),” Butterfill stated.
The crypto expert also highlighted a distinct correlation between asset under management (AuM) inflows and price changes, suggesting that price surges occur around the same time inflows increase.
“There does seem to be a relationship between inflows as a percentage of AuM and change in price. Inflows do appear to be coincident, the week the prices rise so do flows rather than one leading the other,” Butterfill said.
In his research, James Butterfill also predicted that the price of Bitcoin could rise as high as $141,000 if driven by $14.4 billion inflows.
He stated reservations about his deductions, citing that it would be difficult to accurately estimate the amount of inflows that would occur if Spot Bitcoin ETFs were introduced.
“If we take the aforementioned US$14.4 billion of inflows, the model suggests it could push the price up to US$141,000 per Bitcoin. The problem with the estimate of inflows is that it is very difficult to ascertain exactly how much inflows there will be when the spot ETFs are launched,” Butterfill stated.
Butterfill also acknowledged the uncertainties surrounding demand for Spot Bitcoin ETFs following its potential approval. He stated that there were many variables, both regulatory and corporate that could significantly influence the perception of Bitcoin’s role in society.
“Ultimately, it is very difficult to ascertain just how big the potential wall of demand will be once a spot-based ETF is launched. We know that it effectively diversifies a portfolio and enhances Sharpe ratios, but regulatory approval and corporate acceptance are slow-burn issues due to Bitcoin’s perceived complexity,” Butterfill concluded.
XRP is one of the few cryptos with impressive price action this year. The cryptocurrency has been in the public eye for the past few months, as traders wait eagerly for XRP to embark on a major bull run ultimately. However, the crypto has been down for the past few days amidst ongoing market consolidation. Price action shows that XRP is down by 9% in a 7-day timeframe and is currently trading at $0.59.
A recent price prediction made by the cryptocurrency exchange Changelly suggests that the value of XRP could skyrocket to the moon very soon. Its new price forecast says it could surge over 1,700 times its current value over this decade. This would cause the price of one unit of the token to increase from its current level of approximately $0.60 to more than $11 by 2030.
XRP’s growth has mostly been deterred since 2020 by the SEC’s lawsuit with Ripple, the technology company tied to the crypto asset. The situation changed recently in July 2023, and XRP is now in a position to step out of the shadow cast by this lawsuit.
Although XRP’s price chart has rebounded at a resistance at the $0.70 level and looks like is going to end today with a red bearish candle, general sentiment still remains bullish in the long term.
According to Changelly’s XRP price prediction, the crypto points to a 63 greed on the XRP Fear-Greed Index. As a result, the exchange puts the monthly closing price at $0.8032, a 33.87% increase from its current price.
The optimistic outlook of the crypto exchange extends well beyond the scope of the current year’s forecast. Changelly predicted that XRP could break above its current all-time high of $3.84 by 2027.
Assuming the trend of price appreciation continues, XRP may surpass the $10 threshold by 2030, registering an average and maximum price of $9.71 and $11.37 respectively. This represents a staggering 1,790% increase from its current price. Additionally, the company also projects XRP reaching an average price of $19.91 in the two years after and a maximum price of $23.46 by 2032.
As of right now, XRP is the only crypto with a clear regulatory status in the US. Changelly’s price prediction is obviously very bullish, but it resonates with the larger sentiment among crypto traders and analysts.
In the short term, most analysts expect XRP price to remain volatile but trade within the $0.6 to $1 range for the remainder of 2023. Very bullish predictions have come for a larger timeframe. Analyst ERGAG CRYPTO has set various targets for XRP’s price, ranging from $5 to $27. From a technical perspective, XRP’s price just entered a Dollar Cost Averaging (DCA) ranging zone, presenting an opportunity for buying more xRP.
There’s no guarantee that XRP will reach $10 or even come close, but Ripple’s progress with various financial institutions and payment providers fuels optimism about XRP’s future value over the next decade.
Featured image from Pixabay


