Pro-XRP Lawyer Deaton Picks His Top 10 Cryptos For The Year Ahead

In a recent post on X (formerly Twitter), noted XRP advocate and lawyer John Deaton shared his top 10 cryptocurrency picks for the next 12 months. His selection includes a mix of well-established and emerging digital currencies.

He stated, “If you had to pick only 10 tokens to own for the next 12 months (as a trade) what are they? Here’s mine: BTC, XRP, ETH, QNT, RNDR, SOL, KAS, AVAX, HBAR, CSPR. What am I missing?”

Analysis Of The Pro-XRP Lawyer’s Picks

Bitcoin (BTC): Deaton likely selected Bitcoin due to the potential imminent approval of a spot Bitcoin ETF in the United States. Bloomberg Intelligence analysts anticipate that the US Securities and Exchange Commission (SEC) might approve multiple spot Bitcoin ETF by January 10, 2024, a move that could significantly impact Bitcoin’s value

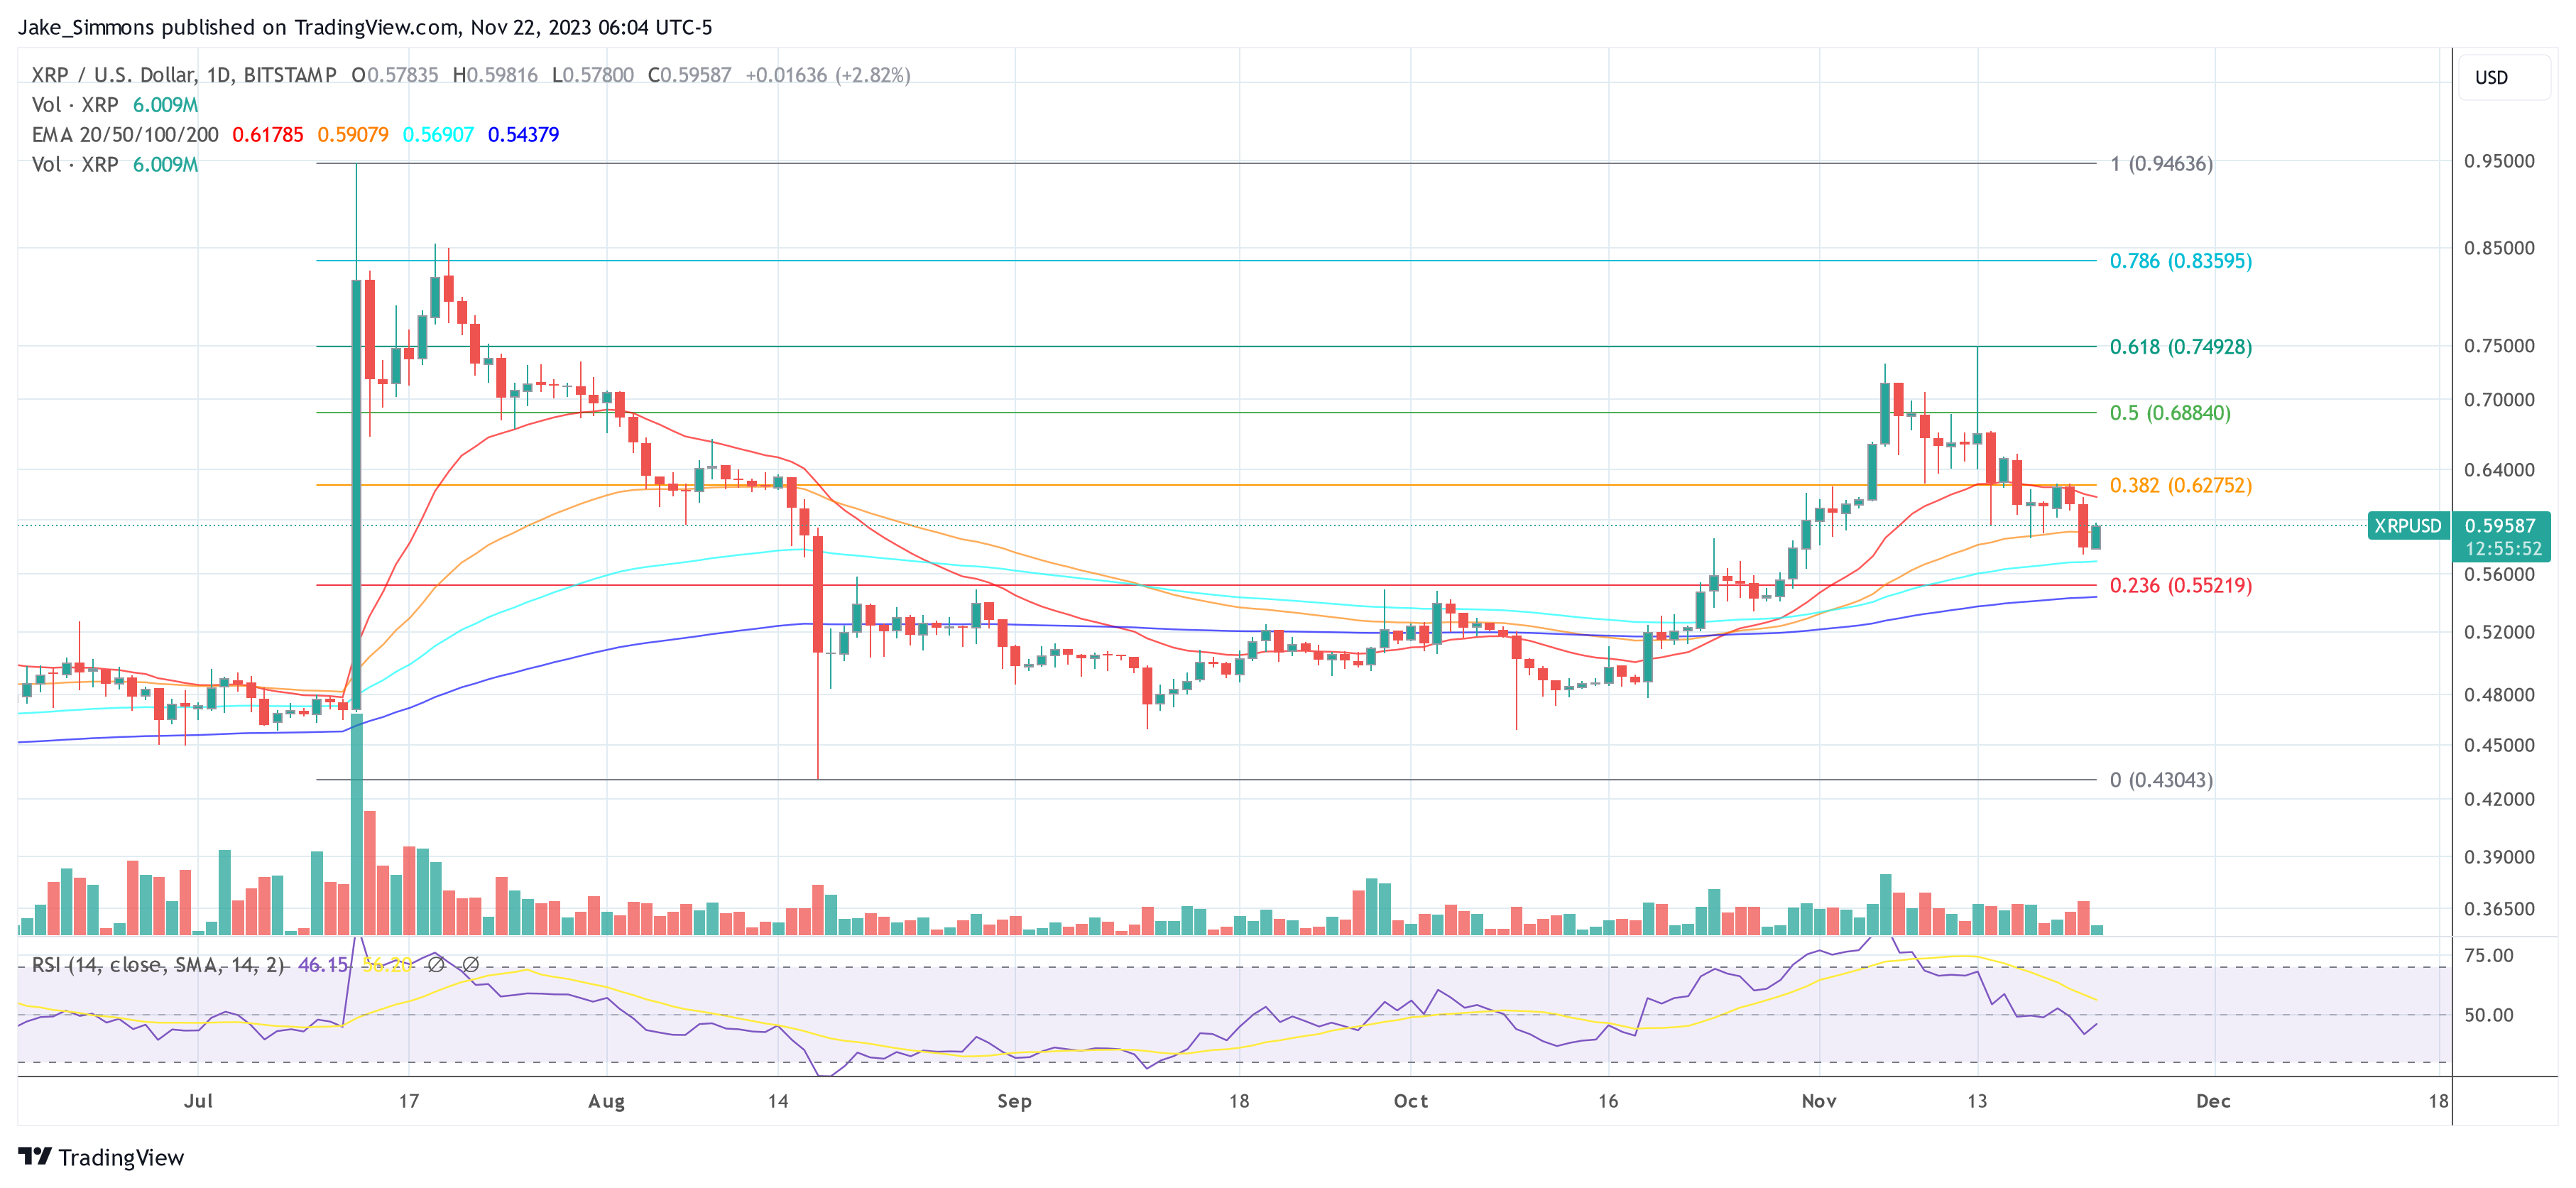
XRP: Deaton’s choice of XRP is consistent with his role as a strong supporter and legal advocate for the XRP community. XRP’s status as a regulatory-defined token in the United States with high utility adds to its appeal. Currently, XRP is consolidating after being rejected at the 0.618 Fibonacci retracement level at $0.7492.

XRP price

Ethereum (ETH): Despite the harsh criticism of Ethereum’s founder, Deaton has included ETH in his list. This might be due to its position as the second-largest cryptocurrency by market cap. Also, BlackRock and several other financial giants have recently applied for a Spot Ethereum ETF, adding to the potential bullish trajectory of ETH in the next 12 months.

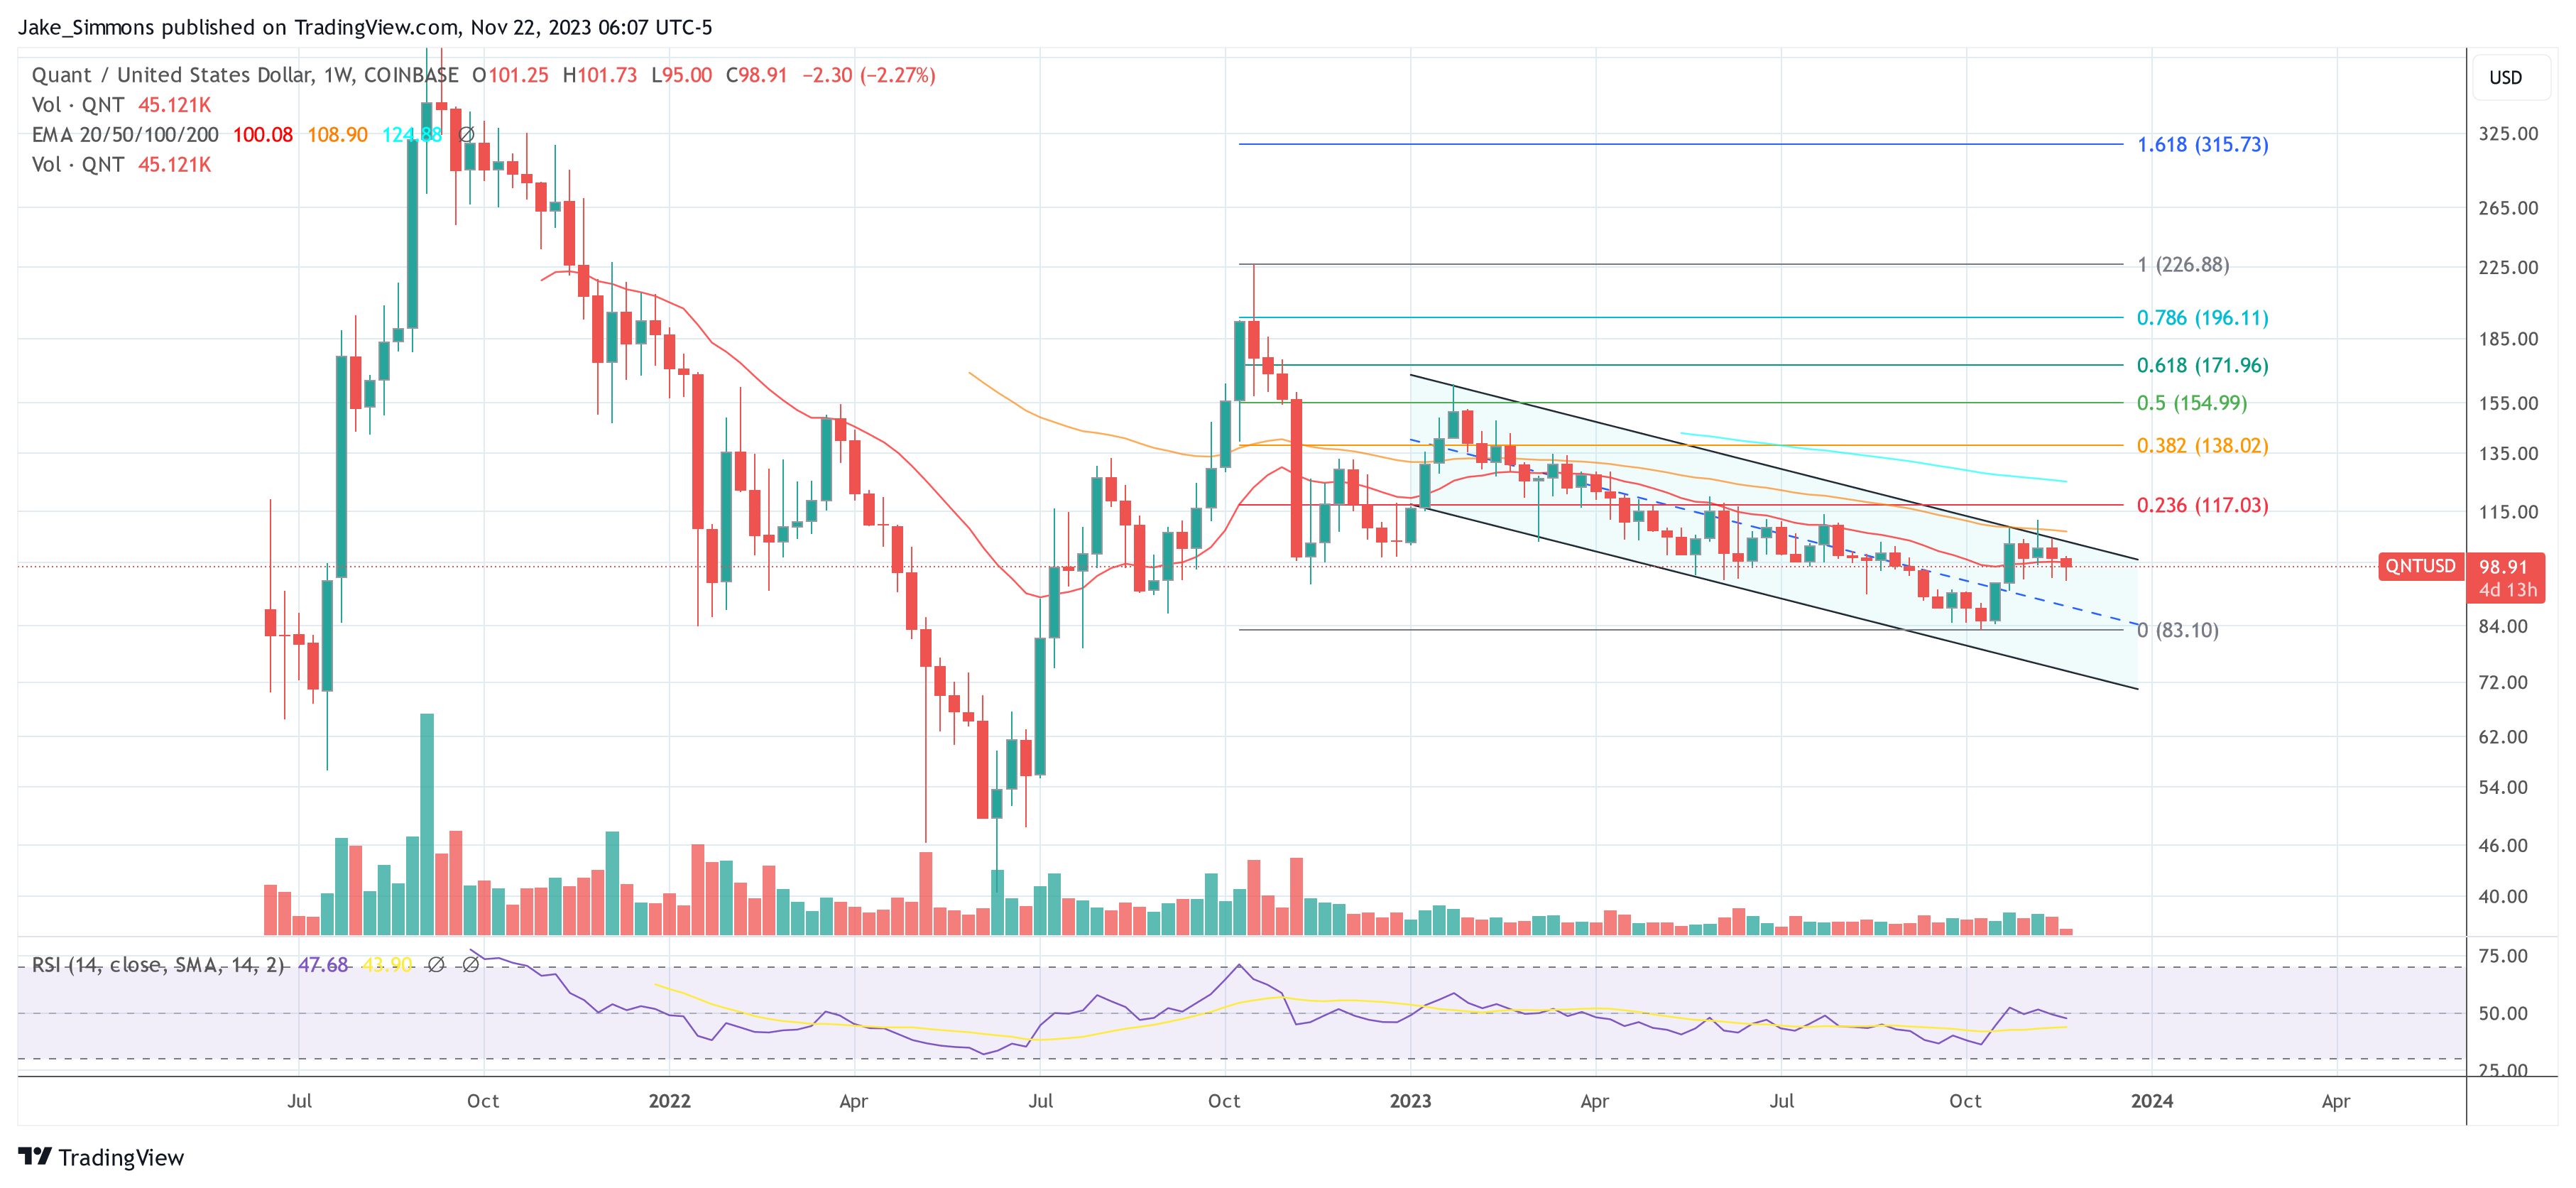
Quant (QNT): The QNT token of Quant Network has found itself in a downtrend channel since late January this year, down approximately 35% from its year-to-date high. With the current price of $98.74, QNT is 78% below its all-time high of $428.38 on November 21, 2023. Nevertheless, Quant can boast partnerships with major financial institutions, including the Bank for International Settlements (BIS), Bank of England, Bank of Canada, MasterCard, Amazon, and Barclays, to develop and test use cases for central bank digital currencies (CBDCs).

Quant price

Render Network (RNDR): The RDNR token is currently up 725% since the beginning of the year. Render Network provides a decentralized GPU rendering platform, allowing artists to scale GPU rendering work on-demand to high-performance GPU nodes. Notably, the RDNR price has also profited from the AI narrative.

Solana: SOL has been one of the other big winners this year, up nearly 600% at the current price since it went below $8 at the end of last year. Solana is currently seen as the potential biggest challenger to Ethereum as a layer-1 blockchain, which is why Deaton may have ranked SOL on his list.

Kaspa (KAS): Kaspa has gained attention due to its positioning as a highly scalable Layer-1 blockchain, with a focus on fast confirmations and high throughput. Its underlying technology, GhostDAG/PHANTOM protocol, aims to balance security, scalability, and decentralization. The KAS token’s impressive performance, with an over 2,600 % increase year-to-date, makes it a notable inclusion.

Avalanche (AVAX): Avalanche’s AVAX token might be included due to its recent gains of almost 130% since mid-October. Deaton may have chosen AVAX because of Avalanche’s involvement in the Monetary Authority of Singapore’s tokenization initiative, Project Guardian, as well as its partnership with Amazon Web Services and Deloitte, all of which are potential catalysts for price appreciation.

Hedera (HBAR): Hedera Hashgraph has gained prominence by becoming part of FedNow, the US Federal Reserve’s instant payments platform. This development led to a significant surge in the price of Hedera’s HBAR token.

Casper (CSPR): Casper’s inclusion may be due to its position as one of the fastest-growing blockchain projects, with a focus on solving the blockchain trilemma of scalability, security, and decentralization.

Remarkably, Deaton’s selections reflect a balance between established market leaders like Bitcoin and Ethereum, and emerging, high-potential projects like Kaspa and Casper. This blend indicates a strategic approach to cryptocurrency investment, recognizing both stability and innovation within the digital asset space.

Quant (QNT) Records Biggest Whale Transactions In 16 Months

According to a report by Santiment, Quant (QNT) has just recorded its largest amount of whale transactions in 16 months. The on-chain analytics platform noted that 187 QNT transactions were executed today, culminating in a value of over $100,000, the highest the Quant Network has recorded since September 2021.

Quant Whale Activity Soaring

Source: Santiment

Just over a week ago, Santiment had also reported some level of whale activity on the Quant Network that caused the QNT token to boost in value by 10%. However, unlike then, the massive increase in whale transactions today is yet to produce such positive effect. 

At the time of writing, the price of QNT has decreased by 1.18% in the last 24 hours, falling to a value of $112.71. According to more data by CoinMarketCap, the token’s 24-hour trading volume has also declined by 24.38%. That said, Quant (QNT) remains the 32nd largest cryptocurrency with a market cap value of $1,361,238,271.

What To Expect From Quant (QNT) In 2023?

Quant (QNT) is believed by many to be one of the most promising coins for 2023. Although the token’s price dropped by 40% over the previous year, Santiment tweeted a report stating that QNT’s total supply on exchanges had decreased by 23.4% within the same period. 

This indicates the coin experienced an increased demand in 2022 and could be set for a massive price rally as the crypto market recovers in the coming months.  

According to price predictions by Bitnation, QNT could trade as high as $203.07 in 2023, indicating a plausible 80.17% on the current market price. The team also anticipates the asset’s average and minimum market prices to be around $169.22 and $135.38, respectively.

Coincodex, another popular crypto prediction site, also paints a positive outlook for the QNT token. According to their 2023 price predictions for the altcoin, the coin is expected to attain a value of $113.46 in five days and $135.39 in 30 days. In the next one year, they believe QNT could hit a market price of $175.27 if its growth pattern mirrors that of the internet. 

However, it is worth noting all these forecasts are not guaranteed, and QNT could even suffer the opposite fate, as no entity can fully predict the movement of the crypto market due to its high volatility.

QNT trading at $112.68 | Source: QNTUSD Chart on Tradingview.com

Going into the new year, Quant Network has already stated its aims to expand its ecosystem through the deployment of more projects, several of which are already under development. 

Quant also plans to introduce more updates to the Overledger blockchain, and additional developer solutions to aid the process of building and deploying blockchain projects. Going by all this, there is quite lot to expect from Quant in 2023. 

Quant Shows Potential For Surge Beyond $150 – Can QNT Hit Its Target?

Quant (QNT), a cryptocurrency with a total market cap of $1.88 billion, is outperforming some of the more popular altcoins out there, going up by 10% during the last seven days.

According to latest tracking from Coingecko, at the time of this writing, the altcoin is changing hands at $129.88 and is in the midst of a 22.5% increase over the previous two weeks.

At a glance:

  • Quant has established important support zones of $111.5 and $100
  • QNT may soon test the $157 resistance territory
  • The altcoin is enjoying a weekly gain of 10%

Prior to the crypto market woes that were brought about by the collapse of the FTX exchange platform, the digital asset was enjoying a good run above the $160 region.

After the exchange imploded, QNT was hit very hard, diving all the way down to $95.28 on November 14. Since then, the digital coin has done a great job of bouncing back to reclaim and sustain the $100 territory.

Over the last few days, Quant’s price action formed an ascending triangle pattern which indicates more bullish activity from the 30th largest cryptocurrency in terms of overall valuation.

A Possible Push Beyond $150 Zone For QNT

With its Relative Strength Index (RSI) positioned above the neutral zone, there is indeed a positive outlook for the trajectory of Quant price.

Source: TradingView

On three different occasions, QNT has already tested its support and resistance trendlines of $128-$125, indicating that traders have active participation for the asset’s technical set-up.

The asset, on December 2, made a decisive push beyond the set resistance neckline of $128, triggering the bullish run that comes with its current price action pattern.

Combining with the definitive increase in QNT trading volume, this momentum is expected to kickstart a strong surge of 18.5% to catapult the asset all the way up to the $155 resistance region.

Traders and those who are considering buying right now, however, need to keep a close eye on the altcoin as the bullish thesis will be nullified in the event of a price dump that pulls Quant below its support zones of $111.5 and $100.

Worst Case Scenario For Quant

Should the digital coin fail to capitalize on its current momentum and do fall below the crucial support territory, Coincodex predicts a sharp decline for its trading price.

If this unfolds, within the next five days, Quant will most likely decrease its value by almost 27% to change hands at $95.77.

Meanwhile, after such price dump, the asset is seen to once again mount a recovery to trim its losses. The online crypto information provider predicts that during the next 30 days, QNT will possess a trading price of $101.58

QNT total market cap at $1.5 billion on the daily chart | Featured image: Motivation Grid, Chart: TradingView.com

Quant (QNT) Struggles Above Key Support Of $100; Here Are Levels To Watch

  •  QNT’s price continues to hold strong as the bull refuses to give in to the FTX fiasco as price trends are above $100. 
  •  QNT’s price continues to look weak as bearish market sentiments increase, with things looking uncertain for most traders and investors. 
  • QNT’s price looks weak and continues to trade below the daily 50 Exponential Moving Average (EMA) as bulls attempt to reclaim the region.

The price action displayed by Quant (QNT) in previous weeks was not short of a spectacle but has yet to meet those expectations, with the price showing so much price action in recent weeks, rallying to a high of $240. Following the collapse of the FTX effect affecting small crypto projects like Genesis as the market continues to look weak on each passing day signifying the bottom is not yet in, leading to the price of many altcoins, including Quant (QNT), battling for survival. The Domino effect of the FTX saga on investors has left the market at a standstill as the market has yet to make a major move after previous weeks saw the price of QNT struggling to hold above $100. (Data from Binance)

Quant (QNT) Price Analysis On The Weekly Chart

The past few days have been filled with so much turbulence in the crypto space as many altcoins have struggled to show strength after losing their key support holding off price decline.

The current uncertainty surrounding the market has resulted in reluctance on the part of traders and investors to make altcoin purchases leading to more sell orders than buy orders as the price of QNT is left on balance. 

FTX and Genesis’s news have hugely impacted the price of altcoins, including QNT, which has escalated the price to a region of $100 as the price bounced off this region to reclaim $107, just a few prices above key support of $100. 

After the price of QNT closed below the weekly high of $150, there are high chances of the market going lower, with the prices of QNT looking weak. 

Weekly resistance for the price of QNT – $150.

Weekly support for the price of QNT – $100.

Price Analysis Of QNT On The Daily (1D) Chart

Daily QNT Price Chart | Source: QNTUSDT On Tradingview.com

The price of QNT remains considerably strong in the daily timeframe as the price trades above $100 support after bouncing off from the region of $91. 

The price of QNT trades at $107; the price needs to hold strong above this region for the price to rally to a high of $120, where it would face resistance to trend higher. If the price of QNT breaks below $100, we could see more sell-off.

Daily resistance for the QNT price – $130.

Daily support for the QNT price – $100.

Featured Image From NBTC, Charts From Tradingview

Quant Wallet Holders Reach More Than 90,000 – Time To Buy QNT?

Quant (QNT) may not be like the Bitcoin and some of its fellow altcoins like Ethereum, Dogecoin and even Shiba Inu in terms of social dominance but it is silently making its move to be included among the list of must-have crypto assets right now.

The cryptocurrency, ranking 32nd in terms of market capitalization, seems to have recovered a bit after the broader market experienced a severe slump triggered by the collapse of FTX which used to be the third largest exchange platform in the world.

According to tracking from Coingecko, over the last seven days, Quant managed to jump by 7.7% and has so far trimmed its 30-day losses to just 44%. At the time of this writing, the digital asset is changing hands at $115.85.

The steady performance of the altcoin despite the multiple occurrence of bearish cycles in the market over the last few months seem to have sparked greater interest for it as evidenced by the sudden but impressive increase in addresses that hold the crypto asset.

Quant

Image: Invezz

A Decent Growth For Quant

Some experts believe that one of the best ways to measure the growth of a crypto network is the number of addresses that hold a particular cryptocurrency.

Quant notched an important milestone in that department as it successfully added 13,000 wallets in just a span of seven days.

This is the biggest number that was tallied by QNT on a weekly basis. It is also important to note that over the last 236 weeks, the crypto’s network recorded 77,000 addresses that were holding the digital currency.

QNT wallets surpassed 90,000 in number last week, following the largest weekly increase in address count.

Because this sudden spike happened during the same time when the crypto market crashed because of the unfortunate series of events that led to the implosion of the FTX platform, some experts believe there was significant influx of Quant tokens from various exchanges.

QNT Flexes Its Long-Term Muscle

Even with the positive development, it can’t be denied that QNT also took a hit when the entire market collectively declined and all crypto assets experienced severe price dump.

In fact, Quant nosedived all the way down to $94. However, the altcoin showcased a different level of resiliency as it held its support range steadily despite strong selling pressure. In doing so, it prevented itself from revisiting the $40 marker which is considered to be its year-to-date (YTD) low.

Moreover, for the past two days, the cryptocurrency was able to increase its value by more than 30%, confirming the narrative of a strong accumulation phase that led to the sudden uptick in number of addresses holding it.

Additionally, the Quant network has tallied its highest growth rate this month, indicating a robust utility and organic performance that bodes well for the asset and are inviting signs for investors that are considering buying the token.

QNT total market cap at $1.45 billion on the daily chart | Featured image from SheKnows, Chart: TradingView.com

Quant Gets Listed On Binance Futures As Price Retests $170; What’s Next For QNT?

  • QNT’s price remains strong despite rejection from a high of $220 as the price holds above the key support area. 
  • QNT to look green as price takes the crypto market by surprise and leaves bears in disbelief as Binance list QNT in its futures trading platform. 
  • The price of QNT trades above $160 as the price continues its uptrend above 50 and 200 Exponential Moving Averages (EMA) on the daily timeframe. 

The price of Quant (QNT) despite having a rough start to its price in previous weeks, has shown what to expect as the crypto market goes back to its trending days as price showed some great strength leaving bears in disbelief. The crypto market hasn’t enjoyed the Uptober that many were expecting as the market continues to range despite showing great signs of a rally in the early part of the month. Bitcoin (BTC), Ethereum (ETH), and other crypto assets have remained dormant except for a few exceptional coins like Quant (QNT), which have shown bullish price movement. (Data from Binance)

Quant (QNT) Price Analysis On The Weekly Chart
Weekly QNT Price Chart | Source: QNTUSDT On Tradingview.com

Most projects have not fared well in the bear market, as most have seen more than 50% price declines, discouraging most traders and investors from stockpiling these assets.

With Bitcoin’s dominance (BTC.D) rising, this could hurt the price of most crypto assets. A rise of BTC.D above the 45% mark would mean altcoins will decline more with every slight price rejection for BTC, but this hasn’t been the case for QNT as the price continues to rally despite BTC.D rise and BTC continues in its range movement.

After rallying to a high of $220, the price of QNT faced resistance to trend higher to $330 as the price has struggled to break above the resistance at $220. 

The price of QNT has retraced to a region of $170 as bulls still take control of the price; if the price of QNT holds above its uptrend line, we could see more rallies from QNT.

Weekly resistance for the price of QNT – $220.

Weekly support for the price of QNT – $110.

Price Analysis Of QNT On The Daily (1D) Chart
Daily QNT Price Chart | Source: QNTUSDT On Tradingview.com

The daily timeframe for the price of QNT continues to show bullish strength despite the uncertainty in the crypto market, with BTC price trading at its demand zone. 

After facing resistance and dropping to $165, the price of QNT still looks strong ahead of a possible rally to $220.

The price of QNT needs to hold above $110 for the price to maintain its bullish momentum; a break below this region will mean bears are in control of QNT prices.  

Daily resistance for the QNT price – $220.

Daily support for the QNT price – $110.

Featured Image From zipmex, Charts From Tradingview

Quant Balloons Over 35% In Last 7 Days Courtesy Of Strong Social Metrics

Quant is showing a strong push in the face of struggles in the crypto space as it doubled (and added some more) its 14-day price pump.

  • Quant outperforms Bitcoin and Ethereum in terms of 14-day and 30-day price increases
  • QNT is down by almost 10% over the last 24-hours but is still up by almost 29% over the last week
  • Quant could rally all the way up to $300

While a price increase of 28.9% over the last two weeks already sounds impressive considering the extended winter season that caught up with the cryptocurrency market, Quant was able to top that with its gains for the past 30 days.

At press time, tracking from Coingecko shows the spot price for QNT is $183.39. While it went down by almost 10% over the past 24-hours, it is still up by 76% on its month-to-date performance.

The 30th largest cryptocurrency in terms of market capitalization ($2.668 billion) is among the highest gainers right now, outperforming pack leaders Bitcoin and Ethereum in this department.

Quant Fails To Sustain Price Above $200

The altcoin made an impressive recovery from its February showing when its resistance marker was at $140. In crypto space, resistance refers to the point when an asset’s price stops increasing.

Source: TradingView

Bulls were able to dominate the bears and the increased trading volume for Quant was reflected on the asset’s On-Balance Volume (OBV).

Much like its price, QNT’s Relative Strength Index (RSI) also experienced a massive surge that led to a score of 71 which indicated the crypto was overbought.

Yesterday, the altcoin reached $225 but was not able to maintain that range as there was intense selling pressure. The almost 10% decline was actually expected for Quant as some of its indicators pointed towards an immediate price correction.

The good news for holders is that the bear block that was observed back in February is now acting a bullish breaker, opening a window for a sizable price rally that ranges from $250 to $320.

Quant Social Dominance Fuels Surge

In its recent post about Quant’s social dominance, LunarCrush made mention of the incredible surge that the crypto also got in this department.

On October 9, hourly mention about QNT reached 1.17K, which was the crypto’s highest over the last 90 days. Shortly after, Quant went on a rampaging price surge, increasing by as much as 96.30% to trade at $158.3.

This proved that a sizeable increase in social dominance numbers works in favour of the cryptocurrency and if its predicted price increase is realized, there is a high possibility that the digital asset will be at the forefront of talks within the crypto space.

If that happens, an extended bull rally might come. Investors, however, are still cautioned as Quant’s network activity is minimal at this point indicating development and improvements might not come anytime soon.

QNT total market cap at $2.5 billion on the daily chart | Featured image from Invezz, Chart: TradingView.com

Disclaimer: The analysis represents the author’s personal views and should not be construed as investment advice.

Quant (QNT) Skyrockets Through $200 – Here Is Why

While the broader crypto market continues to linger in bear territory, one cryptocurrency continues its steep climb undeterred and now occupies rank #27 in the top cryptocurrencies by market capitalization.

Quant (QNT) was trading at half its price exactly one month ago. Today, QNT broke through the $200 mark for the first time since November last year and is currently writing its fifth weekly green candle, according to TradingView. At the time of writing, Quant is trading at $216.

Apparently, the QNT is currently carried by an extremely large hype, which is reflected in the Relative Strength Index (RSI), which is close to a value of 75. An RSI of over 70 indicates an overheated market, as the price has risen too high too quickly. Thus, according to trading theory, a cool-down in the form of a retest of the last high at $133 for QNT could be possible.

QNT’s price is currently above $216. | Source: QNTUSD price chart from TradingView.com
Reasons For The Skyrocketing Price Of Quant

One of the drivers for the hype seems to be the news of the last weeks. In particular, the global trend and call for Central Bank Digital Currencies (CBDCs) has garnered Quant extremely positive headlines.

Quant’s CEO Gilbert Verdian is extremely well-connected, as a pseudonymous Quant community member recently revealed. Thus, Verdian took a seat at the European Central Bank alongside the Central Bank of Italy, the Central Bank of Lithuania, and the London Stock Exchange.

Another driver of success for the Quant Network, founded in 2015, could be the demand for interoperability – to enable interaction between different public and private blockchains at the same time. For this reason, MIT is also working with the Quant Network to create blockchain interoperability at the scale of the Internet.

Speculation that the Quant Network, with its interoperability feature, would play a central role in the development of central bank digital currencies may have contributed to the rally in recent weeks, and triggered FOMO among some traders.

Moreover, Quant Network has recently made headlines for its work with the Bank of England on the digital pound, and just last weekend, executives attended SWIFT’s Sibos conference, which focused on digital payments.

In addition to Verdian, Quant also employs another very renowned personality. Guy Dietrich, former Managing Director at Rockefeller Capital, has already joined the Quant Network as a board member in 2019.

Dietrich was a managing director at Rockefeller Capital Management in New York until January 2021. He has more than 35 years of investment experience. Before joining Rockefeller, he led Morgan Stanley Smith Barney’s largest private wealth management practice in Silicon Valley.

On the flip side of the coin, according to Santiment, QNT’s rally is being accompanied by an outsized accumulation of coins by whale addresses holding QNT 100 and QNT 1,000. Whales have piled up QNT from 1.47 million to nearly 1.7 million in the past four months.

TOP 5 Cryptos To Watch This Week – BNB, BTC, ETH, QNT, LEO

In previous weeks, the crypto market looked like it was set to lose its key support with major altcoins such as Bitcoin (BTC), Ethereum (ETH), and other altcoins at the brick of losing their support area holding price sell-offs. Despite the uncertainty, some altcoins have continued to look green at the face of any litmus test. Let us discuss on top 5 cryptos you should pay attention to this week.

Disclaimer: The picks listed in this article should not be taken as investment advice. Always do your research and never invest more than what you can afford to lose.

Top 5 Cryptos- Bitcoin (BTC) Price Analysis On The Daily Chart
Daily BTC Price Chart | Source: BTCUSDT On Tradingview.com

Last week BTC saw its price decline from a region of $19,200 to $18,100 with what looked like a manipulation ahead of the Consumer Price Index news; BTC bounced from its key demand zone as price rallied to $19,600 before facing a rejection to break and hold above this region.

The price of BTC failed to close the weekly candle above $19,500, creating mixed feelings as regards its next movement and direction.

BTC is currently trading at $19,400; the price of BTC needs to break and close above $19,500 to ignite a possible price rally to a region of $20,200.

Top 5 Cryptos- Price Analysis Of Ethereum (ETH) On The Daily (1D) Chart
Daily ETH Price Chart | Source: ETHUSDT On Tradingview.com

The price of Ethereum in recent weeks had become a shadow of itself after the successful launch of the “Ethereum Merge” as the price had failed to show the bullish trend it had when price outperformed BTC in recent months, rallying from $1,000 to $2,024.

ETH price was rejected from $2,030 and has continued to trend lower. The price of ETH got rejected when the price attempted to flip $1,400; the price of ETH saw its price decline to a region of $1,270, acting as key support for the ETH price.

The price of ETH is trading below the 50 and 200 Exponential Moving Averages (EMA) on the daily timeframe.

If the ETH price maintains its bearish structure, we could see the price retesting $1,000 as the demand zone. The price of ETH needs to flip $1,400 into support for the price to look safe.

Price Analysis Of Binance Coin (BNB) On The Daily (1D) Chart
Daily BNB Price Chart | Source: BNBUSDT On Tradingview.com

The price of BNB was rejected from its resistance of $300 and is currently trading at $270.

BNB lost its bullish structure despite showing strength; the price of BNB got rejected to a low of $268 as the price bounced off to reclaim its support zone at $270. The price of BNB needs to rally high to a region of $280-$290 for the price to remain safe. 

The price of BNB trades at $272 below the 50 and 200 Exponential Moving Averages (EMA), the values of $280 and $300 act as resistance for BNB price.

Price Analysis Of Quant (QNT) On The Daily (1D) Chart
Daily QNT Price Chart | Source: QNTUSDT On Tradingview.com

The price of QNT has continued to show bullish trends holding well above the 50 and 200 EMA. The price saw a rally from $100, forming good support around that region.

Despite the pullback across crypto assets in the market, QNT has continued to look strong, respecting the bullish trendline.

The price of QNT broke the resistance at $200, enabling the price of QNT to rally. QNT’s price faces a resistance at $260; if the price breaks this resistance, we could see the price rallying to $330, but if it fails to break the resistance, $200 would be good support for QNT price. 

Price Analysis Of LEO On The Daily (1D) Chart
Daily LEO Price Chart | Source: LEOUSDT On Tradingview.com

The price of LEO recently looks bullish as price attempts to breakout above the 50 and 200 EMA, holding off the price from rallying. If the price of LEO holds above this region, we could see a price rally to $4.8

Featured image from Medium, Charts from TradingView.com

Quant Price Watch: Crypto Looking At 20% Rally This Week With This Pattern

Quant (QNT) may be one of the lesser known cryptocurrencies compared to Bitcoin, Ethereum, XRP, Cardano and Dogecoin, but is one of those digital assets that is set for a bullish rally over the next few days.

  • Quant’s notches 14.44% seven-day advance
  • The crypto is expected to rise by 20% due to its bullish momentum
  • QNT is outperforming a lot of altcoins after the September bearish market

At press time, tracking from Coincodex shows the crypto is changing hands at $153.63 and is enjoying a 14.44% increase for the past week.

The digital currency attained its all-time high on September 11, 2021 when it traded for $424.43 but has fallen victim into the expected volatility of the crypto space and at one point fell to $40.97.

But armed with resilience, the asset managed to recover and rise to $163.41 (its highest price after its all-time high) and is sitting at a bullish sentiment.

Quant Price Pattern Analysis

Under what is known as the head and shoulder pattern, Quant’s price is looking at an immediate bullish run, potentially once again outperforming other more popular and bigger cryptocurrencies.

Source: TradingView

The asset is coming from an impressive jump from its September value of $86, increasing by as much as 78% to trade at above $150.

There is an observed struggle for the crypto as it tests the $160 level. Bears are attempting to control inflation, contributing to this scenario.

If Quant is successful in breaking the $155 resistance marker, sideline traders will have the opportunity to enter, pushing the asset’s price by 20% all the way to $188.

At that point, said trading price will stand as its new resistance, the lowest of which could be the $160. Meanwhile, support levels for Quant currently stand between $141 and $130.

A Deeper Look At Quant As A Crypto

Quant market capitalization is currently at $1.84 billion. It ranks 32nd overall, 10th in the Ethereum (ERC20) tokens sector and 19th in Layer 1 assets.

During its Initial Coin Offering (ICO) that ended on April 30, 2018, the crypto was priced at $1.51. Since then, it has put together an impressive showing, increasing its value by 101.79% against the U.S. dollar.

Against cryptocurrency leaders Bitcoin and Ethereum, Quant increased its ICO price 48.69x and 51.52x, respectively.

The year 2021 was easily the best for the digital asset, as it recorded a mind-blowing 1,480.25% price increase, from $11.33 to $179. Meanwhile, the year 2019 was the worst for Quant, as it just managed to raise its value to $3.66.

Over the last five years, QNT averaged a yearly growth rate of 511.39%.

QNTUSD trading pair at $151.6 | Featured image from Finance Magnates, Chart: TradingView.com

QUANT Basks In Green As QNT Coin Surges 35% On 7-Day Rally

QUANT is making some positive noise, despite the bear market, with QNT notching gains in the last week.

Most cryptocurrency exchanges have made some decent profits recently, despite the beatdown form the broader crypto market.

Cryptocurrencies, meanwhile, have kept the charts green even while the stock market suffers from larger macroeconomic issues.

One of the tokens is QNT, which gained 35.77 percent, making it one of the top gainers of the past seven days. An improvement in the coin’s fortunes may be in the offing.

Market trust in cryptocurrency could be bolstered by the rise of Quant as the market recovers.

QUANT Recovers, Up 50%

Inflation data announced by the U.S. Federal Reserve on September 13 jolted global financial markets. Due to strong links between the S&P 500 index and Bitcoin, the stock market brought down the cryptocurrency market with it.

Back then, the QNT price had a hard time moving above the $112.12 barrier. As of September 13 and beyond, the crypto market as a whole plummeted, and QNT was no exception, instantly experiencing a decline.

At the same time, market uncertainty and skepticism made it difficult for bulls to drive the price of Ethereum and Bitcoin higher.

As of this writing, the token’s value has increased by about 50 percent since September 13. During this latest occurrence, the majority of coins merely enjoyed modest gains. But what do the current signs reveal?

Market Shifts Anticipated

Chart: TradingView.com

Currently, the Stoch RSI is in the hundreds. This indicates that the asset is grossly overbought and will have a price correction within the next few days . Currently, the CCI figures are also declining.

Due to Quant’s current price level, traders and investors may sell their QNT coins to profit from the recent market action. This price movement is supported by the range of $126.83.

If a correction occurs because Quant is overbought, we can see a decline to $122.18.

As of the time of writing, the price is positioned between the 50 Fib line and the 38.20 Fib level. The pricing is currently rather constant.

QNT’s function in the crypto realm is a significant factor in their robustness. Quant’s primary service consists of applications that allow different blockchains to communicate, enabling the transfer of coins.

In light of this, we may expect better news concerning Quant in the next days.

QNT total market cap at $1.62 billion on the daily chart | Source: TradingView.com

Featured image from Motivation Grid, Chart: TradingView.com

Quant (QNT) Registers Gains In Past Days – A Short-Term Upswing In Place?

On Saturday, the price of Quant (QNT) extricated from the seven-month-old falling wedge formation. With the continuing retest phase on Monday, buyers will verify the legitimacy of the breakout.

QNT is the native cryptocurrency of the Quant Network, a blockchain platform that facilitates the interoperability of blockchains.

Monday’s trade price for QNT is $75.71, a decrease of 10.2 percent over the last seven days, according to statistics from Coingecko. Therefore, if the price holds over $77.5, the altcoin could extend the current recovery.

Quant (QNT) has increased significantly over the previous week, signaling that a bottom may just be around the corner. The pace increased as purchasers drove the price above $67.

Moving averages have accomplished a bullish confluence, and the relative strength index is in the positive region, indicating a potential trend reversal.

Suggested Reading | Dogecoin (DOGE) Seen Jumping This Month, Despite Twitter-Musk Deal Collapse

Quant Barrels Past $75 Barrier

After nearly two months, a huge price increase pushed QNT past the $67 threshold. As QNT bulls forced their way forward, the coin’s price increased, passing the $75 barrier.

If bullish momentum sustains this week, the next important price levels to monitor will be $89 and $100. Near $90, the uptrend is encountering a formidable obstacle.

Meanwhile, volumes have grown over the last several sessions, resulting in an increase in volatility; therefore, investors should wait until the price resolves before placing transactions.

The sellers are seeking to halt the uptrend at $90, but the upward-sloping moving averages and strong relative strength index signals that the bulls have the edge.

QNT total market cap at $911 million on the daily chart | Source: TradingView.com
QNT Sees Short-Term Upswing

If the price of QNT recovers from the 20 exponential moving average, buyers could push the price back up to $90. A break and closing above this psychological barrier could indicate the restart of the short-term upswing.

In a falling pattern, the QNT/USDT pair displays its continued downward trend. For nearly seven months, the price of the coin fell within this pattern, denying a substantial bullish resurgence.

Suggested Reading | Solana Glints With 14% 3-Day Rally – Will SOL Keep On Beaming?

In addition, the bull cycle inside the pattern began on June 17, when the QNT price rallied from the trendline of support at its lowest point. As a result, the bullish surge boosted the market value to past $75.

Quant reached a record high of $427 on September 11, 2021 – a far cry from its current price of $75.71. The token’s price reached an all-time low of $0.215 on August 23, 2018.

Recent price activity for Quant has resulted in a market capitalization for the token that exceeds $1.8 billion. This year, QNT has experienced a change of -57.80 percent.

Featured image from Coinpedia, chart from TradingView.com

Terra (LUNA), Quant (QNT) Pull Up As Avalanche (AVAX) Nosedives

This week’s negative trend has favored Terra (LUNA) and Quant (QNT). The cryptocurrency markets are still in the red in the last few days, as prices continue their downward trend.

The good news is that some cryptos began to move in the right direction. Both Terra (LUNA) and Quant (QNT) were among the top gainers Tuesday, registering significant gains.

LUNA is now up 14.87% and trading at $57.30, making it the major stock with the highest gains. Its price has fluctuated between $49.51 and $57.40 in the last 24 hours.

The crypto is now ranked 9th among the most valuable cryptocurrencies on the market. The token’s market capitalization has increased by 14.44% to $22,139,669,470.

According to analysts, LUNA is expected to reach a market value of $300 by the end of the forecast year.

In contrast, Quant (QNT), which had its lowest price of $105.25 and its highest price of 128.98 on Monday, is up 12.96% Wednesday to $118.27, a gain of 12.96% over the previous day.

QNT has fluctuated between a low of $107.77 and a high of $119.52 during the last 24 hours.

Related Article | Can Shiba Inu Break Past The $1 Mark? Here’s How It Can

LUNA total market cap at $23.55 billion in the daily chart | Source: TradingView.com

QNT is presently the 63rd most valuable cryptocurrency in market capitalization out of the top 100 most valuable cryptocurrencies.

Recent market data predicts that the token price will rise to $515 by December 2030, which is higher than the projections made by traders at the time of publication.

Avalanche (AVAX) Suffers Massive Losses

Meanwhile, a consequence of the bearish market and negative news, including the conflict between Russia and Ukraine, have made investors jittery, resulting in a number of cryptocurrency tokens unable to sustain their value.

Avalanche (AVAX) is an example of a coin that has suffered a significant loss due to unfavorable market conditions.

On Tuesday, the price of AVAX plummeted to $75.00, representing a loss of more than 4%, making it the most seriously damaged token on the market.

AVAX is now trading at $79.43, marking a significant increase in value compared to its previous trading price on Tuesday.

Related Article | Shiba Inu Is Getting Ready For Another Big Run – Can It Hit $0.01?

The cryptocurrency has gained 12.87% in the last 24 hours and is now trading between $70.13 and $79.45, according to CoinMarketCap.

With a market capitalization of $19,503,725,52 and a fully diluted market capitalization of $31,429,838,359,

Avalanche (AVAX) has seen gains of 13.14% and 13.08%, respectively, since January of this year.

AVAX on Tuesday claimed the tenth most valuable cryptocurrency spot in terms of market capitalization.

According to Wallet Investor’s algorithmic forecast, the price of AVAX might even climb to $184.97 within a year and $659.55 within five years.

Featured image from CoinQuora, chart from TradingView.com