Bitcoin’s relative strength index has dropped well below 30 to its strongest oversold reading since March 2020.
Polygon (MATIC) Falls Under Bearish Pressure: Is It a Good Time To Invest?
Polygon Network is one of the top players in the blockchain industry. However, its native token MATIC has steadily declined in the last few weeks. This comes as no surprise as many other altcoins are also experiencing the same downward movement due to negative market sentiment.
But while the volatility of MATIC’s price can present profitable opportunities for traders, it can also pose a risk for inexperienced investors.
Current Market Sentiment For MATIC
In the past day and the previous seven days, MATIC has fallen 6.9% and 20.3%, respectively. According to an on-chain analytics platform, Santiment, millions of MATIC tokens were transferred between on-exchange addresses.
Related Reading: Check One, Two: Is Bitcoin Ready For A Mic Drop Rally?
These large whale transactions on the Polygon network might be fuelling the downtrend as it suggests that holders are selling off their MATIC tokens. At the time of writing, MATIC’s price is $0.8675, representing a 44.53% drop since February 18, 2023.
At the time of writing, the CFGI indicator also confirms the bearish sentiment around the MATIC price as its shows 38, indicating Fear among investors. This suggests that MATIC is in a phase where investors and traders are afraid to hold the asset. This may result in more dumps if the bulls remain stagnant.
Meanwhile, MATIC’s 24-hour trading volume is down by 15.38% to $375 million. A drop in daily trading volume shows fewer activities are on the network. However, MATIC still maintained its #9 position with its market cap of $8 billion on CoinMarketCap.
Polygon (MATIC) Price Analysis
MATIC is trading below both the 50-Day and 200-Day SMAs, indicating a bearish trend in the short and long term. Traders may utilize this current trend to sell or avoid MATIC until it recovers fully.
MATIC’s RSI reading of 22.99 suggests that MATIC is currently in the oversold zone. This also implies that the price of MATIC has rapidly declined and may be due for a possible retracement.
The Moving Average Convergence/Divergence (MACD) below the signal line confirms the bearish trend. This suggests that MATIC is currently in a downtrend movement. The histogram also is below zero, confirming the bearish momentum.
MATIC trades between the significant support and resistance levels at $0.7438 and $01.0306, respectively. The asset has already breakthrough the first primary support of $0.9335 and is heading strongly to the next support level.

With this strong bearish momentum, the bears might break the next support and eventually hit the last support of $0.51. However, if the bull could take back control, we might see MATIC hit the strong resistance level at $1.1900.
Featured image from Pixabay and chart from Tradingview
Cosmos (ATOM) Price Displays Intense Momentum – What’s Driving The Rally?
Cosmos (ATOM) demand has risen these past few days, resulting in a significant performance. According to CoinMarketCap data ATOM price has fallen to $11.69 after gaining momentum.
The current market cap of ATOM is $3.3 billion, with a 24-hour trading volume of $100 million. However, the trading volume is still down by 31.18%, indicating reduced network activity.
Reason Behind The Surge In Cosmos?
Cosmos is a constantly growing network of interconnected blockchains created with developer-friendly application components.
Inter-Blockchain Communication (IBC) protocol is the technology that connects these apps. The SDK platform Cosmos offers allows programmers to produce top-notch decentralized apps (dApps).
Other developers have also constructed applications on top of it, such as MM Finance and VVS Finance. Cosmo’s (ATOM) recent price surge could be attributed to its influx of developers topping that of Ethereum.
The other reason for the ATOM price increase might be the announcement from dYdX that it is building an independent blockchain on the Cosmos ecosystem instead of Ethereum.
Also, Bitcoin price soared above $29,000, pushing the market cap of all cryptocurrencies to surpass $1 trillion. Many crypto assets, including ATOM, recorded price growth due to correlation to BTC.
ATOM Price Action
Below is the technical analysis of ATOM price action on the 4-hour trading timeframe. And also the possible resistance and support zones.
Cosmos has broken through the short-term resistance level of $11.69 and is currently trading between $10.571 and $15.484 support and resistance levels. ATOM must break through the $15.484 primary resistance level to confirm the bullish momentum.

However, the bears are trying hard to break the $10.571 support level but couldn’t due to the high bullish momentum. If the bull’s strength is not strong enough to push ahead, the bears might take over the trend and cause a trend reversal.
What Do The Technical Aspects Suggest?
ATOM’s 50-Day SMA’s change in direction caused the market’s structure to change. If the bullish momentum doesn’t pick up, the trend may change to a potential bearish market.
The 50-Day SMA established a Death Cross by crossing below the 200-Day SMA, indicating a potentially bearish signal and suggesting a selling opportunity.
The Relative Strength Index (RSI) analysis indicator enables traders to determine the momentum and strength of the price movement of an asset within a period.
At the time of analysis, the RSI of ATOM/USDT is at 61.74 above the neutral zone. Therefore, this shows that ADA is neither in the overbought nor oversold zone. However, the buyers are building momentum to take ADA to the overbought zone while the seller pushes it down despite weak momentum.
Featured image from Forkast News and Chart: TradingView
Filecoin Price Struggles To Move, Will It Surpass The $6 Barrier?
The 30th largest cryptocurrency Filecoin (FIL) has recorded an increase in its 24-hour trading volume. This recent trend has attracted investors and traders closely monitoring its price movement. However, the coin struggles to break through the important $6 resistance.
The question now is, will Filecoin be able to break the $6 barrier? What’s the future potential of Filecoin? Notably, FIL trading volume surged significantly in 24 hours. This volume indicates increased network activity which might later push FIL price if the crypto market breaks from the current downtrend.
Filecoin Recorded Price Dips, What’s The Current Sentiment?
Filecoin is a peer-to-peer network created by Protocol Labs. Users pay storage miners to guarantee that their files are correctly and securely preserved over time. The Filecoin blockchain keeps track of transactions to verify file storage.
The cryptocurrency market is known for its volatility. Sudden swings in the value of digital assets occur frequently. Being a player in this market, Filecoin has seen increased selling momentum and downward movement.
Related Reading: MATIC Price Prediction: Polygon Recovery Faces Many Hurdles
FIL has experienced some significant drop in price over the past few days, affecting its overall market sentiment and current price movement. But with the Fear & Greed Index of 61 (Greed), the current sentiment is positive.
However, given that the price is in a zone where investors are likely to want to sell down, this suggests that there might be a potential price reversal.
The trend reversed due to a shift in direction in the 50-day simple moving average (SMA) on 17 April 2023, and this may continue if bullish momentum remains weak. The SMA indicator is frequently used to spot trends, resistance and support levels, and probable buy/sell signals.
By crossing below the 200-day SMA, the 50-day SMA has also formed a death cross, which might be a bearish signal and suggest a potential selling opportunity. The RSI is closely below the neutral zone, indicating the selling momentum is still high. However, the buyers are trying to build strength. Watch closely for a possible trend revisal.
Filecoin Key Support And Resistance Zones
On 23 April 2023, the Filecoin price dropped by 17.35%, making the coin fall to a support level of $5.117. The banking crisis’s impact on the financial market also affected the price movement of altcoins.
Related Reading: Polygon Exchange Supply Spikes, More Downtrend Incoming?
FIL could drop another 15%, reaching a month-long low of $4.79, if the panic persists and the altcoin breaches the crucial support level at $4.990.

Filecoin trades between support and resistance levels of $5.46 and $5.8. The first significant resistance level for FIL is $6.388. If the price moves above the current point, the coin will reach the next resistance levels, at $8.34 and $9.24.
Featured image from Pixabay and chart from Tradingview
Bitcoin Weekly RSI Reaches Line Between Bear & Bull Market
Bitcoin price continues to push higher, leaving very few pullback opportunities thus far for those that failed to buy below $20,000.
Price action on BTCUSD the weekly timeframe, according to the Relative Strength Index, has reached a critical line that separates bear market from bull market. Any higher, and crypto could experience a full blown breakout. Let’s take a look.
What The Relative Strength Tells Us About Cryptocurrencies
The Relative Strength Index is a popular technical indicator used in cryptocurrencies, originally created by J. Welles Wilder in the 1970s.
The tool measures momentum through the “velocity and magnitude of price movements,” according to Wikipedia. Readings above 70 can indicate overbought conditions, and falling below 30 suggests an oversold market.
In rare instances, the RSI will remain overheated depicting an especially powerful trend. Most of the time it remains somewhere between 30 and 70 while prices consolidate or move sideways.
On higher timeframes, moving past the middle-zone on the RSI can send lower timeframes through the roof — or through the floor.
In the case of BTCUSD weekly charts, the RSI suggests this exact line in the sand is currently separating what could be a full breakout into a bull market – or a harsh rejection.

Breaching this level on the RSI led to bullish rallies | BTCUSD on TradingView.com
Bitcoin Reaches Critical Line In The Sand Between Bear & Bull Market
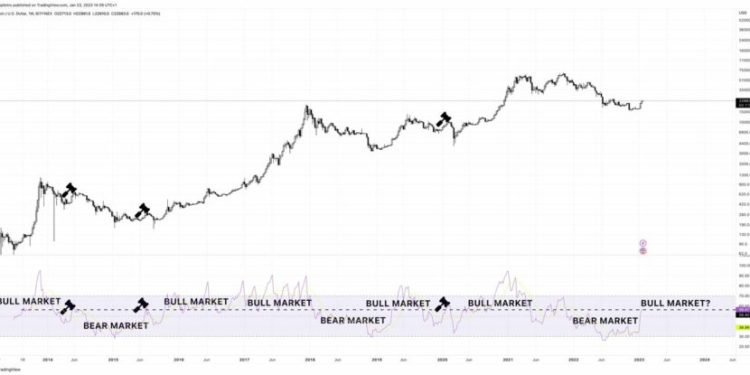
Looking back throughout the history of Bitcoin, pushing above roughly 55-56 on the RSI has in the past led to extraordinarily bullish moves. Falling below it lead to the the deadliest declines and bear markets.
Even worse, as BTCUSD weekly finds itself at the key trigger level, rejection has resulted in some brutal moves. In 2014 a rejection from there kicked off the second phase of the bear market. In 2015, a bull market attempt was harshly rejected back to bear market lows.
The latest instance in 2020 a bull market was rejected and combined with the onset of COVID, resulted in the Black Thursday collapse. Considering the importance of the level and the fact some of the worst rejections ever have taken place when the RSI reached such a reading, it is no surprise investors remain skeptical and cautious.
If Bitcoin can make it above the current zone on the Relative Strength Index, the bull market could be back on in a flash. Currently, BTCUSD daily charts show a wildly elevated RSI, well into overbought conditions. However, extended phases of daily RSI levels support bull market behavior, and could indicate that the weekly RSI and further higher timeframes might also approach overbought levels at some point in the future.
Beware of shorting #Bitcoin when the RSI is this elevated. pic.twitter.com/YHus8lR6dG
— Tony "The Bull" (@tonythebullBTC) January 17, 2023
Overbought Or Ready To Rip? Bitcoin Daily RSI Reaches Explosive Levels
Bitcoin price is showing signs of getting overheated on daily timeframes using the Relative Strength Index (RSI). The tool, typically used to spot overbought conditions, is at one of its highest levels ever historically.
However, an elevated RSI reading in BTCUSD is deceiving, leading to some of the most dramatic moves ever on the cryptocurrency’s price chart. Here is a closer look at what happens when Bitcoin price action gets this hot.
Bitcoin RSI Reaches Highest Level Since Early 2021
After breaching above $20,000, onlookers are wondering if a possible bottom is in for Bitcoin, but remain skeptical after such a long, arduous downtrend.
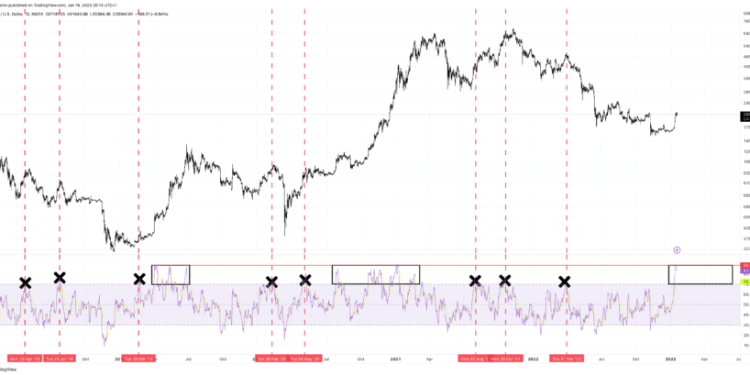
Bears have good reason to expect a pullback: Bitcoin has become extremely overbought according to the Relative Strength Index. In fact, the top cryptocurrency is more overbought than at any other point during the entire bear trend.
Bulls, on the other hand, could be ready to push prices higher. In the past, the RSI has only reached such an elevated level – a reading of 90 or above – during the most intense bullish movements of recent years.

Why Crypto Could Be Ready To Rip Higher Once Again
Bearish investors and traders might be quick to claim that this time is different, considering the Fed raising interest rates, the backdrop of war and recession, and more. But bulls have much more data on their side, and momentum at their backs.
In fact, bulls have the entire history of BTCUSD price action to prove that the Relative Strength Index reaching such highs have led to the greatest sustained gains in crypto.

Bull markets are characterized by recurring phases of extreme RSI readings. Bull markets also end at such extremes, but typically only after at least a series of three waves. Bear market peaks, throughout the entire lifetime of BTCUSD price action, always fail to reach such highly elevated RSI.
The Relative Strength Index was created by developed by J. Welles Wilder – who also developed the Parabolic SAR, Average Directional Index, and Average True. The technical tool measures the speed of the change of price movements.
Although readings above 70 and below 30 typically represent overbought or oversold conditions, a reading of 90 only occurs with an extremely fast and strong move. Such fast and strong moves tend to appear more often in a bull market than a bear market.
Cryptocurrencies can remain notoriously overbought during periods of FOMO. Is that exactly what we’ve seen in Bitcoin recently? And will the number one cryptocurrency by market cap rip higher, or ultimately see a rejection here due to such overbought conditions?
Bitcoin steps out of ‘Fear’ for the first time in nine months


The Bitcoin Fear and Greed Index reached an index score of 52 over the weekend, marking the first time its hit neutral territory in three quarters.
Brace For Impact? Bitcoin Open Interest RSI Forms Bearish Divergence

On-chain data shows the Bitcoin open interest RSI is currently forming a pattern that can lead to a short-term correction in the asset’s value.
Bitcoin Open Interest 14-Day RSI Has Been Climbing Up Recently
As pointed out by an analyst in a CryptoQuant post, a short-term bearish correction might soon take place for BTC. The “open interest” is an indicator that measures the total amount of Bitcoin futures contracts currently open on derivative exchanges. The metric takes into account both long and short contracts.
When the value of this metric goes up, it means investors are opening more contracts on derivative exchanges right now. Such a trend could result in higher volatility for the crypto’s price as it implies leverage is increasing in the market.
On the other hand, decreasing values suggest holders are getting liquidated or are closing down their futures contracts currently. Naturally, this could lead to a more stable price of BTC due to the lesser leverage.
Now, the relevant metric in the context of the current discussion isn’t the open interest itself, but its 14-day RSI. The Relative Strength Index (RSI) is a momentum oscillator that keeps track of the speed and direction of changes in any metric’s value over a specified period. The below chart shows the trend in the 14-day RSI of the Bitcoin open interest over the past year:
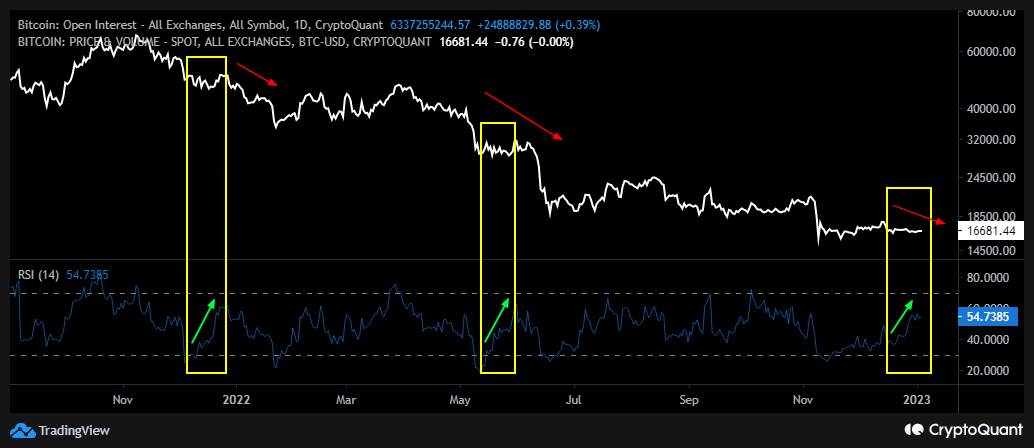
As you can see in the above graph, the quant has highlighted the relevant regions of the trend for the Bitcoin open interest RSI (14). It would appear that whenever the RSI has risen while the BTC price has been moving sideways or downwards, a bearish divergence has formed for the crypto, and its price has undergone a correction.
There have been other instances of a rising open interest RSI in the past year, but all those were accompanied by a rise in the price itself (and not consolidation or decline) so the same pattern never applied to them. Recently, however, the metric has been once again surging, and this time the price has been moving sideways at the same time, which means the bearish divergence as those earlier instances is now forming.
If the trend from the previous occurrences indeed repeats this time as well, then Bitcoin could soon see another short-term correction in its price.
BTC Price
At the time of writing, Bitcoin’s price floats around $16,800, up 1% in the last week.

Bitcoin Weekly RSI Sets Record For Most Oversold In History, What Comes Next?
Bitcoin price is in free fall and the cryptocurrency community is in panic. The high-risk, speculative asset class is living up to its notorious volatility and the selling appears unstoppable.
At some point, all assets become oversold and recovery begins. After the most recent selloff, BTCUSD weekly RSI has reached the most oversold level in the entire history of price action, including two bear market bottoms.
Bitcoin Selloff Sets Record For Most Oversold Weekly RSI Ever
Bitcoin price today tapped below $22,000 per coin and is rapidly approaching prices closer to the 2017 peak. Many altcoins, including Ethereum, have already pushed below the past bull market peak in an unprecedented move for the crypto market.
Panic is properly ensuing. The frantic attempt to cash out coins as fast as possible while there is still value left has prompted many top exchanges to halt withdrawals and better assess the situation. The selling pressure has also pushed the weekly Relative Strength Index to the most historically oversold level since Bitcoin started trading.
Related Reading | Bitcoin Drops To 18-Months Lows, Has The Market Seen The Worst Of It?
The Relative Strength Index is a commonly used momentum oscillator first developed by J. Welles Wilder Jr. in the 1970s. Wilder is also the creator of the Average True Range, Average Directional Index, and the Parabolic SAR. It is used to gauge when assets become overbought or oversold.
With BTCUSD historically oversold on weekly timeframes using the RSI, what exactly could this mean, and what might happen next?
BTCUSD weekly RSI is the most oversold ever | Source: BTCUSD on TradingView.com
Comparing The Current Crypto Collapse With Past Bear Market Bottoms
A visual inspection of the BTCUSD weekly chart instantly puts the RSI below the lower threshold of 30 at around the same level as two past bear market bottoms. Readings below the lower threshold of 30 are considered oversold. In contrast, readings over 70 are considered overbought.
More precise readings of the 2015 and 2018 bear market bottoms are 28.41 and 28.72, respectively. The current reading on BTCUSD is under 28, marking the lowest point ever on weekly timeframes.
Related Reading | Bitcoin Bear Market Comparison Says It Is Almost Time For Bull Season
Although this is a sign that in hindsight could pinpoint a significant bottom in crypto, because the RSI is momentum-based, downside could continue until the momentum has run its course. Price can also repeatedly test the area similar to how Bitcoin regularly displays readings of overbought price action throughout its history.
Buyers at these prices would want to look for an RSI swing rejection setup according Wilder’s methodology. Much like during past bear markets, the setup involves waiting for the RSI to reach oversold levels. The rest of the strategy involves watching for the RSI to return back above the threshold, and hold above the threshold during the next correction. After the RSI makes a higher high, a buy signal is generated.
Taking a position now does not mean it is safe | Source: BTCUSD on TradingView.com
Even then, bulls aren’t completely safe in their positions. If past bear markets are any indication of what to expect, there is a 50/50 chance of a double-bottom formation with a bullish RSI divergence.
In 2015, a second bear market bottom took place setting a slightly lower low after a full 200 days. The RSI made a higher low, signaling that the selling momentum was extremely weak relative to the movement of the price, and the most explosive bull run in history followed.
Was this the bottom sign that bulls were waiting for?
Follow @TonySpilotroBTC on Twitter or join the TonyTradesBTC Telegram for exclusive daily market insights and technical analysis education. Please note: Content is educational and should not be considered investment advice.
Featured image from iStockPhoto, Charts from TradingView.com
This key trading pattern hints at the continuation of Fantom’s (FTM) 125% rebound

A bullish inverse head and shoulders chart pattern suggests that FTM price could see extended upside.
Shiba Inu risks drop with SHIB’s 574% October’s price rally near exhaustion

Shiba Inu’s massive gains all across October may pare on potential bearish divergence signals and an overvalued relative strength index.
Ethereum fractal from 2017 that resulted in 7,000% gains for ETH appears again in 2021

The eerie deja vu scenario can see Ethereum hit $13,000 within six months if history repeats.
Avalanche (AVAX) in ‘overbought’ zone after 100% gains in a week — Correction ahead?

The AVAX/USD exchange rate slips more than 16% after testing its May 2021 resistance level.
XRP chart triggers sell-off warning after price explodes by 54% in one week

XRP price has bounced back from its July lows but some indicators are starting to suggest that the rally is due for a pullback.
Bitcoin Daily Close Pivotal To Save Dangerous RSI Breakdown
Bitcoin price is at an inflection point, with nearly every technical indicator mixed due to the weeks of sideways price action. By most standards, technicals slightly lean bearish, but crypto investors are hopeful the secular bull market remains intact.
Thus far, the bull market has held on by a string, or a thin line of support that’s been tested more times than we can count. The crucial support zone hasn’t yet been lost, but if the daily candle closes at current levels, a dangerous breakdown could follow.
Bitcoin Relative Strength Weakens, Begins Dangerous Breakdown
Bitcoin’s ever tightening trading range may soon finally break, according to the Relative Strength Index on daily timeframes. The strength measuring tool lets traders know when assets have reached oversold or overbought conditions and can provide early signals that a reversal could be coming.
The RSI can also form chart patterns and follow trend lines. Much like symmetrical triangles can form on price action, it also happens on technical indicators like the RSI.
Related Reading | Bitcoin Ready For Display Of Strength, But Which Direction Will It Break
Since the top started to form in Bitcoin earlier this year, the RSI has been making lower highs. At the same time, after the first low was put in following the 50% crash last quarter, a rising trend line has formed of higher lows.
However, Bitcoin is in the process of setting a new low, breaking down from the pattern, and potentially putting itself in a dangerous predicament.

Bitcoin begins breakdown from RSI triangle | Source: BTCUSD on TradingView.com
Deeper Plunge Depends On RSI At BTC Daily Close
The breakdown of the RSI is happening just as a support line that’s on thin ice looks ready to give way. The support line is the neckline of a massive head and shoulders pattern, which has a target of around $15,000.
The RSI readings are only added to the oscillator’s gauge after the daily close, so there’s still time today for bulls to save the market from a potentially dangerous plunge.
Related Reading | Bitcoin Trend Strength Indicator Suggests Bull Run Isn’t Yet Over
There’s still hope yet, even if Bitcoin price does make a new low. If for some reason the price of Bitcoin sets a new low, but the RSI doesn’t, a bullish divergence could form.
Falling to such levels could make the price per BTC attractive again and would lead to more substantial support. Today’s daily close is especially critical for Bitcoin, and could finally take the leading cryptocurrency by market cap out of this godforsaken range.
Follow @TonySpilotroBTC on Twitter or via the TonyTradesBTC Telegram. Content is educational and should not be considered investment advice.
Featured image from iStockPhoto, Charts from TradingView.com
Five Signs That The Bitcoin Bottom Is In
Bitcoin price was slashed in half during the month of May, leaving today as the last day for bulls to make a stand and undo the worst monthly on record.
Even if the blood stain is left behind on the price chart for good, that doesn’t mean bulls still can’t pull off an upset and push prices higher. Here are five signs that Bitcoin price has bottomed out, or will be soon.
The Signals Showing The Bitcoin Bottom Is Near
Just as extreme bullish sentiment and exuberance around mid-April was the local top of the 2021 rally so far, the current level could also act as the bottom now that sentiment has shift to the polar opposite.

A hidden bull div has formed on daily support | Source: BTCUSD on TradingView.com
Contrarian investors and traders suggest buying the fear or blood in the streets, but that’s still not the reason to think the bottom is in.
Related Reading | Building The Case That The Bitcoin Bottom Is In
Rather, technicals on nearly all timeframes point to a reversal in the making. The first ever cryptocurrency is forming a bullish divergence (above) while at daily support. The bounce happened once the Relative Strength Index hit oversold levels.

The logarithmic MACD shows momentum is turning upward | Source: BTCUSD on TradingView.com
The daily LMACD is also turning upward, showing that bulls are attempting to regain momentum on daily timeframes after a month of mayhem.
Moving up to a higher timeframe, Bitcoin price has also bounced at a rising trendline of RSI support on the three-day chart (below).

Bitcoin bounced off a high timeframe RSI support trend line | Source: BTCUSD on TradingView.com
But Wait, There’s More Reasons To Be Bullish On BTC
If that’s not enough to believe there’s a low-timeframe reversal in the making, on higher timeframes there’s still many more reasons to be bullish.
Related Reading | Don’t Have A Cow: Bart Simpson Is Back In Bitcoin
The rarely-looked-at two-week timeframe shows that Bitcoin fell to the middle-SMA on the Bollinger Bands. During the last bull market, the line was never lost. In fact, touching it resulted in the finally impulse upward.

The two-week middle-BB was retested only once during the last bull run | Source: BTCUSD on TradingView.com
The recent push down also caused Bitcoin’s most profitable buy signal to indicate “capitulation” in BTC miners. Past bull markets saw more than 8,000% and 3,500% after the last buy signal appeared per cycle.

The most profitable buy signal in crypto is about to trigger | Source: BTCUSD on TradingView.com
Nearly every time the signal appears, more upside is on the way. So why would this time be any different?
With so many signals stacking up, chances that the cryptocurrency is near the bottom are becoming more likely. Drawdowns post buy signal are still common, however, the potential reward has historically always outweighed the risk in terms of ROI versus loss.
Featured image from iStockPhoto, Charts from TradingView.com
The Bearish Signal Ethereum Bulls Need To Fear
Ethereum is above $4,000 and has hit a price level that’s nearly three full times the altcoin’s previous all-time high set years earlier. But could a full year’s worth of incredible profits and ROI be potentially leading bulls right off a cliff?
Several potentially bearish signals have appeared on Ethereum price charts that could suggest the bull market is nearing its conclusion, and that a deep retracement could follow.
Ethereum Reaches $4K Resolution As Bitcoin Goes Static
Just like Bitcoin, crypto investors have almost no interest in selling their ETH – only buying it. The recent “spot driven rally” as analysts are calling it, has taken the trending altcoin to as much as $4,200 per ETH at the high.
Gas fees broke records for revenue on that day, proving to the world that the Ethereum blockchain is financial powerhouse. DeFi is still booming, with billions worth of ETH locked, and the NFT trend has only really just taken hold.
Related Reading | Bitcoin And Ethereum Bleed 10% In Violent Crypto Market Shakeout
ETH 2.0 is in progress, and a scarcity improvement – EIP-1559 – will make the asset even more valuable to hold in the long term. It, and the recent recovery on the BTC trading pair, has prompted the return of “flippening” discussion.
What could possibly go wrong for the second-ranked crypto asset encroaching on Bitcoin’s throne?

This bearish divergence and Pi cycle "top" signal doesn't look good | Source: ETHUSD on TradingView.com
The Bearish Signals That Could Surprise Crypto Bulls, End Current Cycle
Unfortunately for bulls, Ethereum is exhibiting signs that resulted in the last bear market across crypto. On weekly timeframes, there’s a massive hidden bearish divergence, just as Ethereum brushes up against diagonal resistance.
Prior to the most recent push, Philip Swift’s “Pi Cycle Top” indicator used for Bitcoin peaks triggered – just as it did during the last bull market as it came to its conclusion.
Related Reading | Here’s Where The Ethereum Rally Could Pause, According To Bitcoin Blueprint
Bitcoin reversed first, and capital flowed into altcoins boosting the BTC trading pair ratio and beginning the talk of flippening. Now, the same sort of talk is back, and once again it is alt season and the top crypto by market cap has paused its rally.

A TD "sell" setup has marked the peak of most major rallies in Ether | Source: ETHUSD on TradingView.com
Making matters worse, there’s also a TD sell setup on the weekly timeframe, which yet again was a near-flawless top sign both in 2018 and again in mid-2019.
If Bitcoin takes a dive here, and sends the ETHBTC trading pair back to former highs, the coincidences could be too many to ignore. Bulls might have had their final push in both Bitcoin and Ethereum, and what comes next is a bear phase no one is expecting
Featured image from iStockPhoto, Charts from TradingView.com
Bitcoin can hit $92K in April and still not match bull run RSI peaks: Analyst

More proof that Bitcoin is far from the most vertical stage of its bull run comes from PlanB and the relative strength index.


