The price of Bitcoin has continued to move within a consolidation range since hitting a new all-time high in mid-March. This sluggish price action has been a source of worry to most investors, especially when the premier cryptocurrency recently lost its support at the $60,000 level.
Interestingly, price is not the only Bitcoin metric that has cooled off since the first quarter of the year. Data analytics firm Santiment has revealed that on-chain activity on the Bitcoin network has also slowed down over the past few months.
How Historically Low On-Chain Activity Affects BTC Price
In a new post on the X platform, Santiment revealed that on-chain activity on the Bitcoin network is approaching historic lows. This revelation is based on the noticeable downtrend in various metrics, notably transaction volume, daily active addresses, and whale transaction count.
According to the blockchain intelligence platform, investors have been transacting less with BTC since the premier cryptocurrency hit a new all-time high price. As a result, Bitcoin’s on-chain activity has dropped to its lowest level since 2019.
Breaking down the metrics, Santiment found that transaction volume on the pioneer blockchain is falling to its lowest in the past decade. The data analytics firm defines transaction volume as a metric that tracks the total amount of coins transacted for a given asset within a timeframe.
What’s more, Santiment mentioned in its report that the number of daily active addresses, which measures the number of distinct addresses that participated in a BTC transaction on any given day, has reached its lowest point since January 2019.
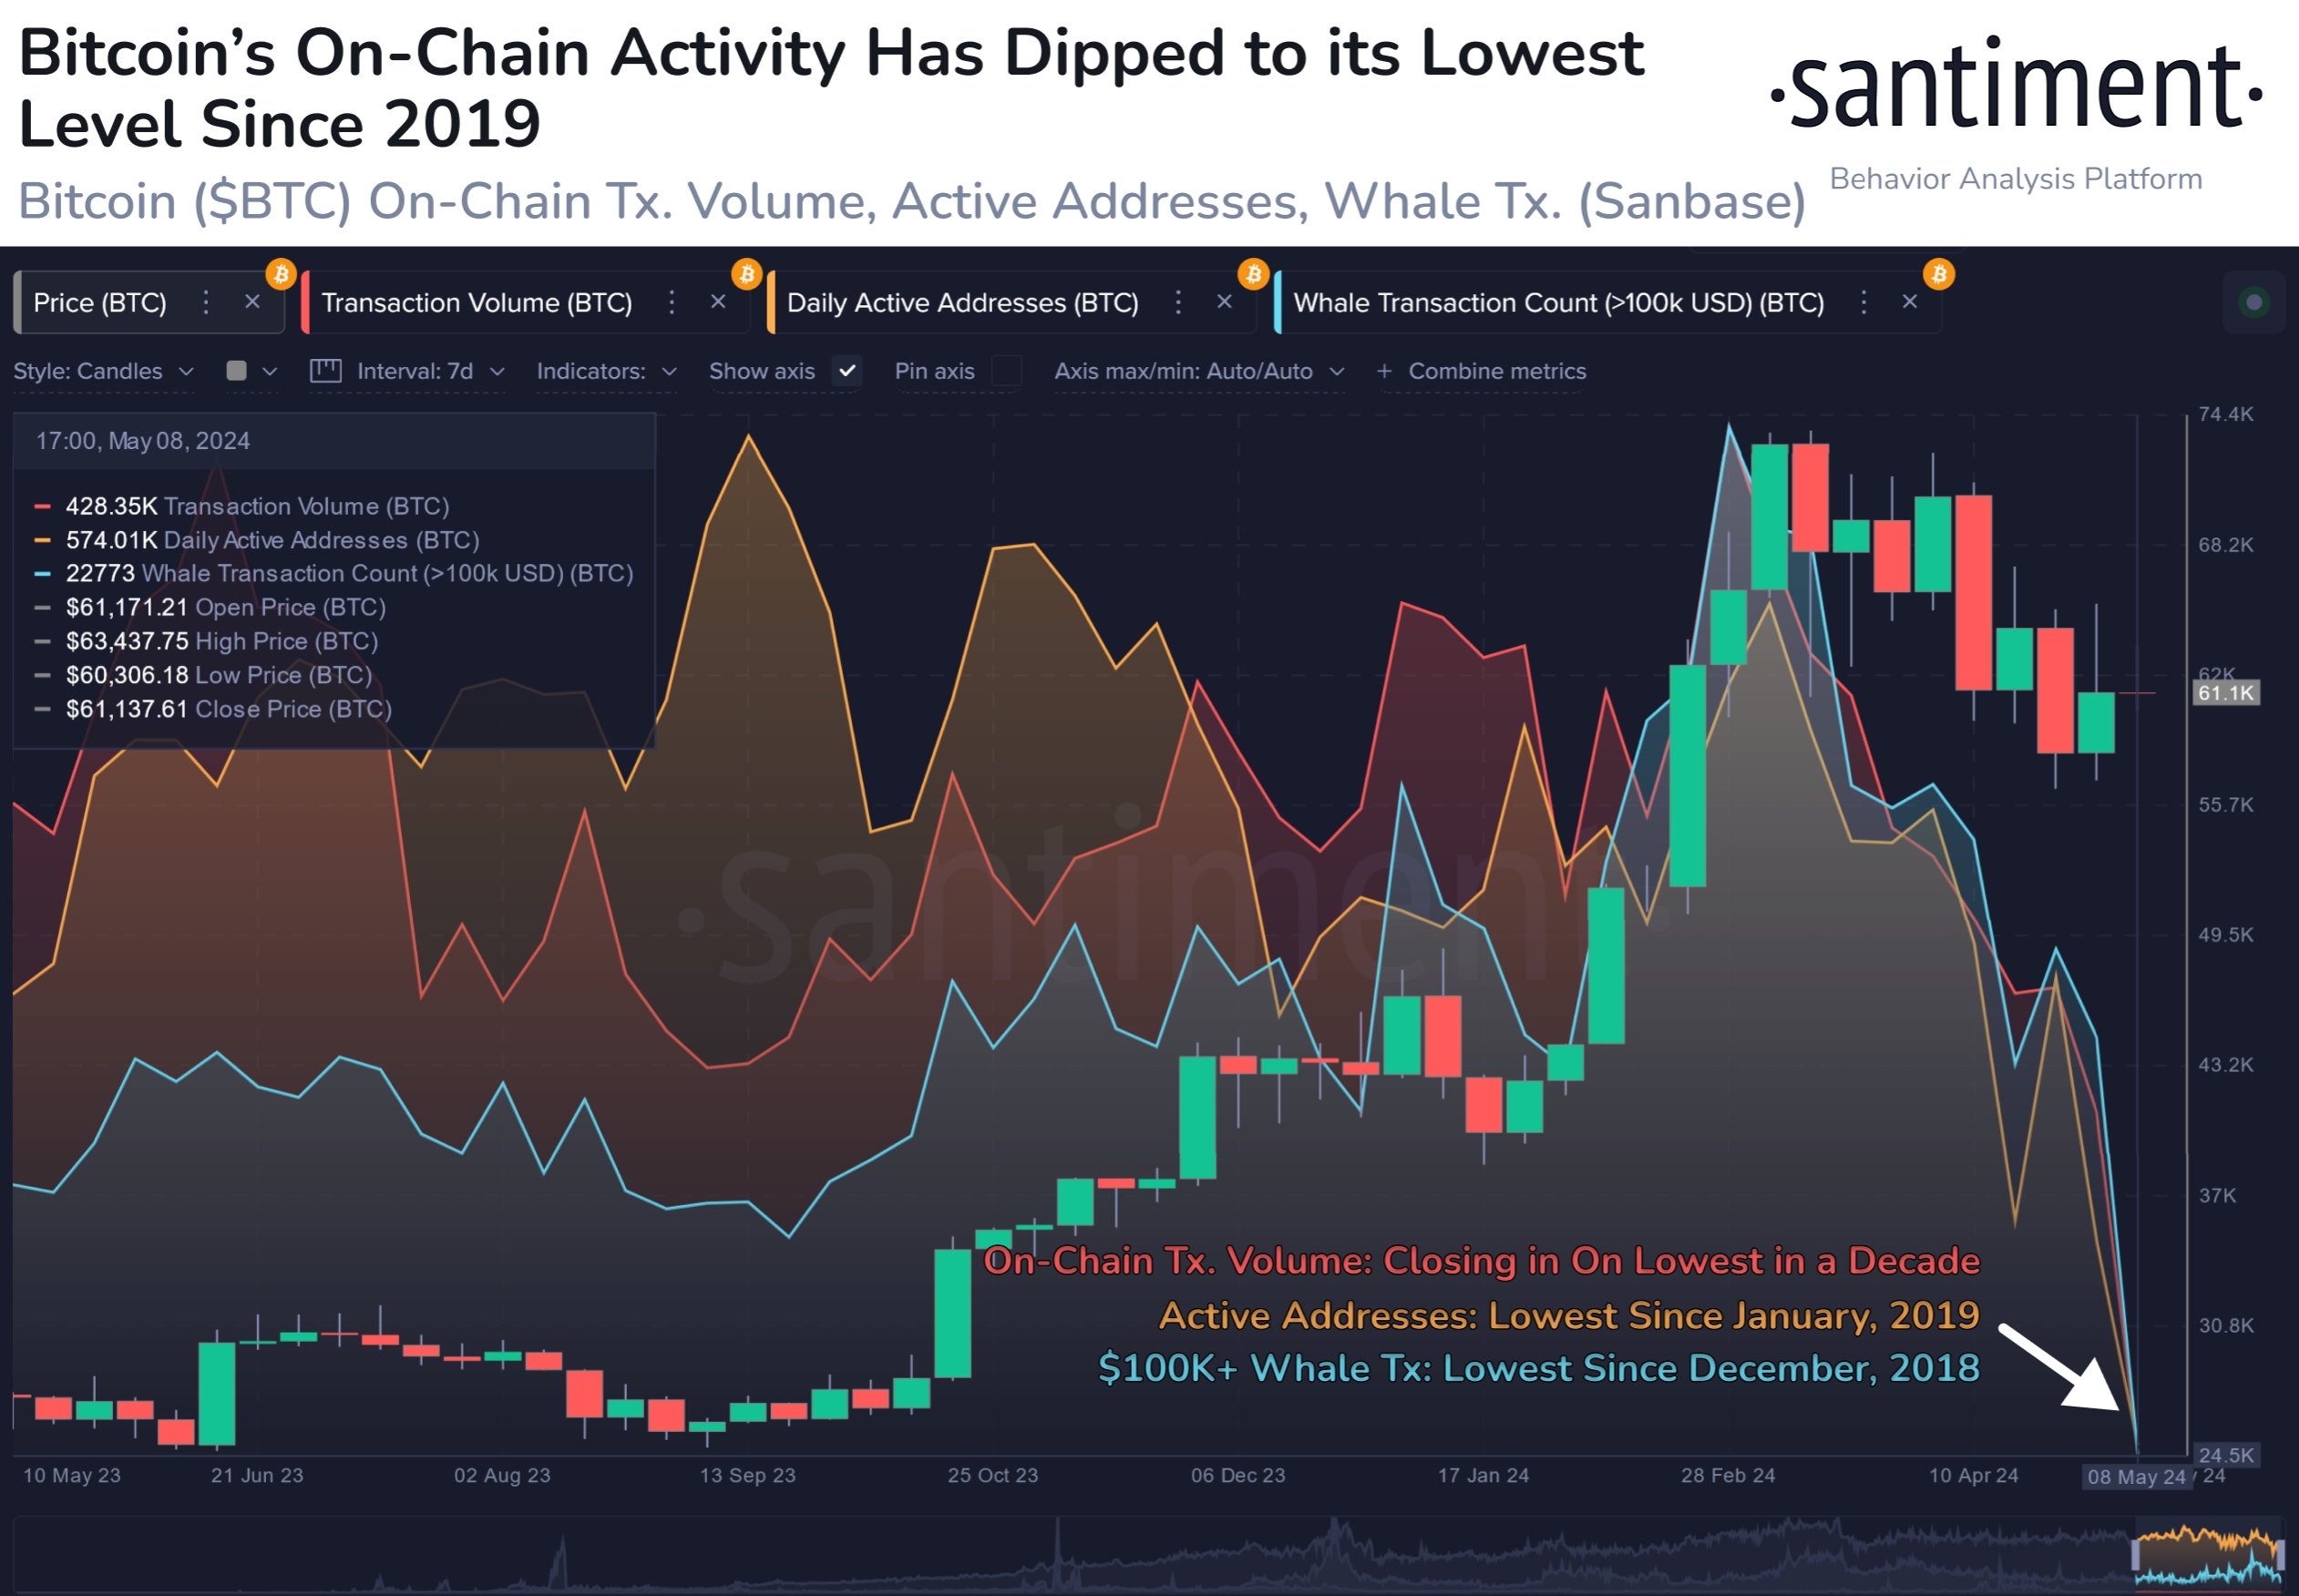
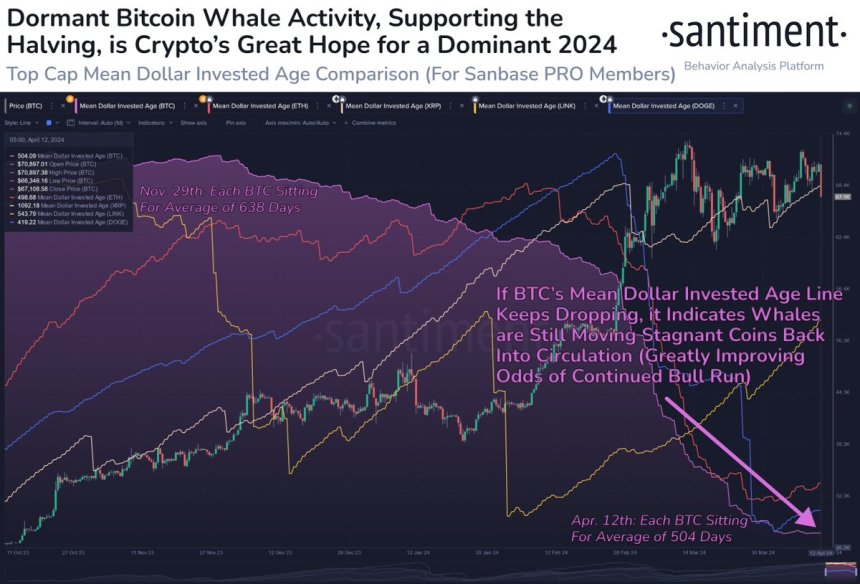
The blockchain intelligence platform also revealed that whale activity has slowed down on the Bitcoin network. The number of whale transactions (greater than $100,000) has fallen to the lowest point since the end of 2018, according to Santiment’s data.
On the surface, the decline in on-chain activity seems like a worrying trend and a symptom of an unstable market health. Santiment, however, noted that this dip might not necessarily be associated with imminent BTC price dips – as seen in the past weeks.
The analytics company said that the decline in on-chain activity is more indicative of “crowd fear and indecision” amongst traders. Ultimately, this underscores the connection between the on-chain activity and sentiment in the Bitcoin market.
Bitcoin Price At A Glance
According to data from CoinGecko, the price of Bitcoin sits just above $60,770, with a mere 0.2% price dip in the past day.
 The total amount of non-empty
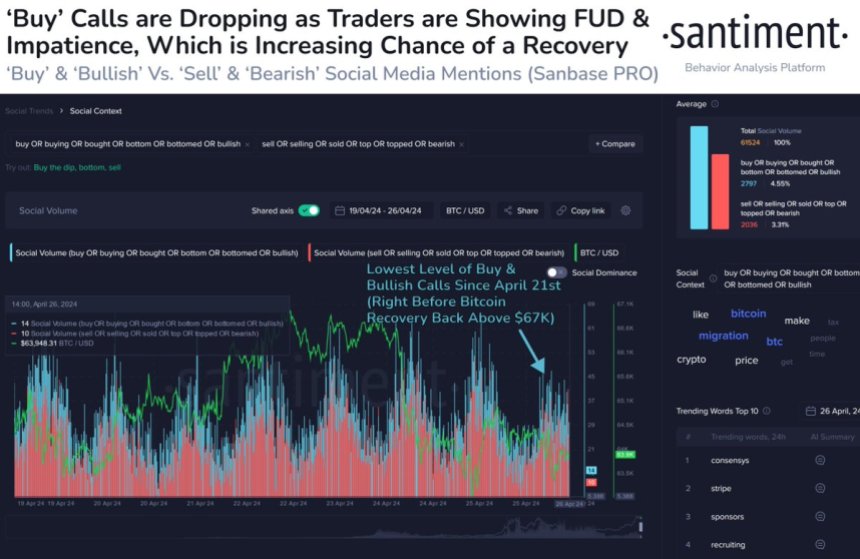


 Following

 However, if

 As the
  10-10K


