AGIX Sustains Momentum Above 100-Day Moving Average – Rally Imminent?

AGIX is one of the leading AI tokens in the crypto space with a total supply of 2 billion, and a total trading volume of over $105 million, which is over 11% down in the last 24 hours.

For over two days, the price of AGIX has been holding strong above the 100-day Simple Moving Average (SMA). The token which has been on a downward ally for quite some days, is showing some signs of price reversal and if this happens a change of direction might occur and the price of AGIX will start a new movement upward.

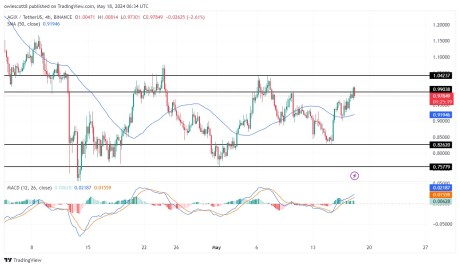
As of the time of writing, AGIX was trading around $0.98817 above the 100-day simple moving average, about 1.68% up in the last 24 hours. Currently, there are two main resistance levels of $0.99038 and $1.04237 and two main support levels of $0.82620 and $0.75779, respectively.

Technical Indicators Suggest Upward Rally For AGIX

4-Hour MACD: A technical look at the MACD indicator from the 4-hour timeframe, the MACD histograms are trending above the zero line, and both the MACD line and the Signal line have crossed and are trending above the MACD zero line, indicating a bullish trend. This can be seen in the below image.
AGIX

4-Hour RSI: The formation of the Relative Strength Index (RSI) in the above image also suggests that the price of AGIX is bullish as the RSI signal line is seen trending above the 50% level. This indicates that buyers are active in the market therefore overpowering the strength of sellers.

Alligator Indicator on the 4-hour timeframe: A look at the alligator indicator from the 4-hour time frame shows that the price is trading above the alligator lines as the alligator lip and teeth have both successfully crossed above the alligator jaw, suggesting that the price might continue to move in an upward direction.

AGIX

Support And Resistance Levels To Break

Conclusively, the price of AGIX is currently trading around the $0.99038 resistance level and if it manages to break above this level, AGIX’s price will continue to move further toward the $1.04237 resistance level and if it breaks above this level, an upward trend might begin. 

However, should the price of AGIX fail to break these resistance levels, it will reverse and start a downward movement toward its previous support level of $0.82620. If it manages to break below this support level, the price might move further to test the $0.75779 support level.
AGIX

Dogecoin Successfully Breaks Out Above $0.153, What Next?

Bulls in Dogecoin (DOGE) seem to have stepped up their game as the daily price chart of the biggest meme coin in the world is trending positively, fueling speculations about an impending rally. Kevin Capital, a cryptocurrency market expert and enthusiast has offered insights on DOGE’s price action, confirming an effective break out for the crypto asset, as it surpasses the $0.153 resistance level.

Dogecoin Surpasses the $0.153 Resistance

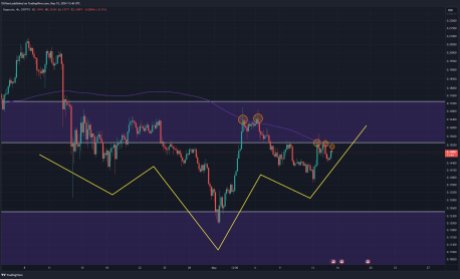
It is noteworthy that the crypto analyst Kevin previously predicted that for Dogecoin to move higher it needs to break above the $0.153 level and the 200 Simple Moving Average (SMA) in the 4-hour timeframe. “When it comes to Dogecoin all DOGE needs to do to have a higher chance of playing out the potential inverse head and shoulders is a break above the 4-hour 200 SMA and the $0.153 level,” he stated.

At the time, Kevin noted that DOGE has repeatedly tried to reach this moving average and has been turned down. Thus, should the crypto asset break out of and maintain this moving average, he expects an upswing to the $0.22 price level.

Dogecoin

According to the analyst, the development has successfully manifested today, as the digital asset has surpassed the $0.153 level and the 200 moving average. Given Kevin’s prognosis, Dogecoin will have to sustain this area to see a further upsurge.

If DOGE manages to hold during any prospective backtest and thereafter, Kevin has placed his inverted head and shoulders target at $0.18 and $0.22, if it is within reach.

The post read:

Update on the Dogecoin chart. We have officially broken above the $0.153 level and the 200 SMA on the 4HR. We need to hold this area on any potential backtest and then .18 cents and the inverse head and shoulders target of $0.22 cents if right in reach.

This accomplishment coincides with a spike in the meme coin market’s favorable sentiment, which indicates increased investor trust and interest in these digital assets. With breakouts and decouplings occurring all over the place over the past few days, meme coins had an eye-catching start to the week.

Several Support Levels For DOGE And Their Significance

Dogecoin’s recent price upswing has triggered an optimistic outlook from multiple crypto experts. Another analyst who has shared a positive prediction for the meme coin is Crypto Daily Trade Signals.

Crypto Daily Trade Signals has delved into the current support levels for DOGE and the potential price trajectory following a breakout. According to the channel, the 50-day EMA at $0.1652 is serving as a resistance level at the moment. Should DOGE break past this barrier, it could trigger the start of a bull run for the coin.

Furthermore, the channel noted that the 100-day EMA around $0.1434 is presently offering support, indicating that DOGE has a cushion against additional drops. Meanwhile, the 200-day EMA is acting as a strong long-term support level at $0.1237.

During the time of writing, Dogecoin was demonstrating an upward momentum of over 6% in the past week, trading at $0.1549. Its trading volume and market cap have both increased by over 11% and 3% respectively in the past day.

Dogecoin

Avalanche (AVAX) Price Dips As Market Turbulence Persists

AVAX is the native utility token of the Avalanche blockchain. The token is currently ranked 12th by market cap, with a total supply of 440,043,419 AVAX and a total trading volume of over $396,250,098 in the last 24 hours. Since its recent pullback at $36.15, AVAX has continued to move downward.

Currently, the general cryptocurrency market is bearish. This has led to the price of AVAX dropping below the 100-day Simple Moving Average (SMA) and the price might continue to drop in the next couple of days. As of the time of writing, the price of AVAX was trading around $33.52 and about 0.22% down in the last 24 hours.

Technical Indicators Point Toward A Sustained Downtrend For AVAX

To figure out where the AVAX price might be headed next, the following indicators can be used to examine the chart.

4-Day MACD: A technical look at the MACD indicator from the 4-hour timeframe, the MACD histograms are trending below the zero line, and both the MACD line and the Signal line crossed each other while trending below the MACD zero line, indicating a continuous movement on the downside. This can be seen in the below image.

AVAX

4-Day RSI: The formation of the Relative Strength Index (RSI) in the above image also suggests a downward continuation movement as the RSI signal line is seen to have moved above the 50% level and then dropped below it. This suggests that sellers are still very much active in the market therefore overpowering the strength of buyers.

Alligator Indicator: A look at the alligator indicator from the 4-hour time frame shows that AVAX is trading below the alligator lines as the alligator lip and teeth have both successfully crossed above the alligator jaw. It can also be seen that the price tried to move above the alligator lines but failed to do so, suggesting that the price might continue to move in its downward direction.

AVAX

The Coin Could Form A New Low

Conclusively, from the previous downward movement, AVAX has formed two resistance levels of $39.94 and $36.15 and a support level of $30.34. Currently, AVAX is moving toward this support level and if it breaks above this level, the price might drop even further to create a new low. 

On the contrary, if the price fails to break above this support, it will reverse and start an upward movement toward its previous resistance level of $36.15. Should AVAX manage to break above this resistance level, the price might move further to test the $39.94 resistance level.

AVAX

Bitcoin Drops Below 4-Hour MA – Bearish Trend Ahead?

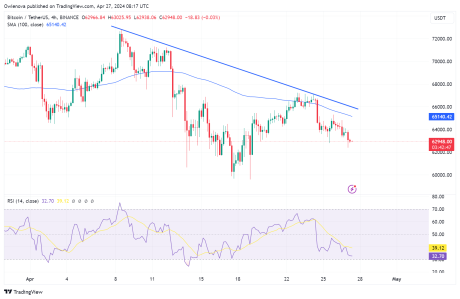
Following a pullback, the price of Bitcoin has continued on its downward movement. The coin, after failing to break above the 100-day Simple Moving Average (SMA) and the trend line has experienced a drop of over 6% from its previous high.

Will the price of BTC continue to move in a downward direction or will it reverse and start moving in an upward direction?

As of the time of writing, the price of BTC was trading around $62,972 which is about 28% down from its all-time high and was down by 1.27% in the last 24 hours. Although the price is trading below the 100 SMA on the 4-hour chart, on the daily chart it is still trading above the 100 SMA.

Current Condition Of Indicators And What They Suggest

Looking at the chart, technically a support level and a resistance level of $59,653 and  $67,255 were formed respectively. However, there could be more support and resistance levels created if the price continues to move downward.

Bitcoin

4-Hour Moving Average: A technical observation of the chart from the 4-hour timeframe as seen in the image below reveals that the price is trending below the 100-day moving average. This suggests that the price is on a downtrend and could potentially move further downward.

4-Hour RSI indicator: The Relative Strength Index (RSI) indicator here suggests a downward trend as the RSI signal has crossed and is trending below the 50% line as observed on the above chart.

Bitcoin

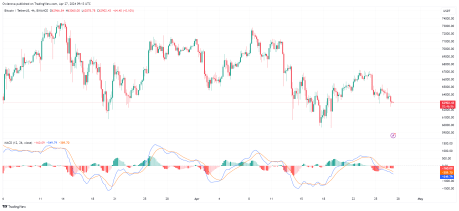
The MACD indicator from the 4-hour chart also suggests that the price might continue to move downward as the MACD histograms are trending below the zero line. Both the MACD line and the Signal line have crossed and are trending below the MACD zero line, indicating a bearish trend, as seen in the above image.

Possible Outcome

With the setup of the above indicators, it can be suggested that the price of Bitcoin is still bearish and that there are possibilities that it could still move further downward.

If Bitcoin continues downward and breaks below the support level of $59,653, it could witness a deep correction to create a new support level. However, if the price fails to break below this support level, it could start an upward correctional movement towards its previous level of $67,255 and if it manages to break above this level, the price will begin an uptrend.

Bitcoin

BNB Resilience: Holding Firm At $560 – What’s Next?

The price of BNB hasn’t fallen below its previous low, and it’s showing some strong signs of heading up. After a spell of moving downward, the Binance Smart Chain’s native token is aiming for an upward bounce back towards its earlier high.

Technical Indicators Point Toward Sustained Uptrend For BNB

To figure out where the BNB price might be headed next, several indicators can be used to examine the chart:

BNB

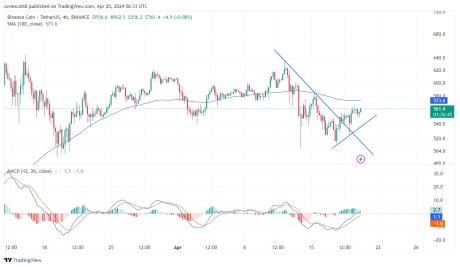
4-Hour MACD: A technical look at the MACD indicator from the 4-hour timeframe, the MACD histograms are trending above the zero line, and both the MACD line and the Signal line have crossed and are heading towards the MACD zero line, indicating a bullish trend. This can be seen in the above image.

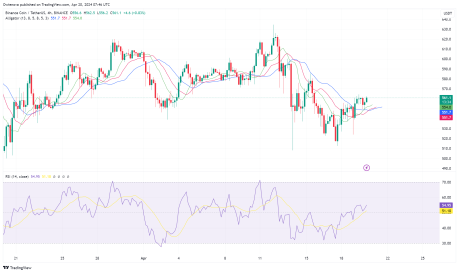
RSI 4-hour Timeframe: The formation of the Relative Strength Index (RSI) in the below image also suggests an upward movement as the RSI signal line is seen trending above the 50% level. This indicates that buyers are still very active in the market therefore overpowering the strength of sellers.

4-hour alligator: A look at the alligator indicator from the 4-hour time frame shows that BNB is trading above the alligator lines as the alligator lip and teeth have both successfully crossed above the alligator jaw, suggesting that the price might be starting a new rally.

BNB

At the time of writing, the price of BNB was up by 1.35% and was trading around $561 in the last 24 hours. BNB price is showing bullish signs and also forming a base above the $508.1 support level. Also, the price is trading above the bearish trend line and below the 100 Simple Moving Average (SMA) on the 4-hour chart.

Final Thoughts

From the previous downward movement, the price of BNB has managed to create one major resistance level of $635 and one major support level of $508. Currently, BNB is moving toward this resistance level and if it breaks above this level, the price might go even further to create a new high. 

On the other hand, if the price fails to break above this major resistance, it will reverse and start a downward movement toward its previous support and if it manages to break below this support level, the price might move further downward thereby starting a new downward trend.

BNB

Analyst Predicts Bitcoin Rally To $45,000 Before Pullback

Bitcoin (BTC) has started riding the recent bull market wave and rising with fresh gains after weeks of sluggish momentum, with crypto analysts predicting more potential gains for the leading cryptocurrency asset in the coming days.

Bitcoin To See A Correction After Surging To $45,000

A cryptocurrency expert from Cheeky Crypto has made a daring forecast for Bitcoin. The analyst revealed his recent projections during one of Cheeky Crypto’s latest episodes on YouTube.

His predictions came in light of the price of Bitcoin closing Wednesday on a positive note, leading the altcoin market as a whole with it. As the new trading day began, BTC’s price broke above the consolidation, signaling that bulls have returned to the fore.

Cheeky Crypto analyst’s latest analysis delves into the present trading range for Bitcoin. In the analysis, the expert talked about a potential surge to the upside that will take BTC to $45,000. 

Bitcoin

He defined the current stage as a continuation pattern and forecasted that after the range is done, there will be an upward breakout. The analyst mentioned that volume profiles have been declining throughout the market’s range, which gave him the belief that the price will increase to $45,000.

However, he believes a notable correction will occur after BTC reaches the aforementioned price level. Meanwhile, given the positioning on the Stochastic Relative Strength Index (RSI), he anticipates a further decline to $30,000.

He underscored that there is resistance at the 50 Exponential Moving Average (EMA) and support at the 50 Simple Moving Average (SMA) for BTC’s present trading range. If the 50 EMA is breached, Bitcoin may test the 50 EMA once again, and the 200 EMA would provide extra support.

Furthermore, the analyst looked at a series of indications throughout the hourly, daily, and weekly time periods. He noted key levels of support, resistance, and indicators to inspect for prospective market changes and momentum, like the RSI and the stochastic RSI.

BTC’s Price Surges Above $44,000, Eyes $45,000

Amid the recent bullish rally encompassing the crypto market, Bitcoin’s price has risen over $44,000. This marks the first time this month that the crypto asset has reached this level, suggesting market recovery.

The recent surge has sent quite a positive sentiment in the entire crypto space. It is believed that the rise might be due to the anticipation around the Ethereum Spot ETFs and BTC ETF options. Although, in comparison to last month, trend levels are still low, indicating that one should stay vigilant. 

As of the time of writing, the price of Bitcoin has increased by over 4% in the past 24 hours, trading at $44,704. In addition, its market cap and trading volume have increased by over 4% and 47% in the past day.

Bitcoin