AGIX is one of the leading AI tokens in the crypto space with a total supply of 2 billion, and a total trading volume of over $105 million, which is over 11% down in the last 24 hours.
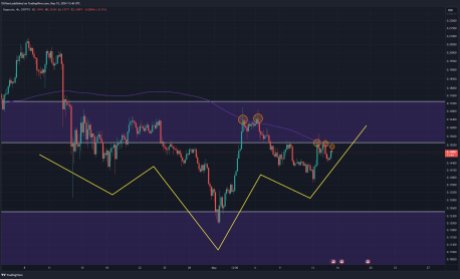
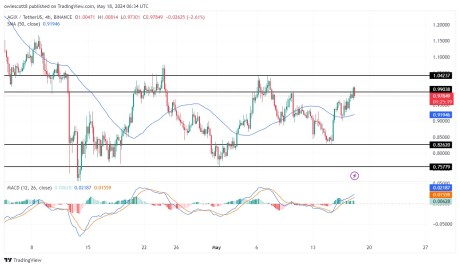
For over two days, the price of AGIX has been holding strong above the 100-day Simple Moving Average (SMA). The token which has been on a downward ally for quite some days, is showing some signs of price reversal and if this happens a change of direction might occur and the price of AGIX will start a new movement upward.
As of the time of writing, AGIX was trading around $0.98817 above the 100-day simple moving average, about 1.68% up in the last 24 hours. Currently, there are two main resistance levels of $0.99038 and $1.04237 and two main support levels of $0.82620 and $0.75779, respectively.
Technical Indicators Suggest Upward Rally For AGIX
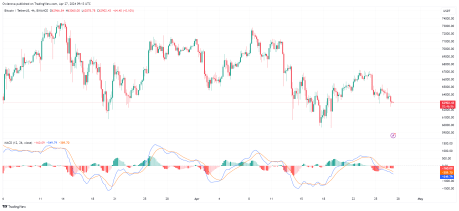
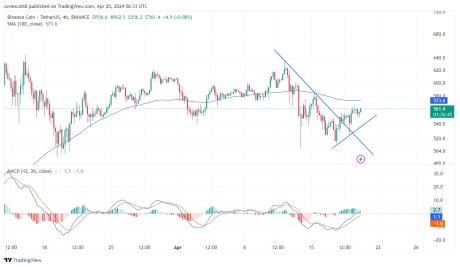
4-Hour MACD: A technical look at the MACD indicator from the 4-hour timeframe, the MACD histograms are trending above the zero line, and both the MACD line and the Signal line have crossed and are trending above the MACD zero line, indicating a bullish trend. This can be seen in the below image.
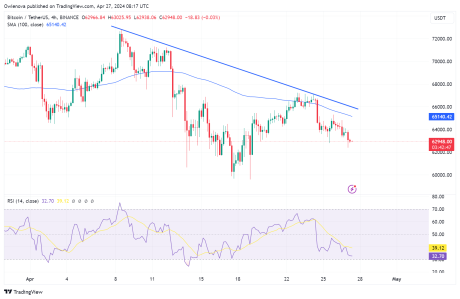
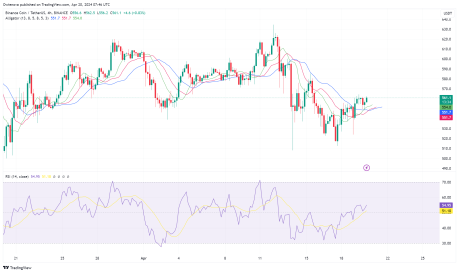
4-Hour RSI: The formation of the Relative Strength Index (RSI) in the above image also suggests that the price of AGIX is bullish as the RSI signal line is seen trending above the 50% level. This indicates that buyers are active in the market therefore overpowering the strength of sellers.
Alligator Indicator on the 4-hour timeframe: A look at the alligator indicator from the 4-hour time frame shows that the price is trading above the alligator lines as the alligator lip and teeth have both successfully crossed above the alligator jaw, suggesting that the price might continue to move in an upward direction.

Support And Resistance Levels To Break
Conclusively, the price of AGIX is currently trading around the $0.99038 resistance level and if it manages to break above this level, AGIX’s price will continue to move further toward the $1.04237 resistance level and if it breaks above this level, an upward trend might begin.
However, should the price of AGIX fail to break these resistance levels, it will reverse and start a downward movement toward its previous support level of $0.82620. If it manages to break below this support level, the price might move further to test the $0.75779 support level.