Solana Whale Makes Massive 1,000,000 SOL Deposit To Binance, Bearish Sign?

On-chain data shows a Solana whale has just moved a massive SOL stack to Binance, which could prove to be bearish for the asset’s price.

Solana Whale Has Deposited 1 Million SOL To Binance Today

According to data from the cryptocurrency transaction tracker service Whale Alert, several large SOL transactions have occurred on the blockchain during the past day.

More specifically, six massive transfers have been spotted on the network. Out of these, two transactions were gigantic, with tokens worth $362 million and $498 million involved.

These extraordinary transfers, though, were both between unknown wallets. Addresses like these are those unattached to any known centralized exchange, so they are usually the users’ personal, self-custodial wallets.

Due to this, transfers between unknown wallets are generally hard to say anything about. Often, they can be as simple as the investor moving to a fresh wallet, which is naturally of no particular consequence for the wider market.

The other four whale transactions from the past day, however, did involve central entities on one end, so speculation around them can have a bit more ground to stand on.

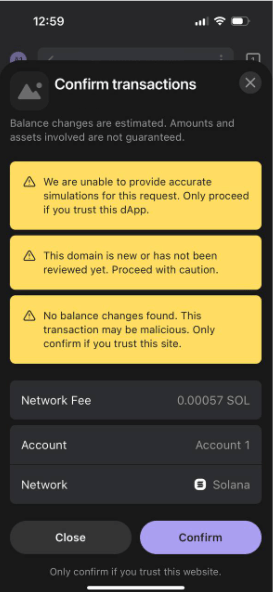
Out of these four, one transaction in particular stands out. In this move, a whale shifted 1 million SOL on the network, worth more than $166 million at the transfer time. Below are some additional details regarding this transfer.

Solana Whale Inflow

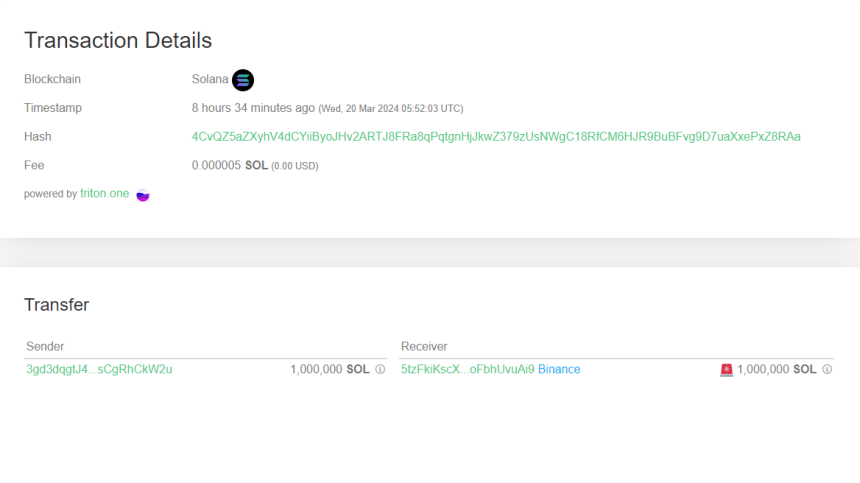
As is visible, the receiver in the case of this transaction was a wallet affiliated with the cryptocurrency exchange Binance, implying that the whale transferred coins from their address to the platform.

Such transactions are known as exchange inflows. Users make these transfers when they want to use one of the exchange services, which can include selling.

As such, exchange inflows may sometimes be bearish for the cryptocurrency. In particular, massive inflows made by the whales can exert some visible fluctuations on the market.

Just like this huge SOL transfer, the other three transactions mentioned before were also exchange inflows. They were significantly smaller in scale, though, with their average value being $33.2 million.

Two of these transactions also went to Binance, while the third (and the latest) headed to Coinbase. Interestingly, the address pairs in these two Binance transfers were the same, hinting that the same whale may have been responsible for them.

With the four exchange inflows, Solana, worth $265.6 million, has now found its way to exchanges. This is clearly a notable amount, so it may impact the asset’s price.

There is no guarantee, however, that any of the whales involved made these transactions for selling; it’s possible that they made the moves for some other purpose that’s not directly relevant to the market.

Although Solana has been sliding off over the past few days, the possibility of these whales deciding to exit certainly exists.
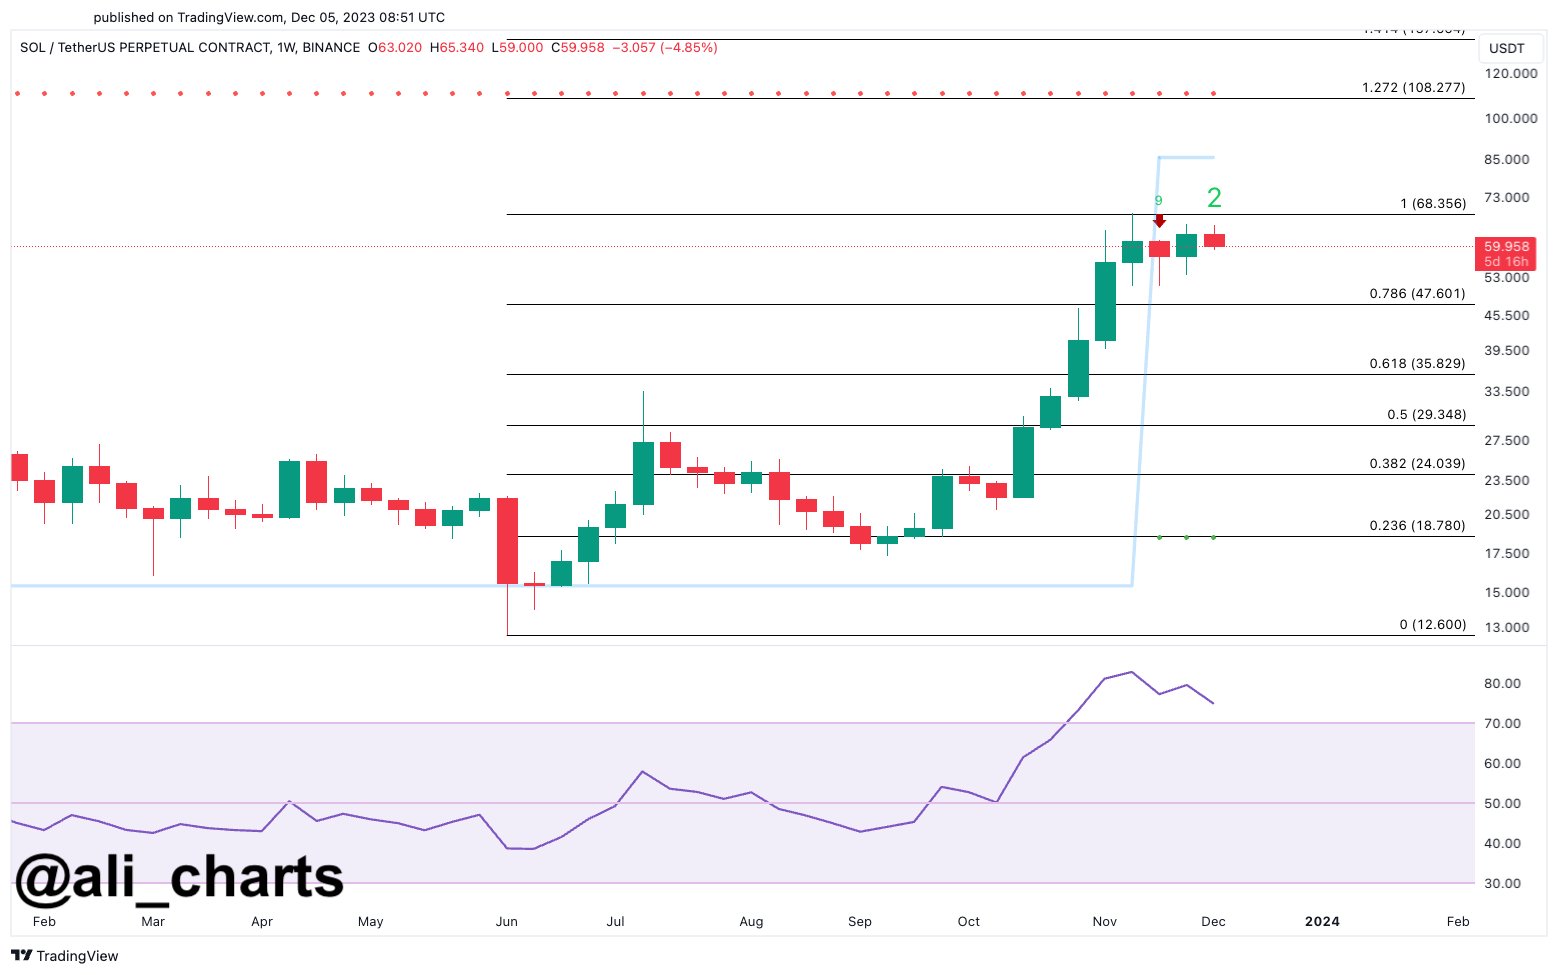
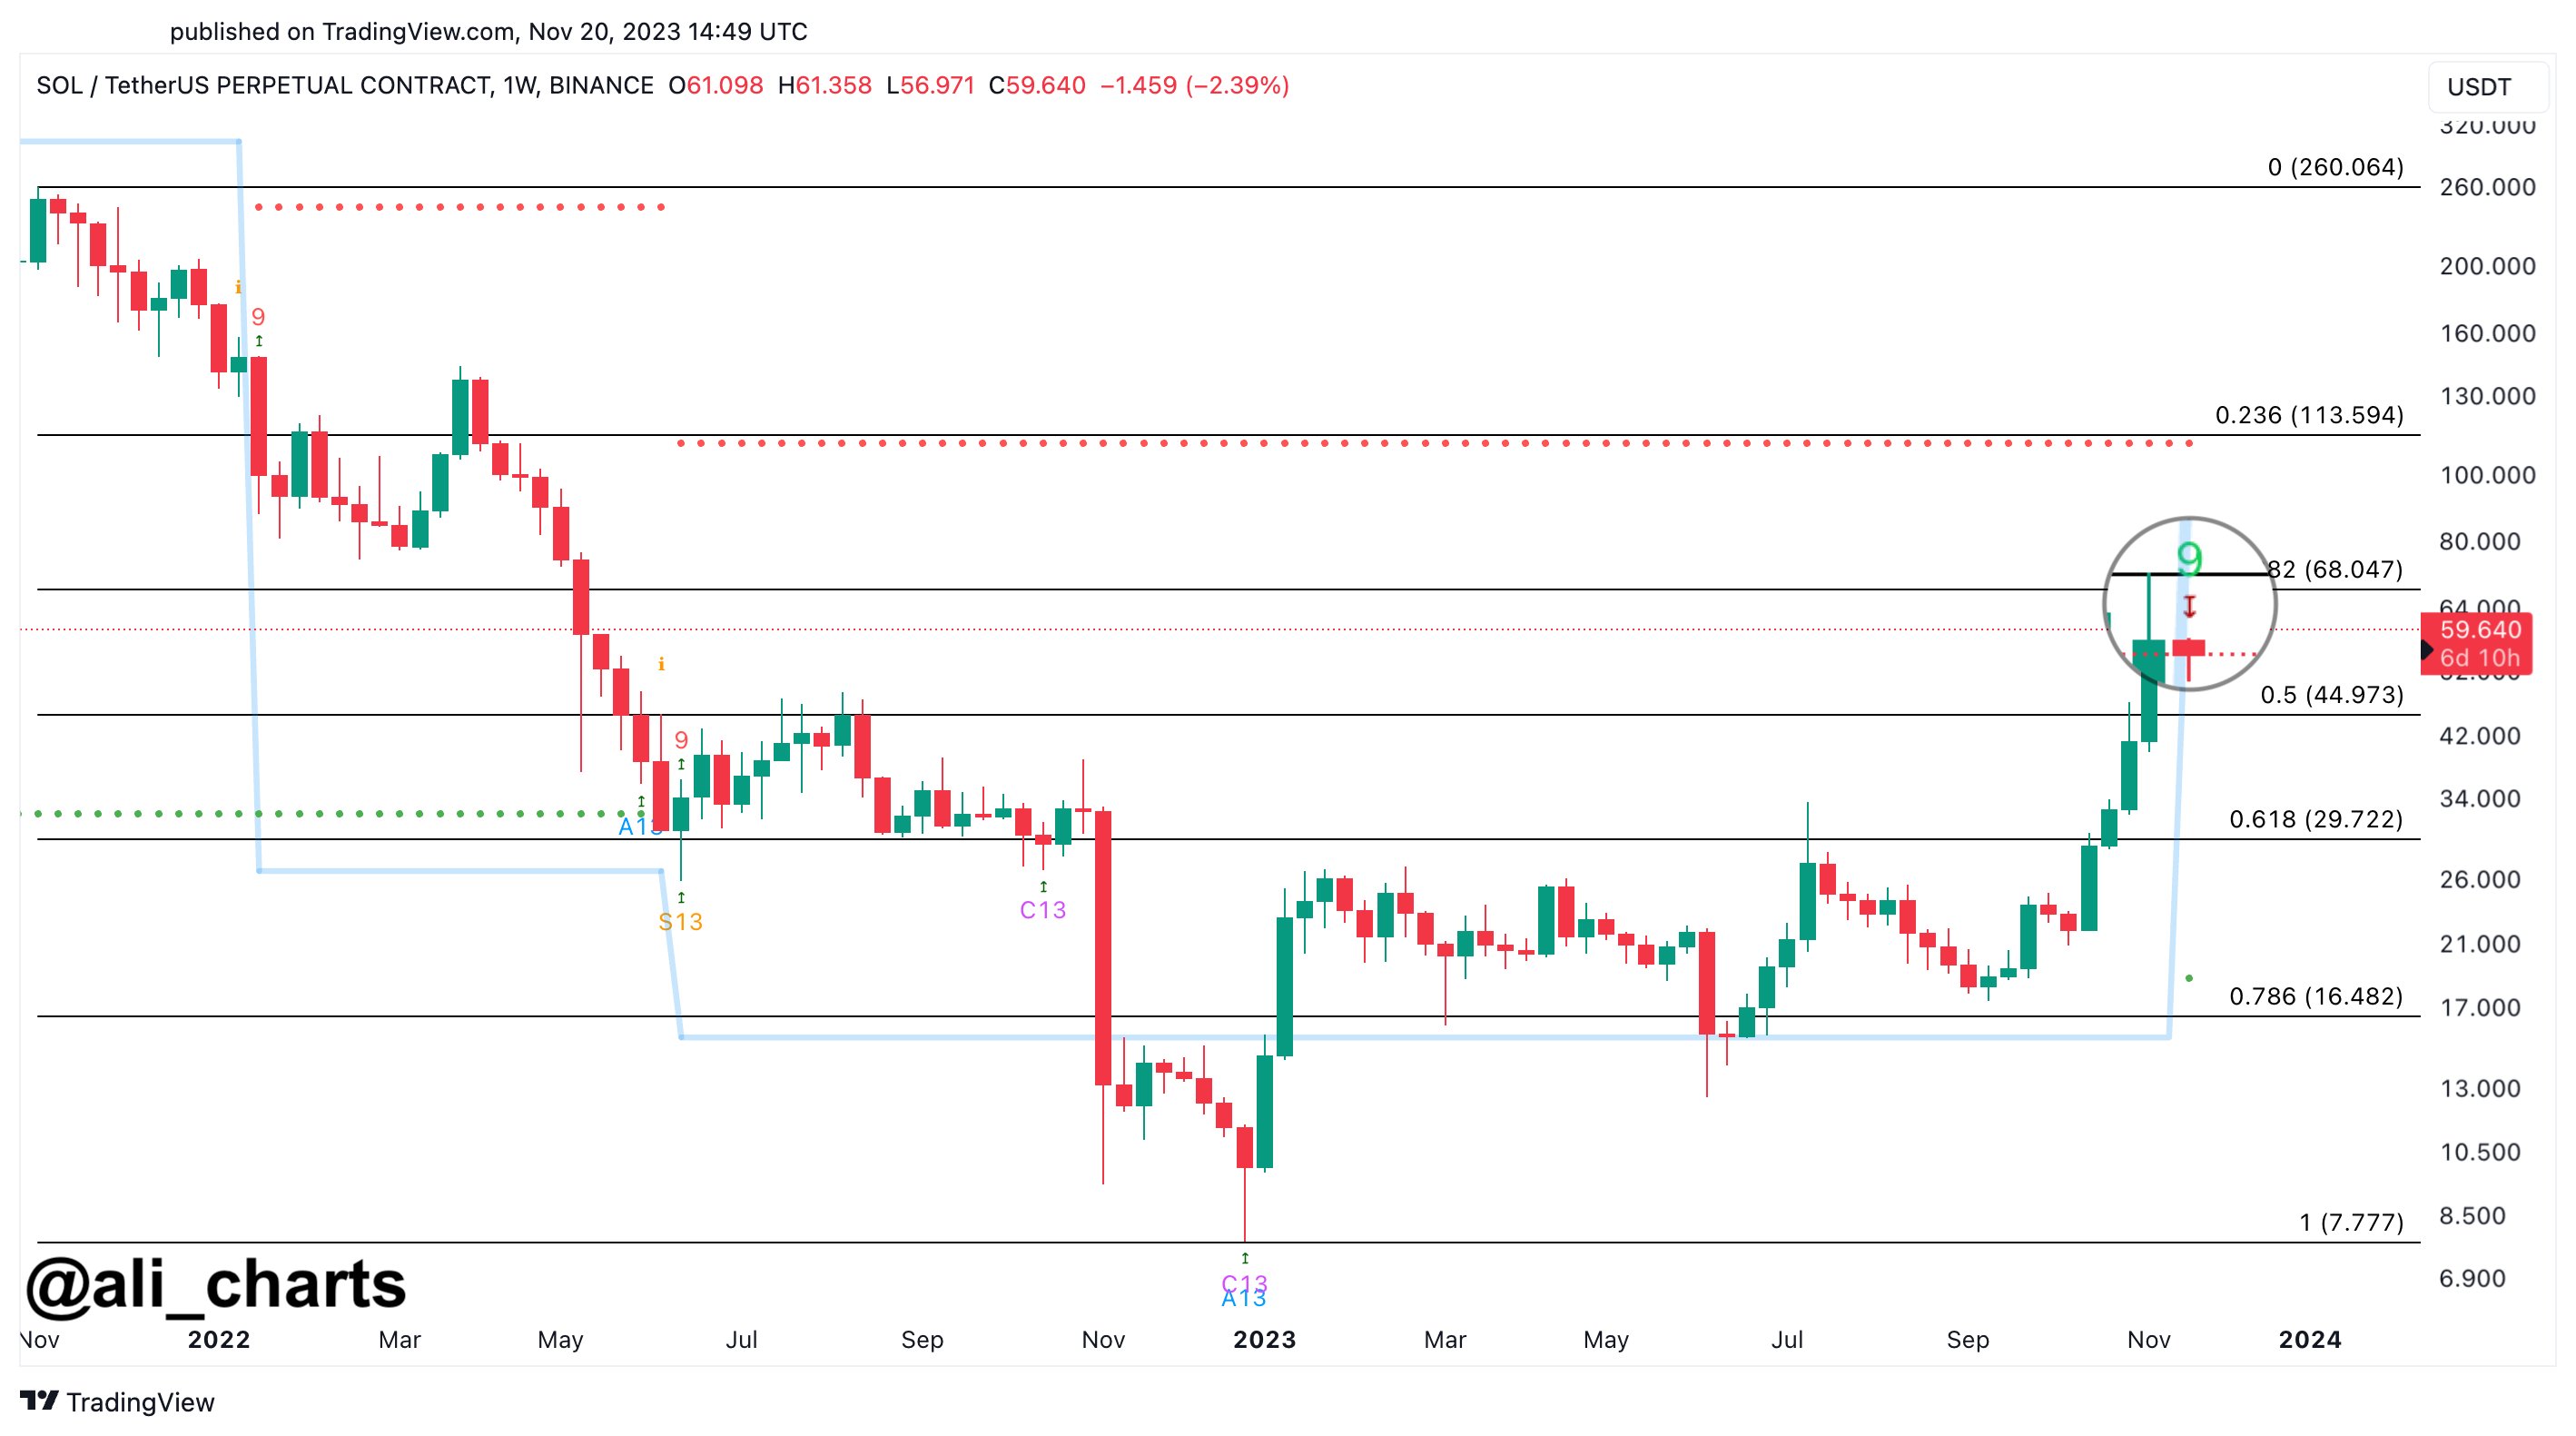
SOL Price

Following the recent drawdown Solana has seen, the asset’s price has come down to the $174 level.

Solana Price Chart

XRP, SOL Among Coins With Red Sentiment, Time To Buy Against Crowd?

Data shows various cryptocurrencies like XRP and Solana are currently witnessing bearish majority sentiment on social media platforms.

XRP, SOL, And Other Assets Are Sharing A Red Mentality Currently

According to data from the analytics firm Santiment, a notable bearish sentiment has emerged among cryptocurrency traders during the past week. The relevant indicator is the “Weighted Sentiment,” based on two other metrics: the Sentiment Balance and Social Volume.

The Sentiment Balance keeps track of the net sentiment present among users on the major social media platforms. The metric calculates this score by reviewing social media posts and applying a machine-learning model to filter for positive and negative sentiments.

Once the indicator has found the scores for these bullish and bearish sentiments, it takes their difference to give the average or net sentiment present among the traders.

The other relevance metric here, the Social Volume, tells us about the amount of discussion related to any topic or term on social media platforms.

The Weighted Sentiment takes the Sentiment Balance and then weighs it against this Social Volume. This means that the indicator’s value only spikes (in either direction) when not only is there some notable imbalance present in the market (that is, the net sentiment has a significant value), but the volume of social media discussion about these sentiments is also high.

This fact makes the Weighted Sentiment more reliable than the Sentiment Balance, as it can provide a better picture of the trend among the traders as a whole (since the Social Volume would only spike when there are many users involved in discussions).

Now, here is a chart that shows the trend in the Weighted Sentiment for six different cryptocurrencies: Bitcoin (BTC), Ethereum (ETH), BNB (BNB), XRP (XRP), Cardano (ADA), and Solana (SOL).

XRP, Solana Sentiment

As displayed in the above graph, these assets have had a negative Weighted Sentiment recently, suggesting that bearish sentiment has dominated social media users. More specifically, the indicator is around -0.36 for XRP, while it’s about -0.64 for Solana.

Historically, cryptocurrency markets have been more likely to move in the direction opposite to what the crowd is expecting. As such, price rebounds become more probable the more negative the sentiment gets, while tops can occur when the traders share a highly bullish mentality.

Followers of contrarian investing exploit this to time their buying and selling moves. Warren Buffet’s famous quote sums up this idea, “be fearful when others are greedy, and greedy when others are fearful.”

Given the red sentiment XRP and others are witnessing, a contrarian trader might think it is the right time to buy into these cryptocurrencies.

XRP Price

XRP had attempted recovery earlier, but the move appears to have failed as the asset has returned under the $0.50 level.

XRP Price Chart

Solana Users Face Mounting Threat As Drainer Attacks Surge, SOL Price Plummets 13%

As the price of Solana (SOL) has skyrocketed by an astounding 722% year-to-date, the network’s rapid growth has attracted both attention and challenges. 

Not only has the native token gained significant value, but the use of Solana-based meme coins such as Bonk Inu (BONK), which has grown over 854% year-to-date, and decentralized applications (dApps) have skyrocketed. Unfortunately, this increased popularity has led to increased attacks against the so-called “Ethereum Killer.”

Malicious Solana dApps Exploited

Web3 security firm Blockaid has recently observed a concerning trend of users falling victim to attacks by Solana-based drainers. 

One notable example is the website lessfeesndgas[.]org, which succeeded in stealing tokens from the Solana Program Library (SPL), which is designed to support the creation and management of tokens on Solana and SOL worth hundreds of thousands of dollars.

Interestingly, according to the company’s post on X (formerly Twitter), Blockaid’s secure wallets remained immune to these attacks from the moment the site went live, preventing any connections from being made.

Solana

The sophistication of these drainers is noteworthy, according to the firm, as they can fool the simulations used by Solana wallets, causing users to sign malicious transactions unknowingly. Web3 security firm Blockaid further stated:

As Solana continues to gain popularity, drainer groups are increasingly moving towards it, as indicated by the growing number of malicious Solana dApps detected by Blockaid.

Solana’s rapid ascent as a high-performance blockchain platform has drawn admiration and scrutiny. Its ability to process transactions quickly and at a lower cost than Ethereum has positioned it as a strong competitor. 

However, the network’s success has also made it an attractive target for malicious actors seeking to exploit vulnerabilities and capitalize on its growing user base.

Still, this is not the only bad news for Solana in the past few hours, as its native token has been experiencing a continuous sharp drop in price, leading to the belief that its uptrend and bull run may be over despite the possibility of a rebound in the overall crypto market.

Stablecoin Surge And NFT Sales Fail To Prevent SOL’s Price Drop

In just five hours, the price of SOL experienced a significant 13% drop, hitting a low of $85 on Wednesday. This decline occurred despite notable growth in stablecoin transfers, which saw a rise of over 45% this week. 

Solana

Additionally, on Tuesday, SOL surpassed Ethereum in monthly trading volume for non-fungible token (NFT) sales, marking a milestone for the network.

SOL is the fifth-largest cryptocurrency, boasting a market capitalization of $42.6 billion. It holds a $12 billion lead over XRP and trails just behind Binance Coin (BNB) by a mere $6 billion.

The trajectory of SOL’s price remains uncertain as investors await signs of a potential bullish momentum resurgence.

Building a more secure framework for decentralized applications (dApps) could be pivotal in restoring investor confidence and attracting additional capital to the ecosystem, potentially propelling SOL to reclaim its one-year high of $126, previously achieved on December 25.

Solana

Featured image from Shutterstock, chart from TradingView.com 

Analyst Says Solana At Risk Of Pullback: Here Is The Target

An analyst has explained how Solana may be at risk of a correction based on the data of two SOL technical indicators.

Solana Has Recently Observed The Formation Of Two Bearish Signals

In a new post on X, analyst Ali has discussed why SOL could be at risk of seeing a retracement shortly. The analyst has referred to two technical indicators for the coin: the TD Sequential and RSI.

The first of these, the Tom Demark (TD) Sequential, is a metric generally used for spotting probable reversal points in any asset’s price. The indicator has two phases, the first of which is a nine-candles-long “setup” phase.

When nine candles of the same polarity are in following a reversal in the price, the TD Sequential setup is said to be complete, and the asset could be assumed to have reached a likely point of a trend shift.

Naturally, if the candles are green, the setup’s completion would point towards a top, while red candles would imply a bottom formation. Once the setup is over, a thirteen-candles-long countdown phase starts. At the end of these thirteen candles, another probable change of direction happens for the chart.

According to Ali, a setup phase has recently formed for Solana. Below is the chart shared by the analyst that shows this TD Sequential pattern in the weekly price of the cryptocurrency.

Solana Price Chart

The graph shows that the TD Sequential setup has recently been completed with green candles, implying that the price may have already reversed toward a bearish trend.

In the same chart, Ali has also attached the data for the second relevant indicator: the Relative Strength Index (RSI). The RSI is a momentum oscillator that keeps track of the speed and magnitude of the recent changes in an asset’s price.

This indicator determines whether the asset is undervalued or overvalued at the moment. When the metric has a value greater than 70, it can be a sign that the asset is overbought, while it being under the 30 mark suggests an oversold condition.

As is apparent from the graph, the Solana RSI recently broke above the 70 mark and has remained inside the territory, suggesting that SOL has been overvalued recently.

This would mean that two bearish signals are looming over the cryptocurrency’s head right now. “A spike in profit-taking could trigger a retracement to $47.6,” says the analyst. From the current price, such a potential correction to $47.6 would mean a drawdown of over 20%.

Solana’s fate may yet be averted; however, as the analyst explains, “SOL would have to print a weekly candlestick close above $68.4 to invalidate the bearish outlook and aim for $108.”

SOL Price

Solana had rallied above the $65 mark yesterday, but the asset has already seen a pullback as it’s now trading around $60.

Solana Price Chart

Solana Forms Sell Signal, Decline To $30 Ahead?

Solana is forming a TD Sequential sell signal on the weekly chart right now and this analyst believes a decline to as low as $30 could happen for SOL.

Solana Weekly Chart Is In Process Of Forming A TD Sequential Sell Signal

The “Tom Demark (TD) Sequential” refers to a popular tool in technical analysis that’s used to pinpoint probable tops or bottoms in the price of any given asset or commodity.

This indicator is made up of two phases: the setup phase and the countdown phase. In the former, candles of the same polarity are counted up to 9. After this ninth candle, the metric signals that a likely reversal in the price is occurring now.

Naturally, if the setup occurs with green candles, the signal would be for a probable top, meaning that it could be the time to exit from the asset. On the other hand, the opposite type of candle would imply a reversal from the bearish trend may be taking place.

As explained by analyst Ali in a new post on X, the Solana 7-day chart has recently been finishing such a setup phase of the TD Sequential, suggesting the winds might be changing for the cryptocurrency.

The below chart shared by the analyst shows this signal forming in SOL’s price:

Solana TD Sequential

From the graph, it’s visible that this Solana signal could be a sell one, as the TD Sequential setup phase is forming with green candles. “With the week just beginning, the upcoming days could be crucial for traders eyeing profit-booking opportunities,” notes Ali.

As mentioned before, this phase isn’t the only one that the indicator has; there is also the “countdown phase.” This second phase lasts for 13 candles and starts right after the setup is finished.

Once these 13 candles are done, the asset’s price could once again be assumed to have reached a state of exhaustion in its trend and a reversal may be imminent.

“If the bearish formation gets confirmed, we might see a SOL downswing towards $45, potentially even dipping to $30,” explains the analyst. The former target would mean a decline of more than 21% from the current price of the coin, the latter 47%.

It now remains to be seen whether the bearish pattern will hold for the cryptocurrency after all. If it does, the TD Sequential may once again be the metric to watch, as the countdown phase’s end could lead to a reversal in the asset’s price once more.

SOL Price

Solana had gone as high as $68 last week, but the cryptocurrency has since seen a sizeable drop towards the $57 mark. Nonetheless, despite this decline, the asset is in profits of more than 100% in the past month, showcasing just how strong SOL’s recent bullish momentum has been.

Solana Price Chart