Solana Projected To Reach $500 This Year Despite Market Meltdown, Expert Predicts

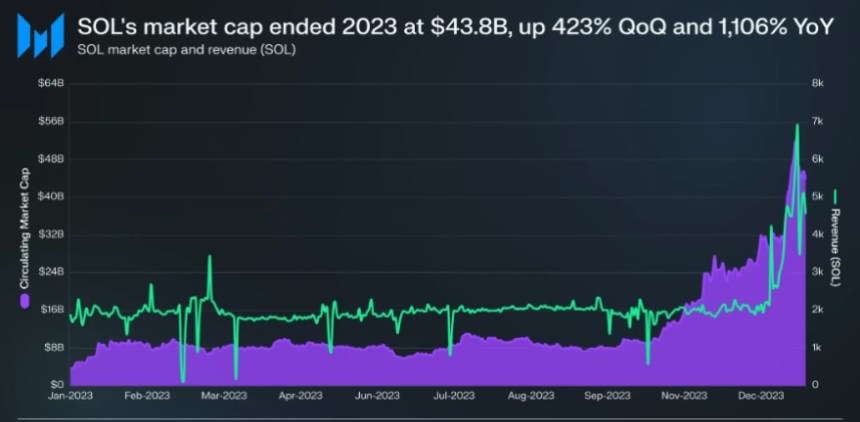
Solana (SOL), currently ranked as the fifth largest cryptocurrency with a market capitalization of $56 billion, has experienced a significant decline amid the recent market meltdown affecting the digital asset space. 

Over the past 24 hours, SOL has witnessed an 8% drop, reflecting the broader market downturn. Despite this setback, experts believe that if the cryptocurrency maintains support above the $120 price level, it holds notable potential for a strong price recovery in the coming months.

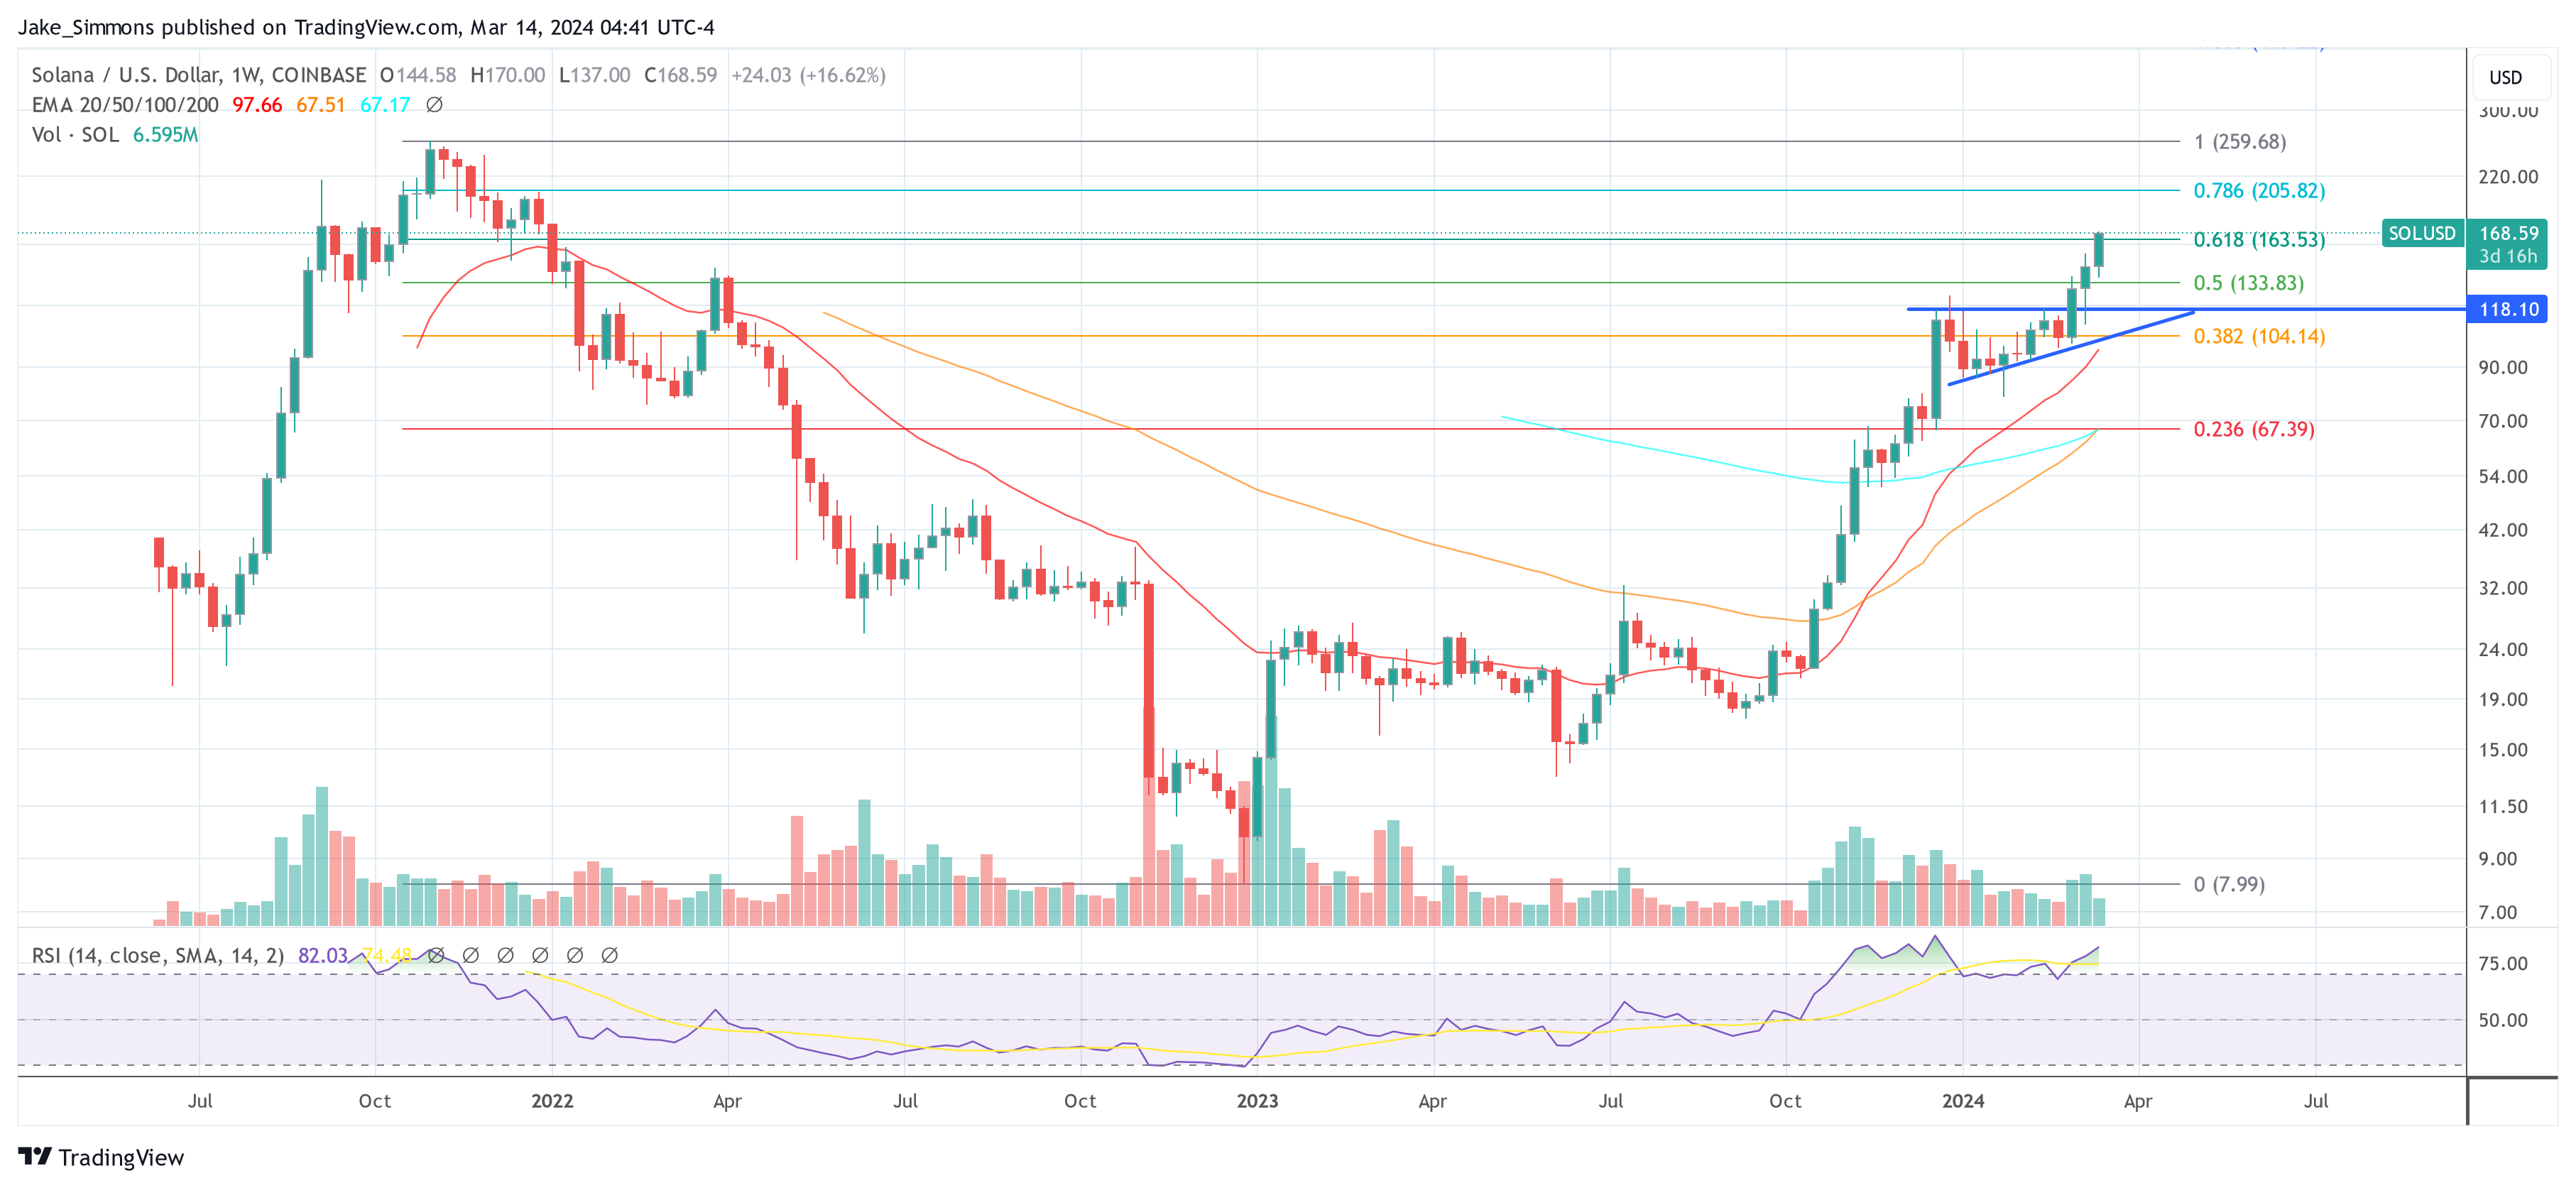
Bullish Price Outlook And Key Support Levels To Watch 

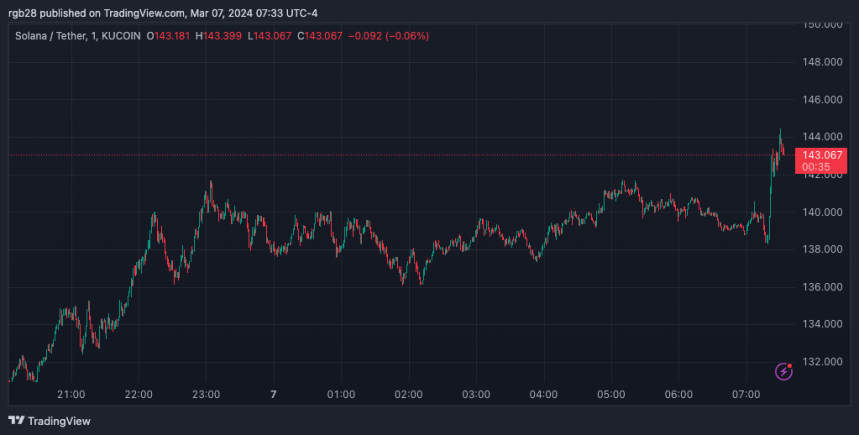
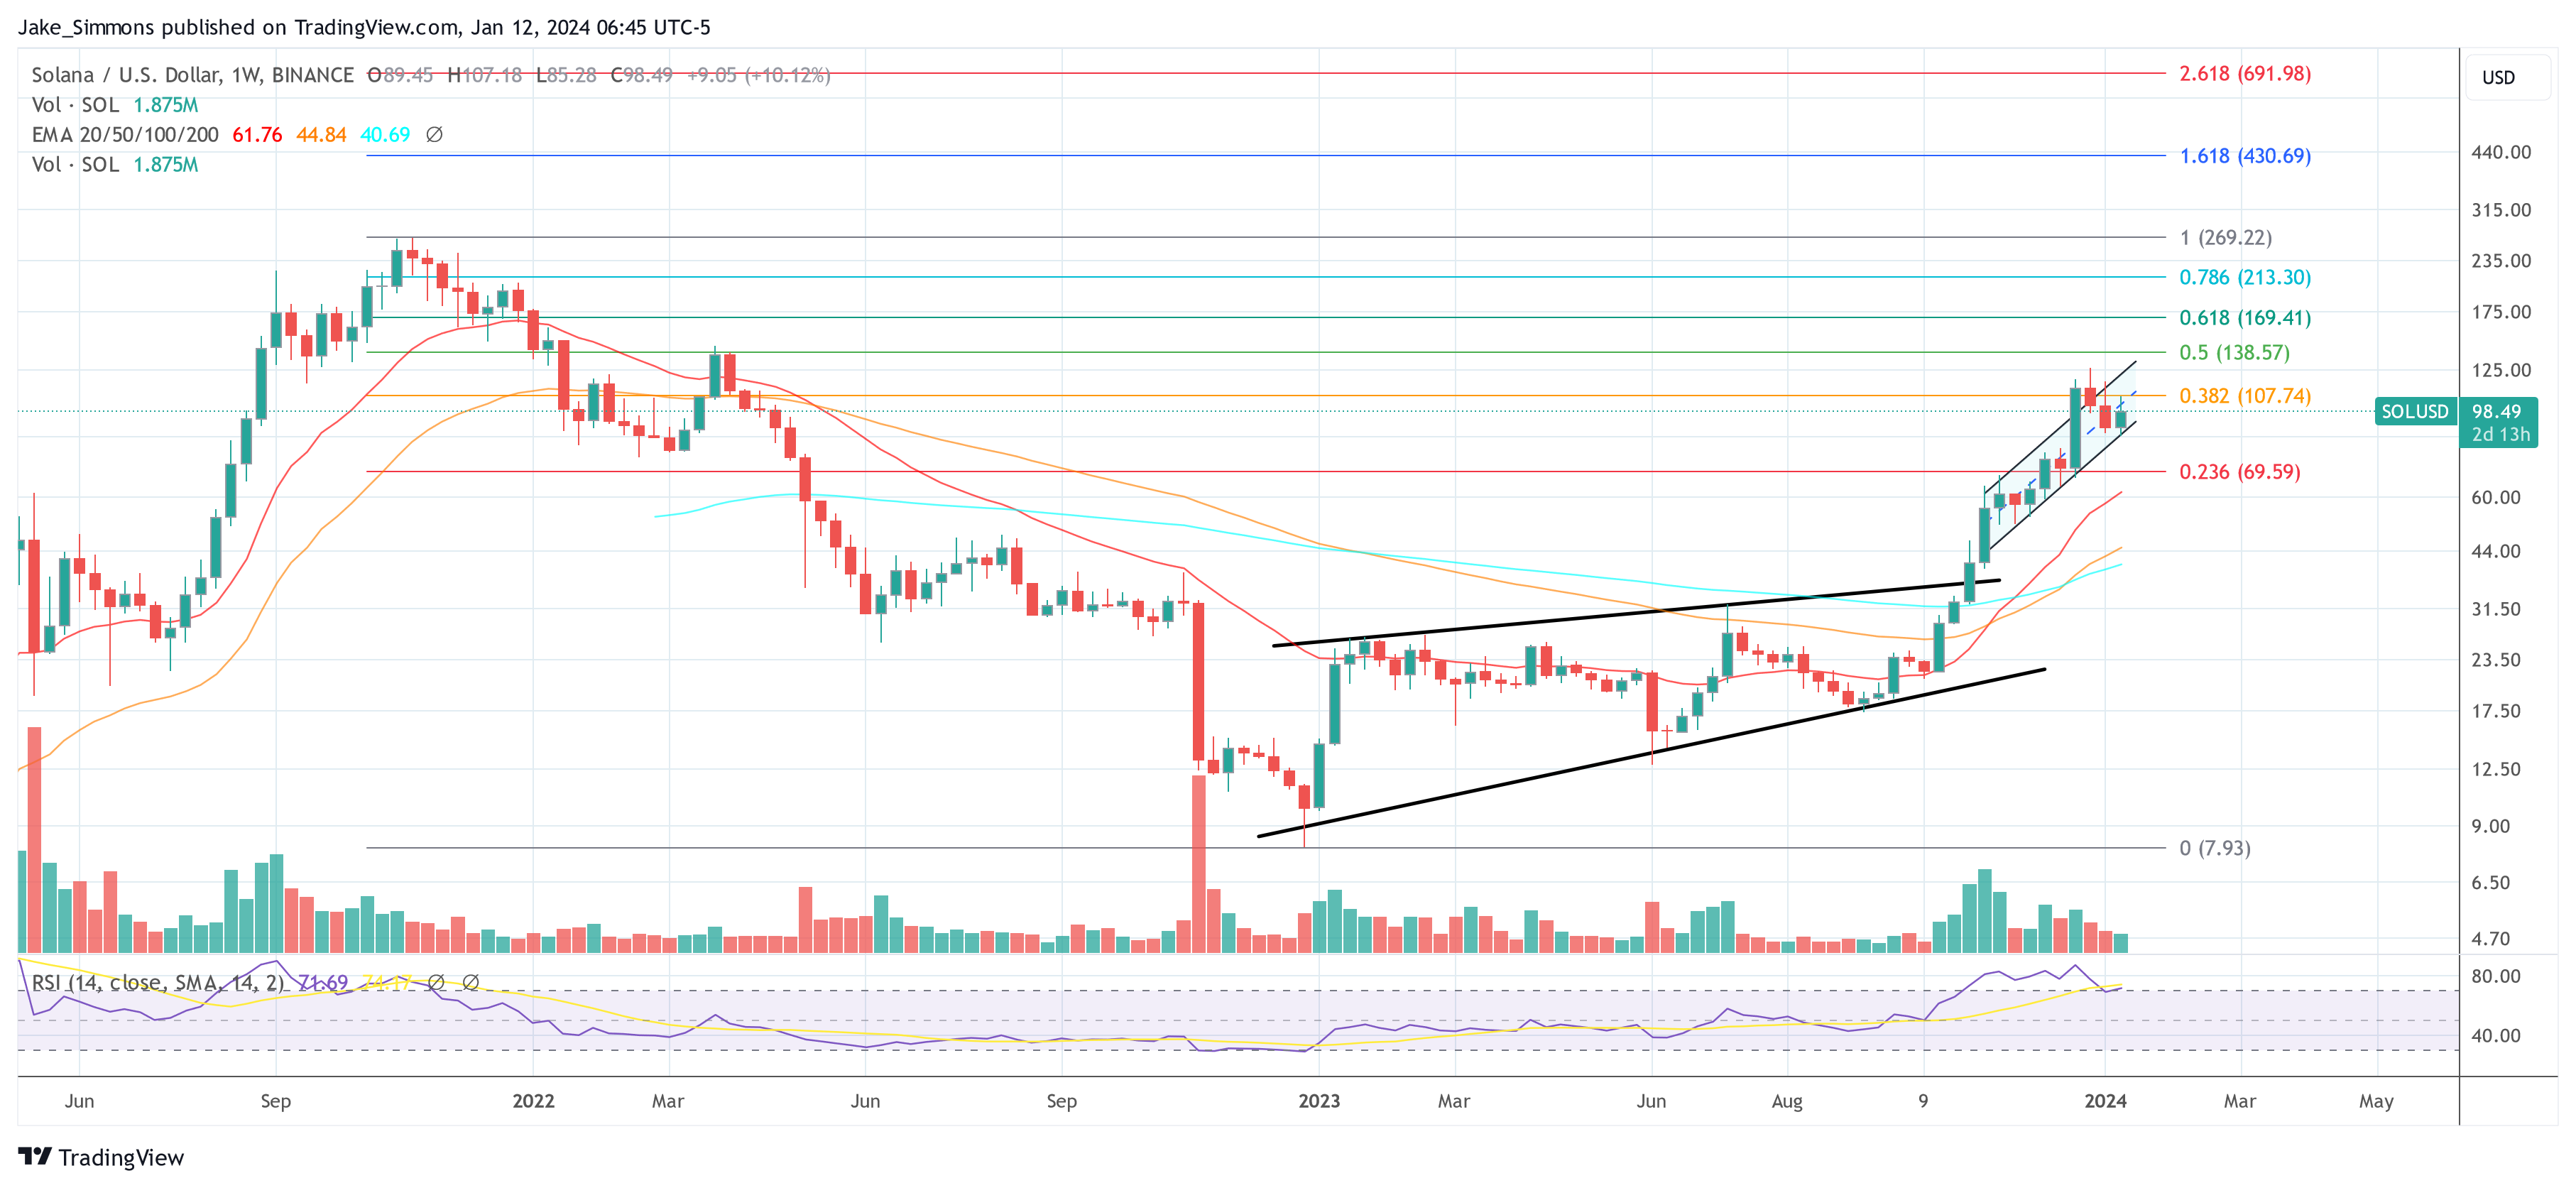
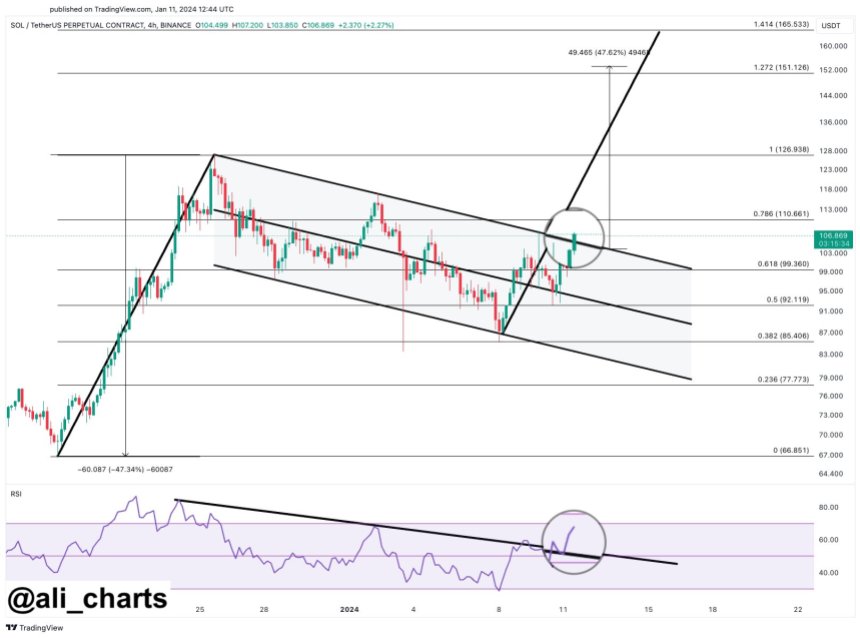
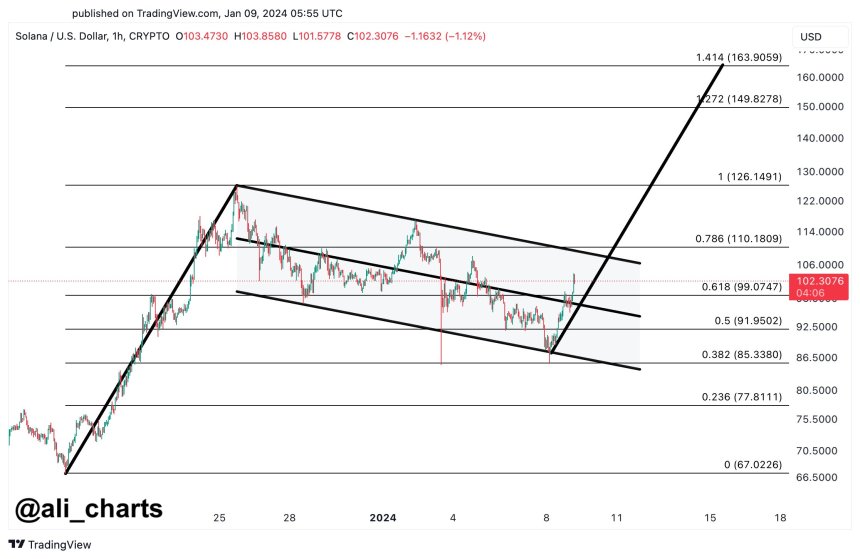
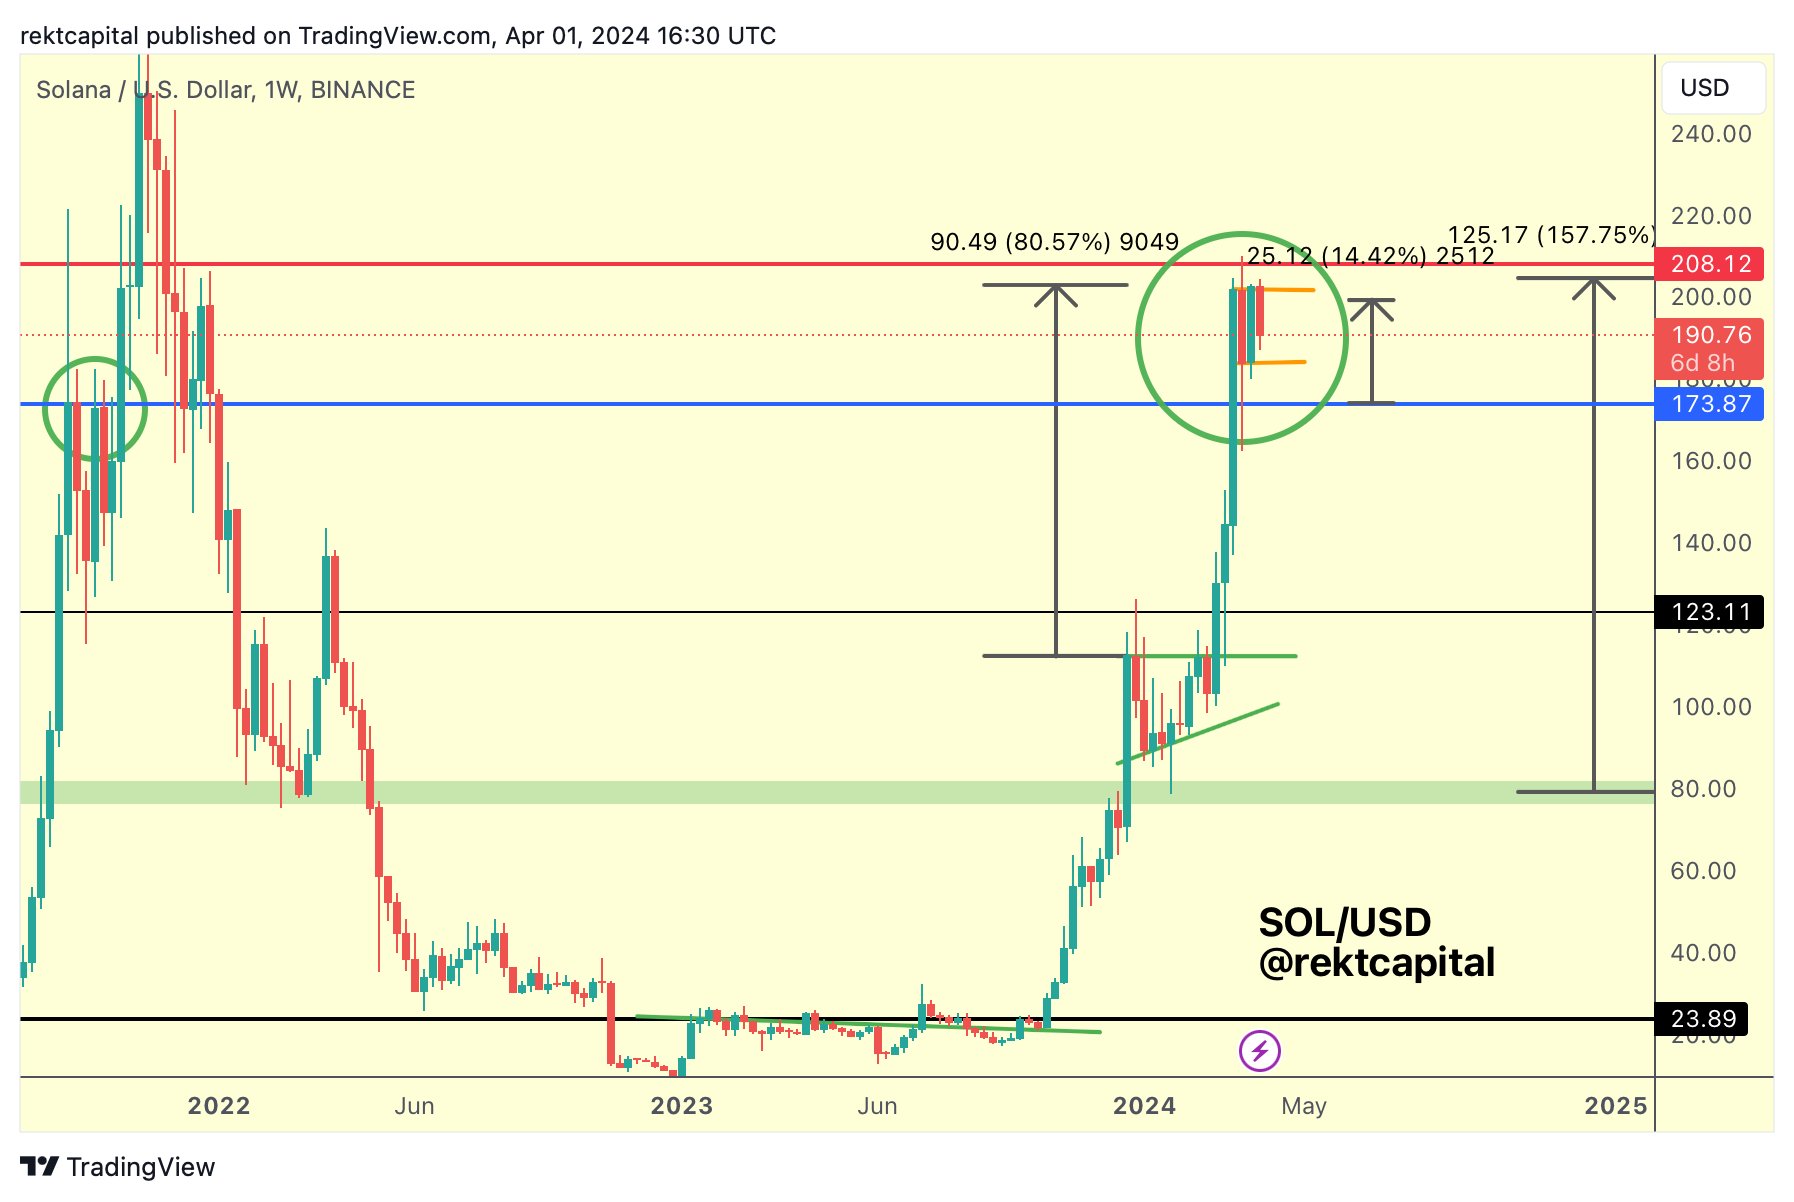
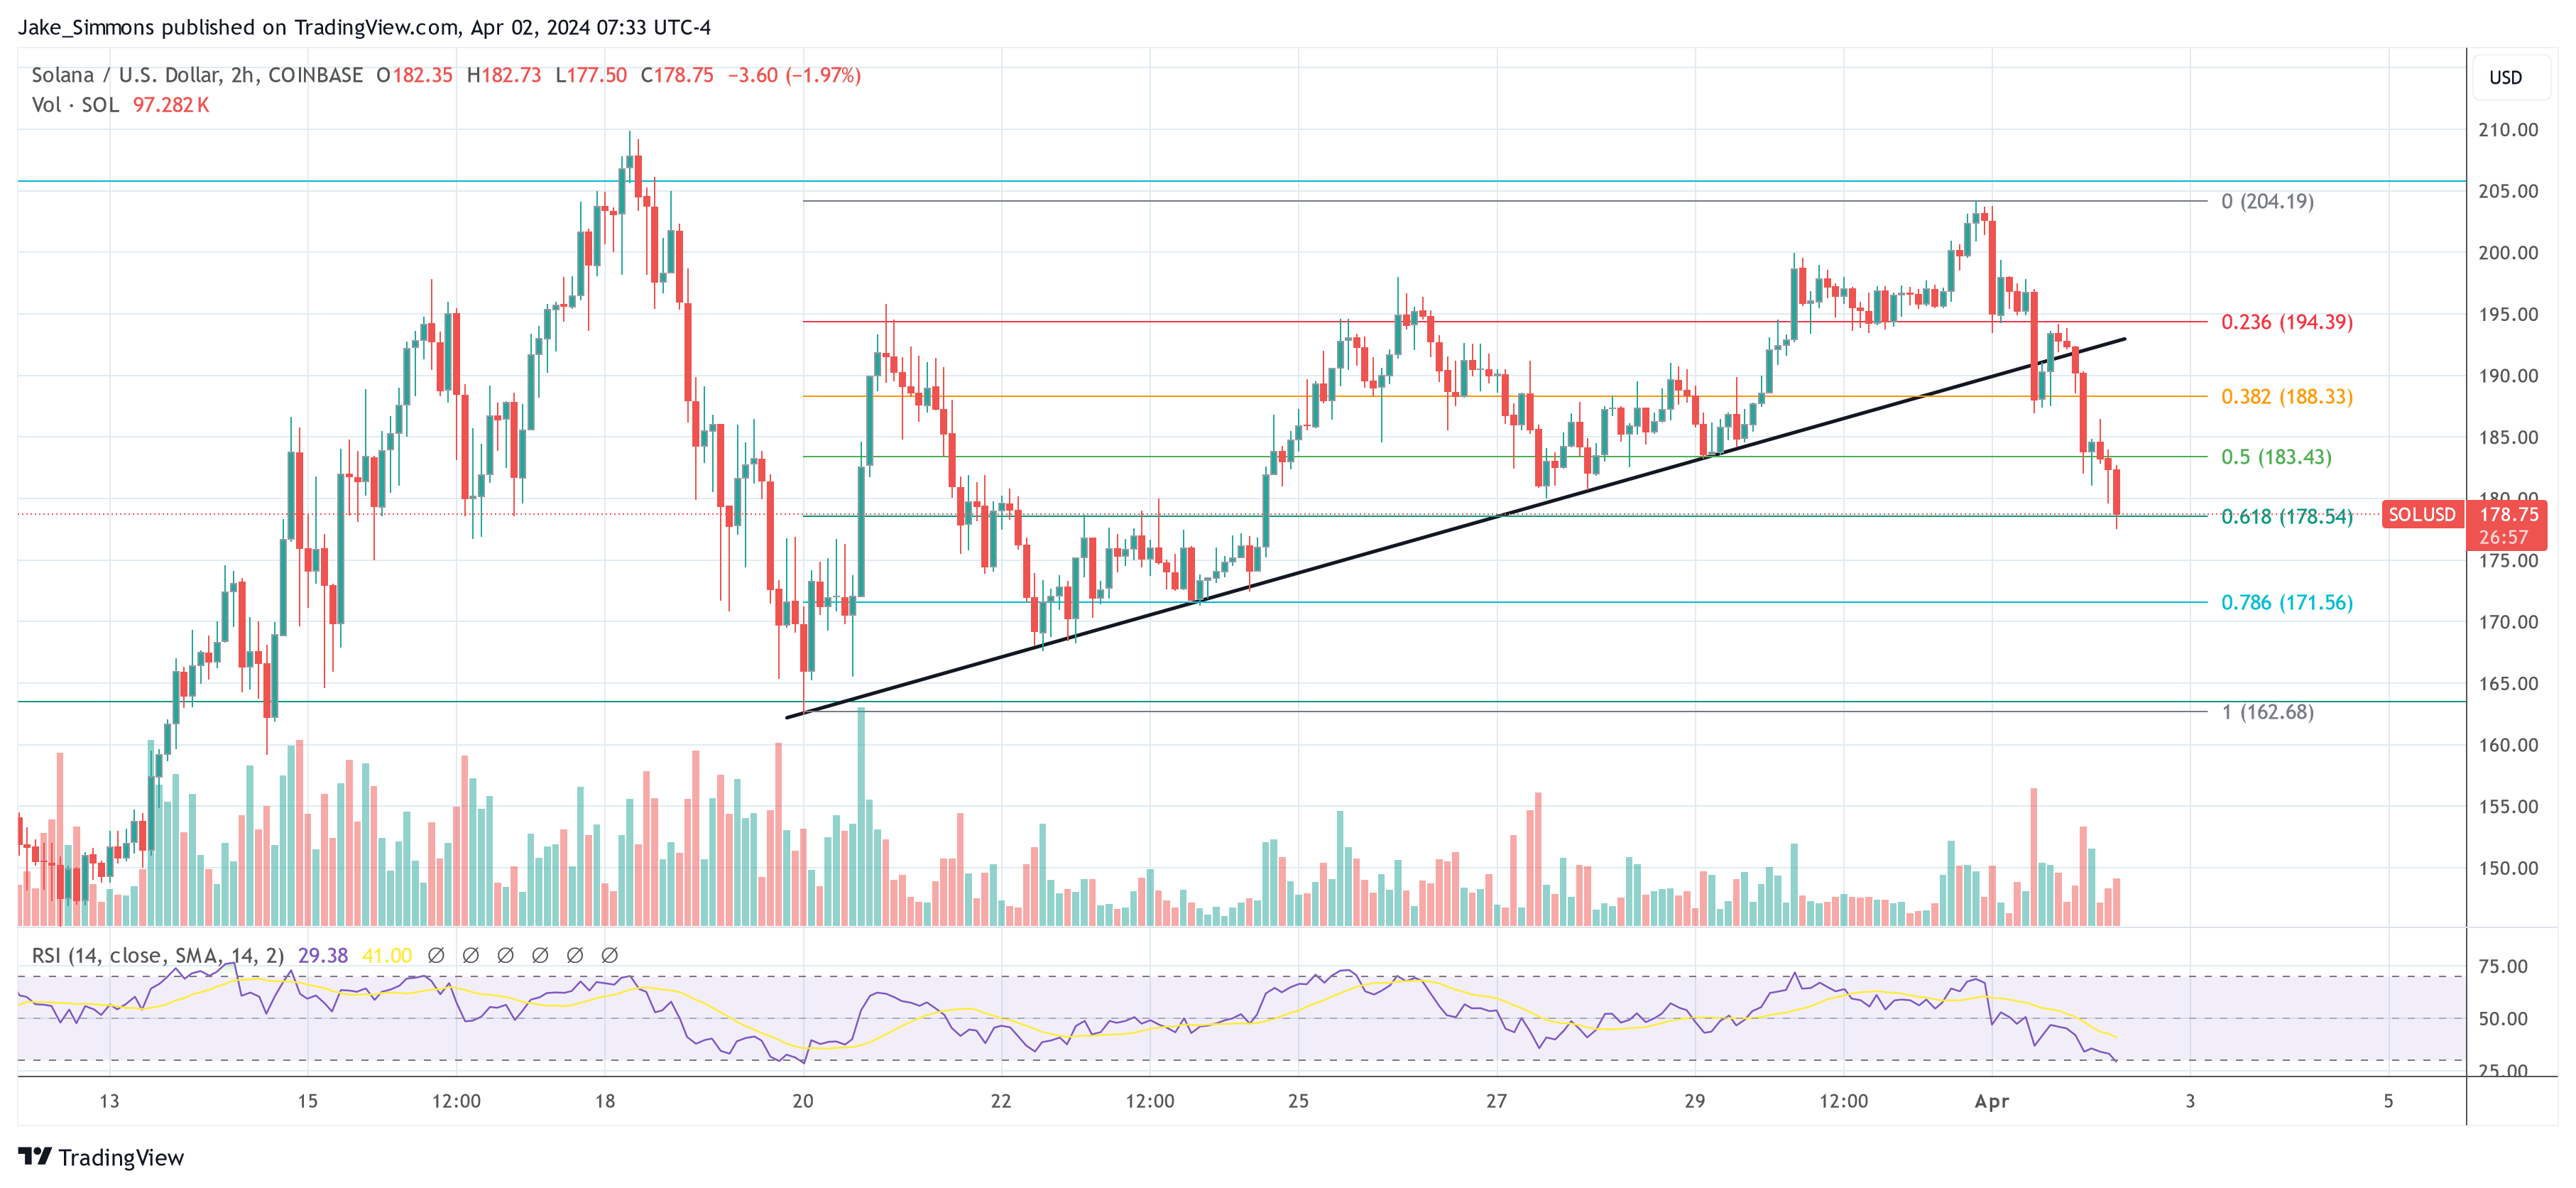
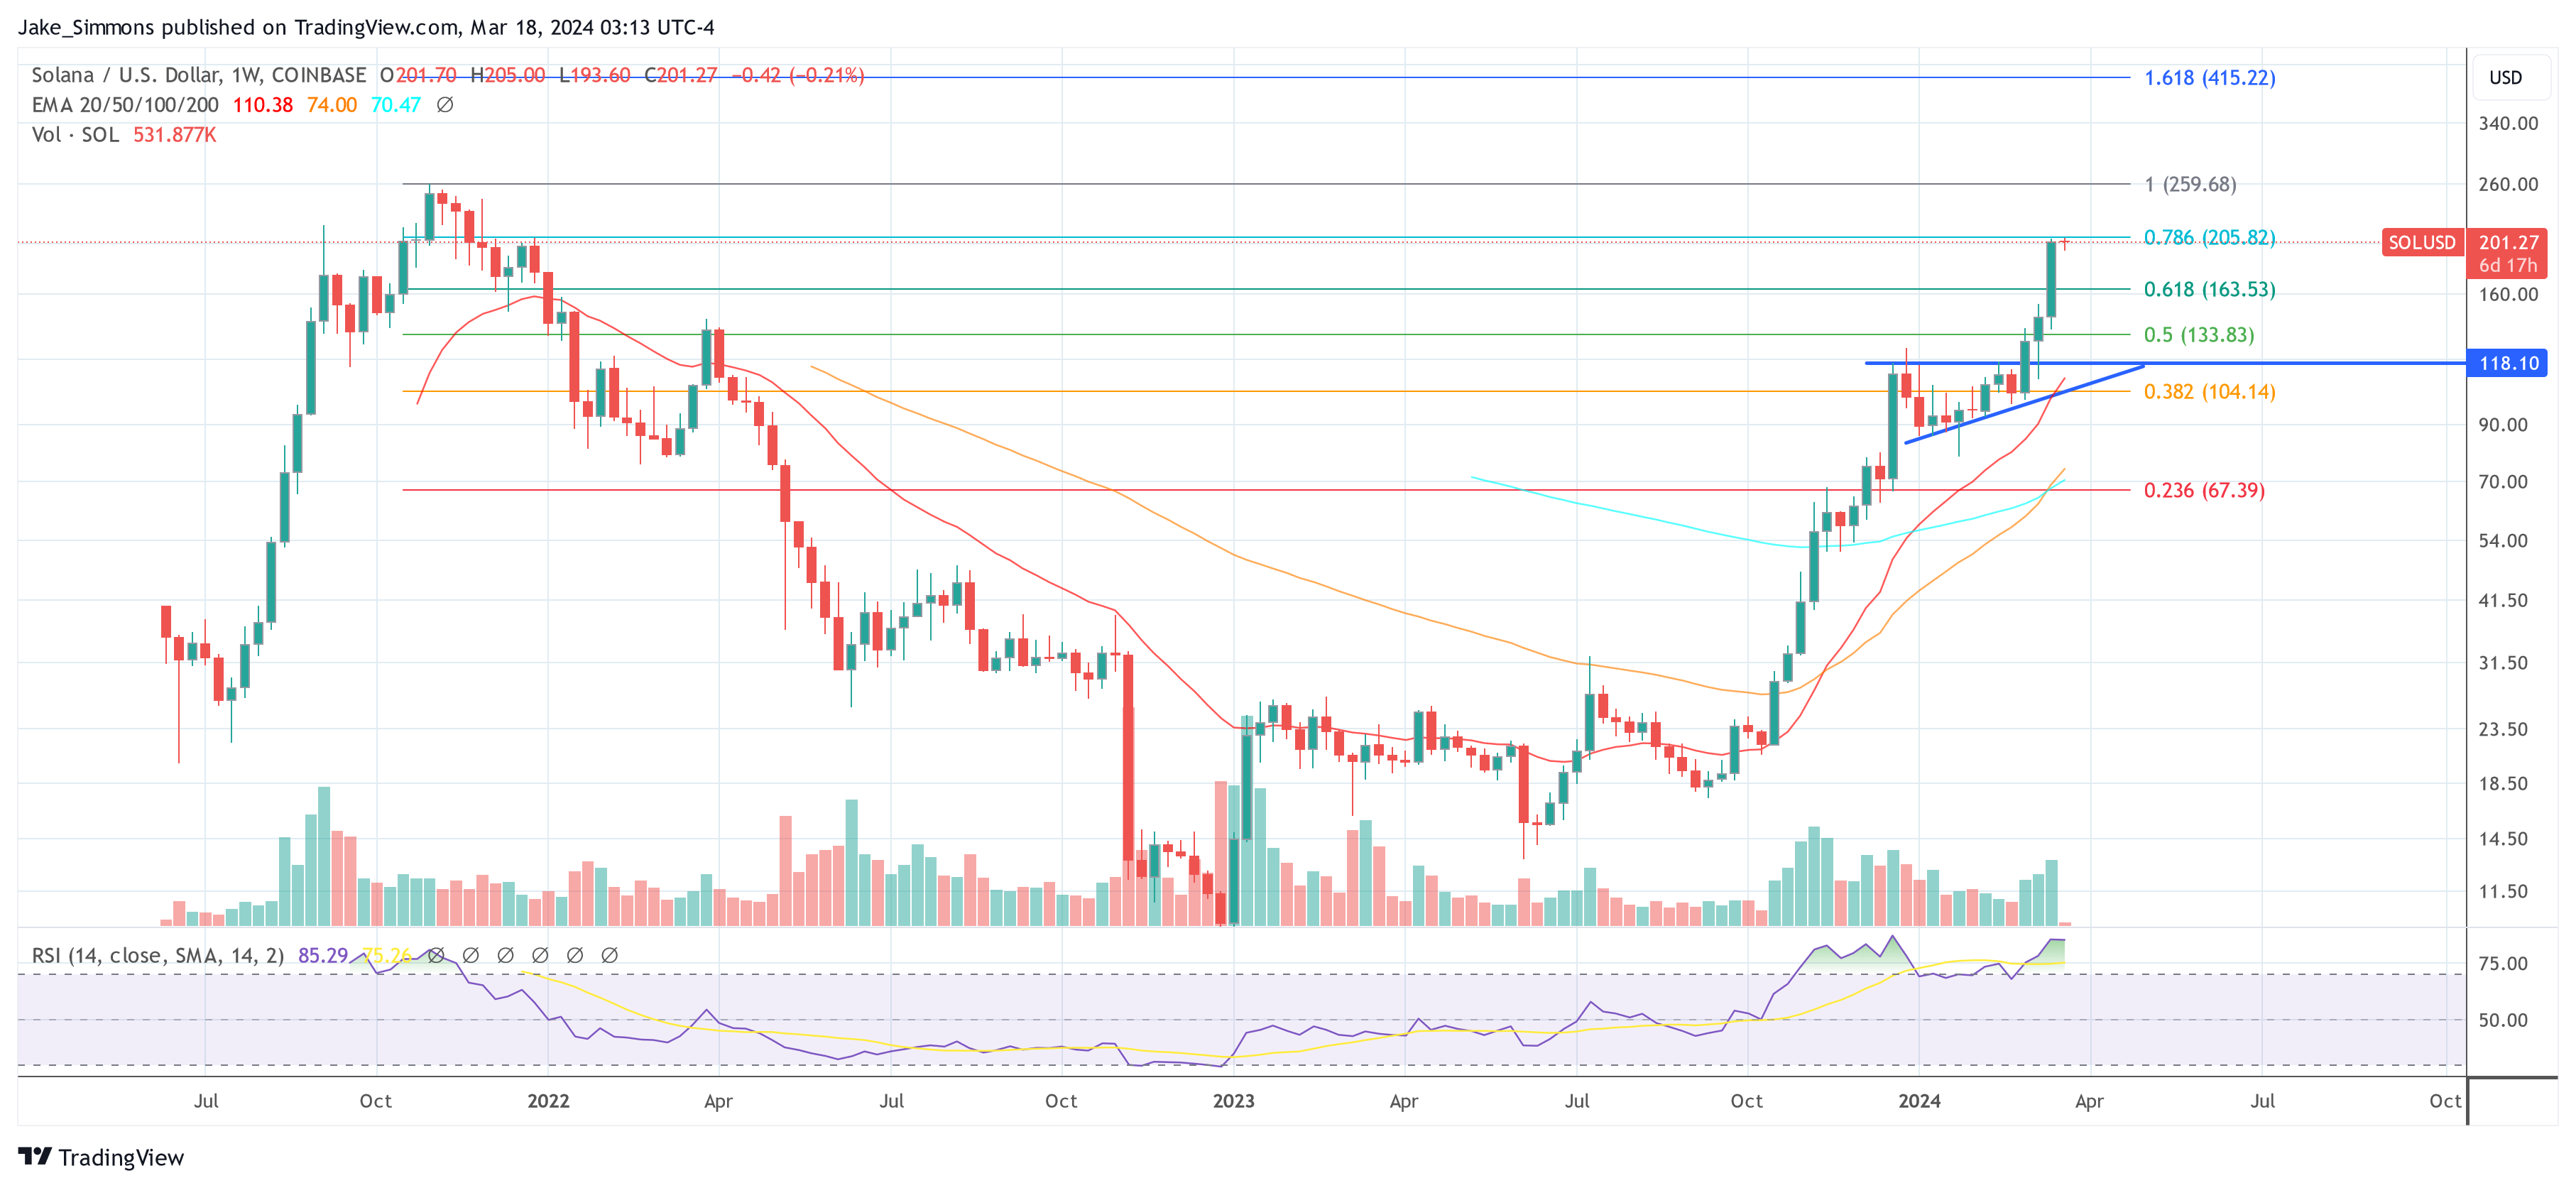
After reaching a yearly high of $209 on March 18, SOL’s current trading price is $124. However, according to crypto market experts, SOL still has a promising outlook. 

Altcoin Sherpa, a renowned analyst, suggests that if the altcoin market continues to decline, the $120 price level may become an area of significant interest for SOL. 

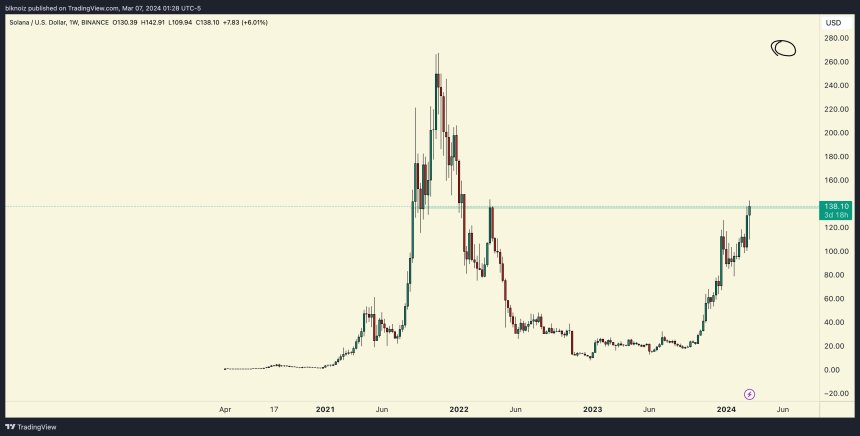
Altcoin Sherpa maintains a bullish sentiment, strongly believing that SOL can potentially exceed $500 this year. Such a surge would represent a significant 300% price increase from current levels, building upon the impressive 426% year-to-date price growth

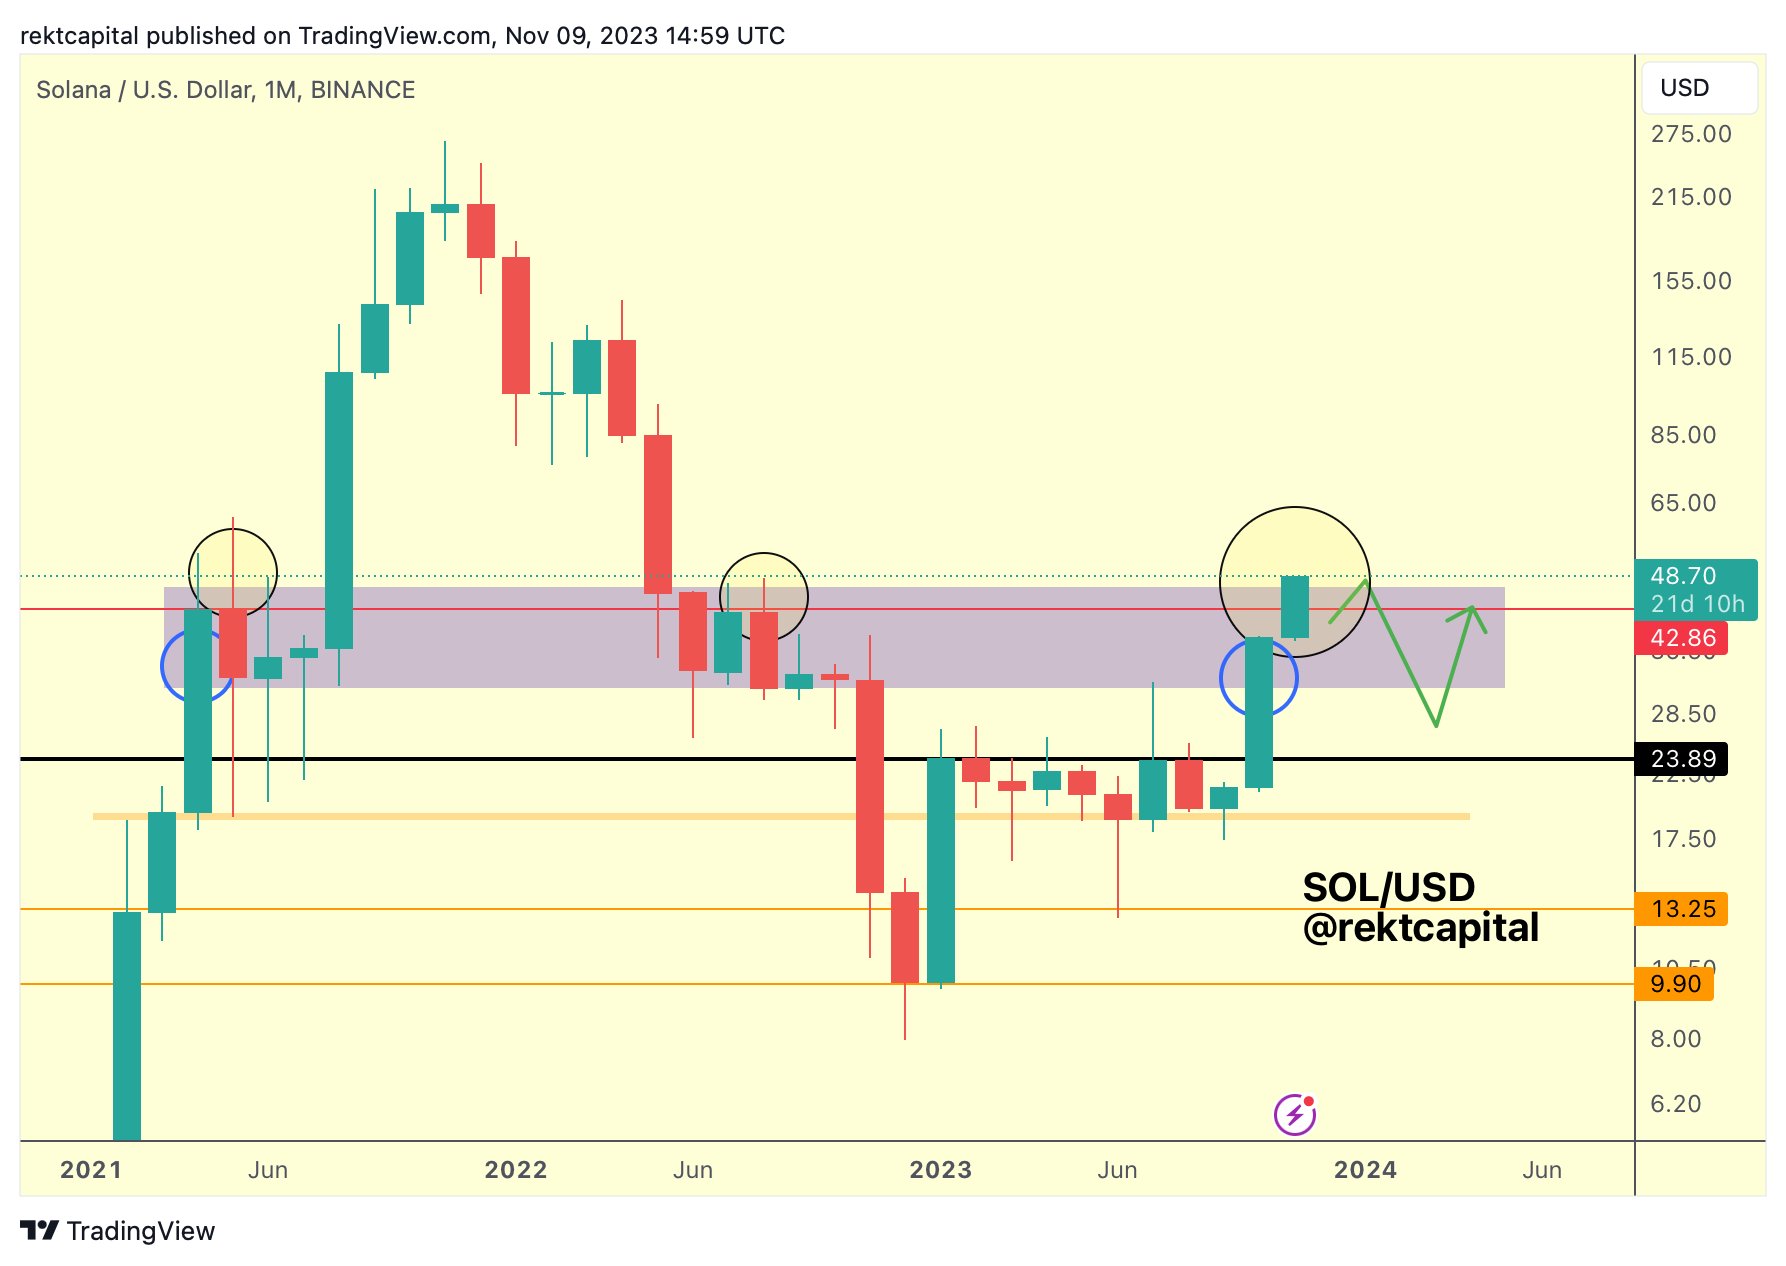
It is worth noting that this projection is nearly double SOL’s previous all-time high (ATH) of $259, reached during the last crypto market bull run in November 2021.

Solana

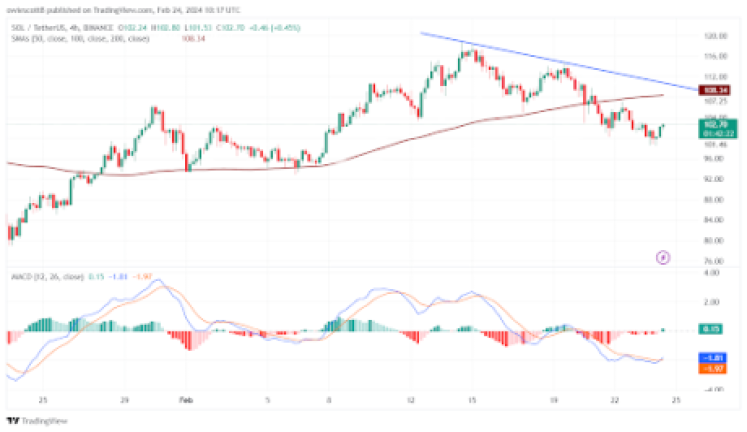
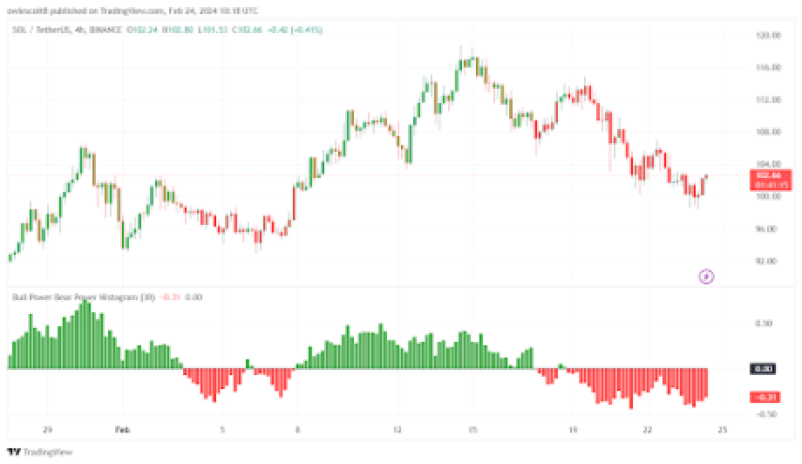
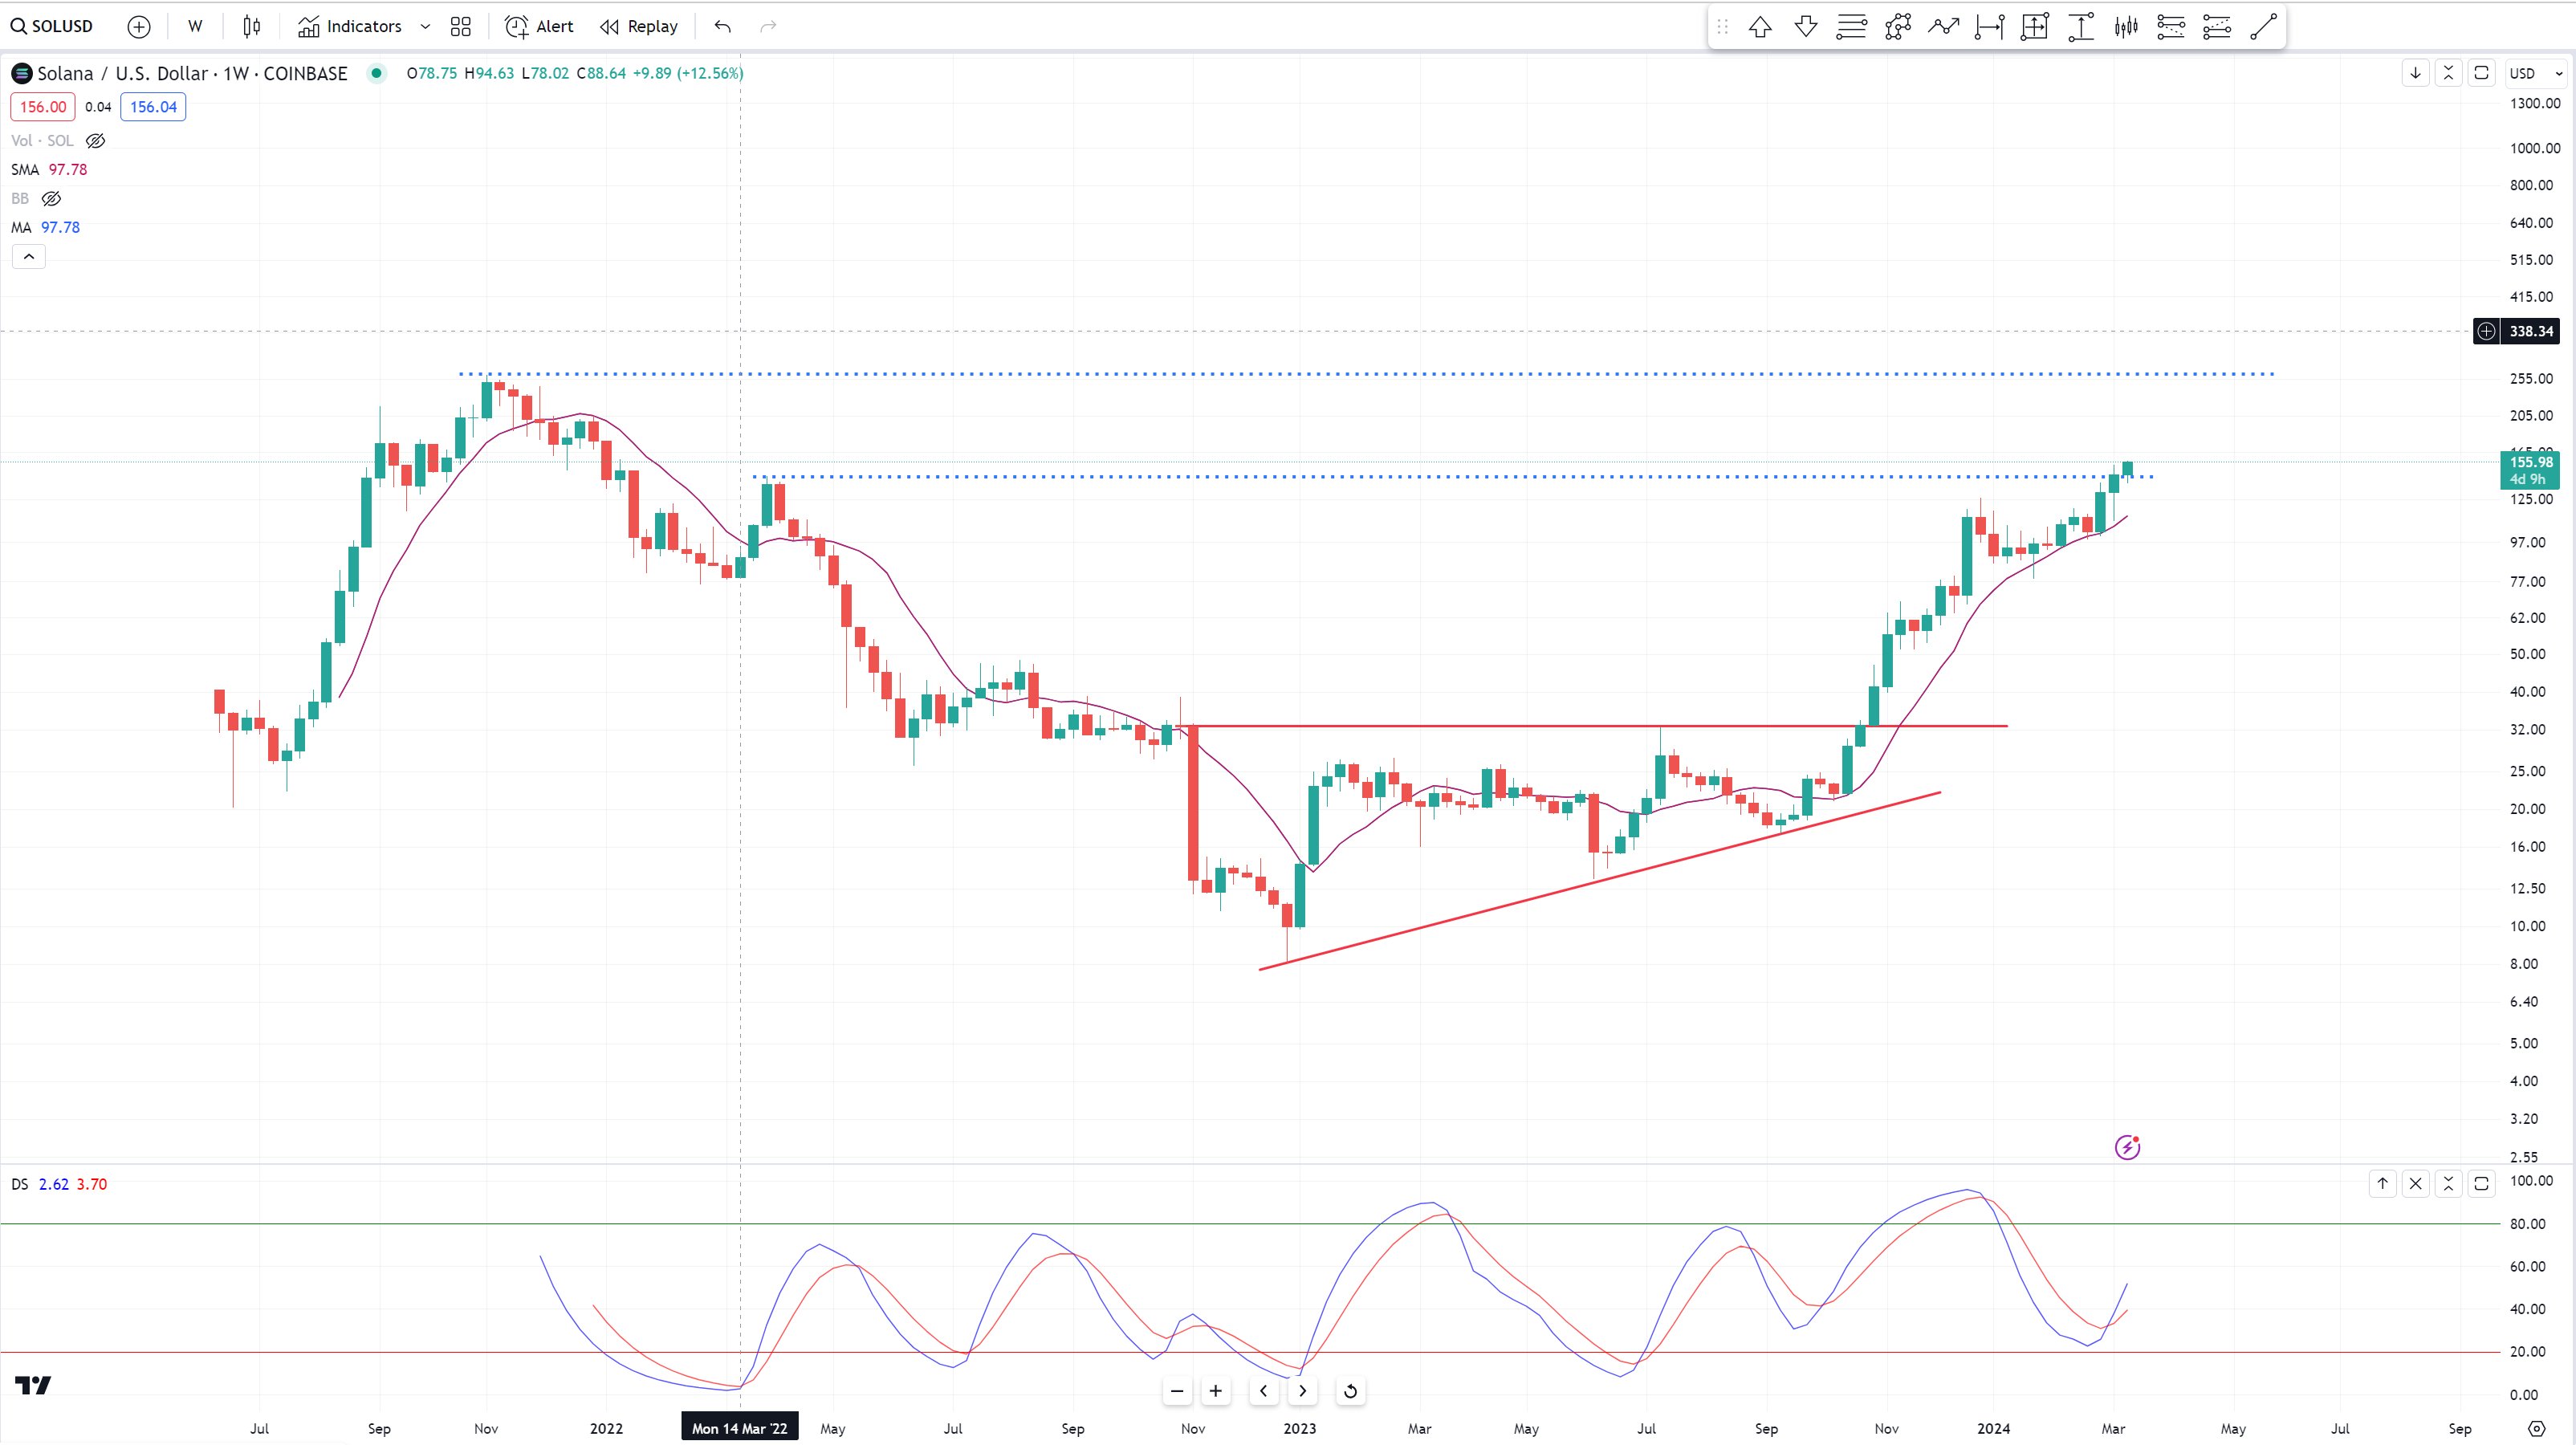
In addition to the analyst’s focus on the $120 price mark, other major resistance levels for SOL have been identified. These include $110, $102, and the critical long-term support level at $74, representing SOL’s uptrend structure over the past six months. 

Solana Dominates Blockchain Trading Volume

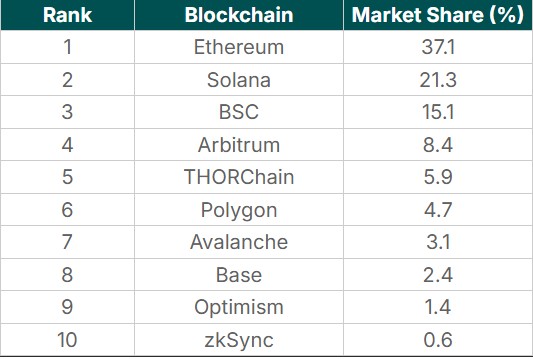
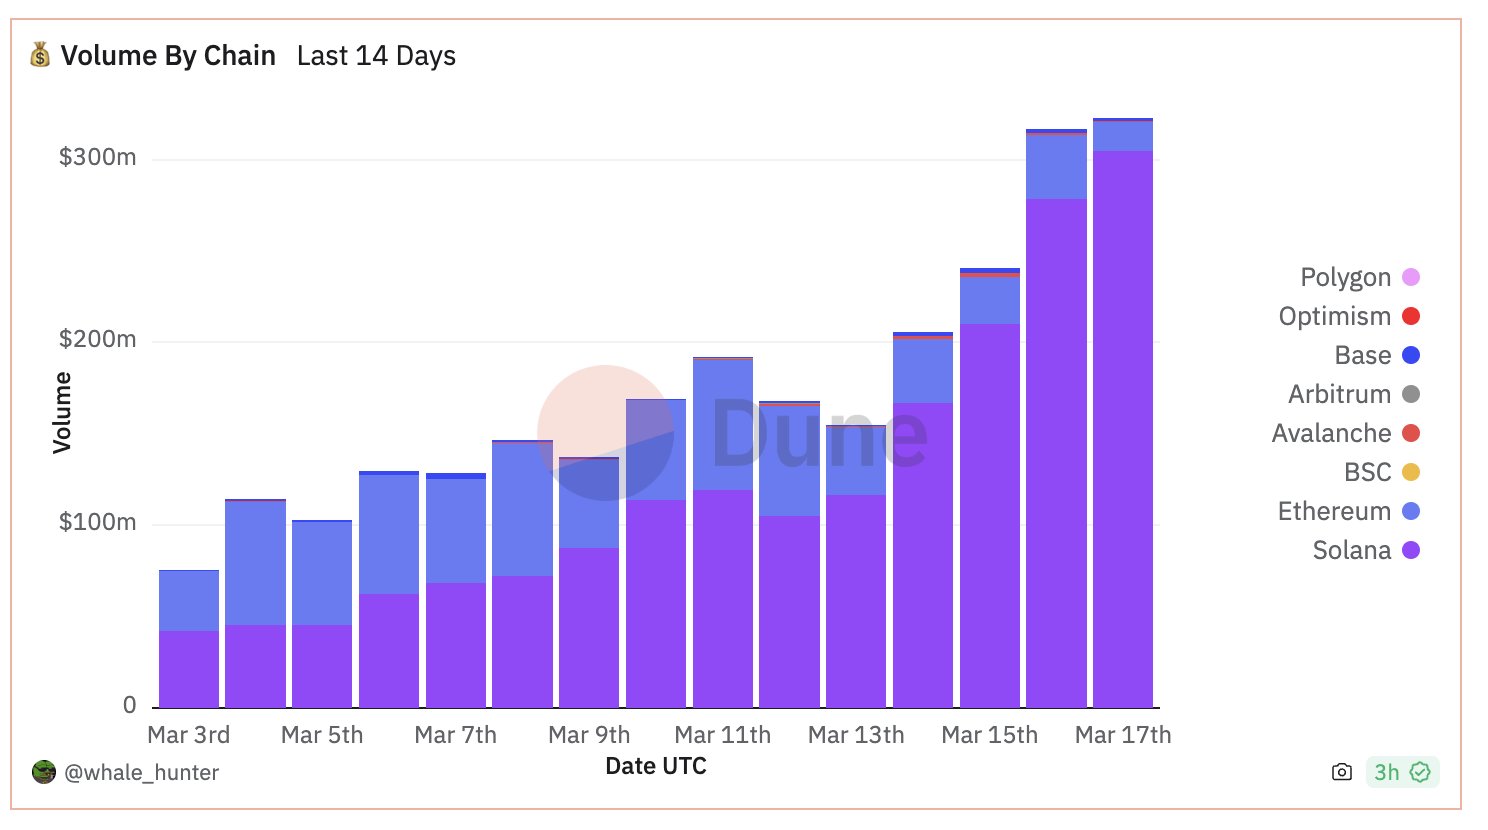
According to a recent CoinGecko report, Solana has secured its position as the second-largest blockchain by trading volume, commanding a substantial 21.3% market share in March 2024. 

The blockchain platform experienced a notable monthly growth of 244.8%, with trading volume surging to $40.05 billion, a significant increase from $11.61 billion in February. 

Solana’s performance in the first quarter of 2024 was equally significant. It accounted for 14.4% of all decentralized exchange (DEX) trading volume, totaling $62.31 billion. 

This represents a quarter-on-quarter (QoQ) growth of 242.7% compared to the previous quarter’s volume of $18.18 billion. Despite strong growth, Solana’s market share in the same quarter ranked fourth, trailing behind Binance Smart Chain (BSC).

Solana

According to CoinGecko, Solana’s trading volume has been greatly bolstered by several factors. Firstly, the doubling in the price of Solana’s native token, SOL, has attracted increased attention and trading activity on the platform. 

Additionally, the network has witnessed large airdrops from projects such as Jito (JTO) and Jupiter (JUP), further fueling trading volume. Moreover, the surge in memecoins on the Solana network has significantly contributed to its trading volume. 

Notably, the launch of Book of Memes (BOME) in March proved successful, as it achieved a market capitalization of $1 billion within two days. BOME also secured listings on crypto exchanges like Binance and Bybit, further amplifying trading activity on Solana.

Featured image from Shutterstock, chart from TradingView.com

Solana Price Could Explode By 80% If This Happens: Crypto Analyst

In line with the broader trend in the overall crypto market, the Solana (SOL) price has fallen by 7.5% in the last 24 hours. However, according to renowned analyst Rekt Capital, there is no reason to switch to the bearish side.

In a recent technical analysis, the crypto analyst highlighted that Solana is currently showing potential for an 80% price rally based on its present consolidation pattern. According to Rekt Capital, Solana is trading within what appears to be a bull flag formation, as depicted on the weekly SOL/USD chart from Binance.

A Bull Flag pattern occurs after a strong, almost vertical price rise and is characterized by a downward-sloping consolidation that resembles a flag on a pole. The “pole” is formed by the initial price surge, while the “flag” represents a period of consolidation with converging trendlines.

Solana price analysis

Traders often watch for a decisive breakout above the flag, which can signal the continuation of the prior uptrend. In Solana’s case, the analyst points out that Solana recently faced a rejection at the top of the bull flag pattern at $208, indicating a short-term setback in its upward trajectory.

“And if Solana keeps this up, it may form a Bull Flag here before breaking out to challenge that Range High $208 resistance again,” Rekt Capital noted.

However, the bottom of this bull flag, which stands at approximately $184, is identified as a critical support level that needs to be maintained to keep the bullish momentum alive. Should Solana manage to hold above this level, the setup may favor the continuation of the uptrend.

Notably, Rekt Capital adds that while occasional dips or “wicks” into the $173 range are acceptable, the price must generally remain above the $184 support on the weekly time frame to validate the bullish outlook. The $173 price level is marked by a blue horizontal line on the chart, serving as an additional support zone.

In terms of price targets, the chart reveals an 80.57% potential rally from the bottom of the bull flag (“pole flag”), which could translate into a target price of approximately $330 if the bull flag pattern is confirmed in the coming days or weeks.

Solana Bears Gain The Upper Hand On The Lower Time Frames

On the lower time frames, like the 2-hour chart, the Solana price lost some momentum, indicating potential short-term consolidation or downward movement. SOL experienced a sharp -13% decline, breaking through a significant upward trendline (black) that had previously provided support throughout an ascending trajectory.

Solana price

The price has sliced through the Fibonacci retracement levels plotted from the swing low at $162.68 to the swing high at $204.19, currently hovering around the 0.618 Fib level at $178.54. Typically, this level serves as a strong support zone, but a sustained break below could accelerate losses toward the next levels at 0.786 ($171.56) and potentially the full retracement at $162.68.

Volume indicators show a marked increase in selling pressure during the price dip, which substantiates the current bearish momentum. Furthermore, the Relative Strength Index (RSI) has plummeted to 29, teetering on the edge of the oversold territory. This suggests that sellers are in control, but also raises the possibility of a relief bounce if the RSI dips further into oversold conditions and triggers a reactive buying response.

Solana Market Cap Set To Skyrocket 1,000%, Says Crypto Fund CEO

Joe McCann, the CEO and CIO of the crypto hedge fund Asymmetric, recently made a bold statement on X (formerly Twitter), forecasting a $1 trillion market cap for Solana. McCann’s argument hinges on several key points that detail why he believes Solana has achieved product-market fit (PMF) as “The Chain for Retail,” juxtaposing it against Ethereum’s challenges and perceived shortcomings for retail users.

Solana Beats Ethereum

McCann critiques Ethereum for not being designed with retail in mind, pointing out its slow and expensive Layer 1 (L1) transactions, alongside the user experience (UX) nightmare posed by its numerous Layer 2 (L2) solutions. He states, “Ethereum is not a chain designed for retail – the L1 is too slow and expensive and the L2s are (currently) a UX nightmare.”

The friction for new users, fragmented liquidity across over “40 L2s”, and the complications with bridging are highlighted as significant barriers to Ethereum’s adoption by a broader retail audience.

Turning his attention to corporate-backed open-source projects like Coinbase’s L2 solution, Base, McCann acknowledges their potential to solve some UX issues. However, he also notes the inherent priority of such projects to serve corporate interests, often at the expense of broader community needs.

Despite his critique, he admits, “Most corporate open source ultimately ends up serving corporate priorities…and it should!” This acknowledgment underscores the complexity of balancing corporate involvement in blockchain development with the ecosystem’s decentralized ethos.

McCann attributes Solana’s rise to its ability to serve the retail segment effectively, particularly through its association with memecoins and speculative trading. Describing Solana as originally being “Blockchain at Nasdaq speed” for its high throughput and low latency, he notes a pivotal shift in its narrative towards retail.

He observes, “Not once has the concept of being The Chain for Retail™ ever surfaced. Until now.” This shift is largely credited to Solana’s embrace by the memecoin community and the speculative trading that follows, marking a clear PMF with retail users.
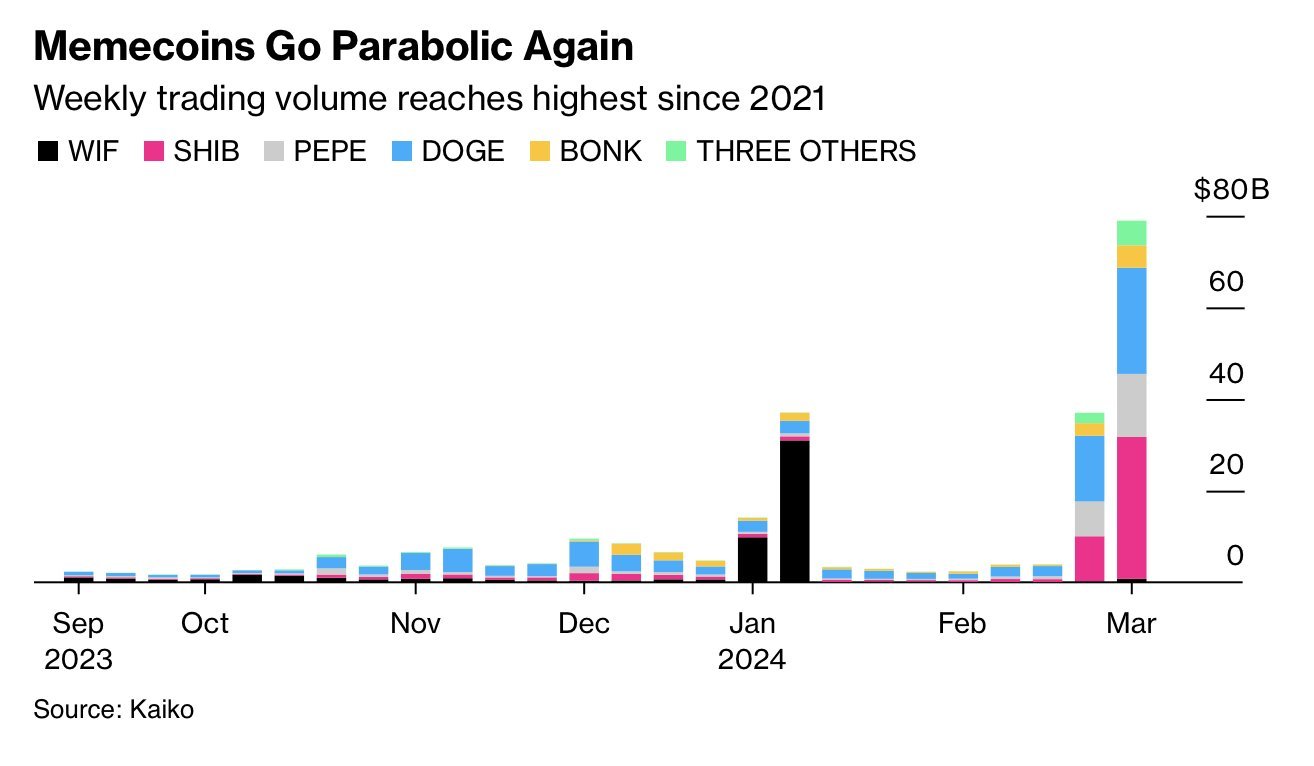
Highlighting the explosion of memecoin speculation on Solana, especially post-NFL season, McCann points out, “Since the NFL season ended, speculation on memecoins has exploded…BONK and WIF are on Solana. […] Thousands of them are being created everyday and trading volumes are exploding.”

Meme coins go parabolic

The extensive creation and trading volumes of these coins on Solana are seen as a testament to its appeal and utility for retail speculators. Notably, the majority of memecoins is on Solana, not Ethereum.

”Trading Bots aka the ‘Robinhood-ification of crypto’ has been driving the majority of the trading due to its…great UX. […] And the majority of those bots are trading memecoins on Solana. Solana is now consistently flipping Ethereum in DEX volumes yet for some reason, SOL is still 1/4th the value of Ethereum, it was 1/8th just a few days ago,” McCann noted.

Trading bots

He contrasts Solana’s market cap with Ethereum’s, using their relative valuations to argue for Solana’s growth potential. With Ethereum valued at just under $500 billion and Solana at about $115 billion, he suggests that Solana’s path to a $1 trillion market cap represents a nearly 10x growth opportunity, far outpacing the potential for Ethereum.

“ETH to $1T is a double. SOL to $1T is nearly a 10x. Which horse are you gonna bet on? The fastest one, obviously,” McCann concludes, encapsulating his bullish outlook for Solana based on its retail-friendly ecosystem and the vibrant activity around memecoins.

At press time, Solana traded at $201.27.

Solana price

Solana (SOL) Price Primed For 50% Leap: Experts Turn Bullish

Crypto analysts are turning increasingly bullish on Solana (SOL), with forecasts suggesting a potential 50% surge in the near future. Following SOL’s 11% surge in the past 24 hours, several renowned analysts came forward to express their bullish stance.

Solana Price Poised For Rally Towards $250

On X, crypto trader Bob Loukas (@BobLoukas) has provided an optimistic outlook, stating, “SOL now based and fuel up for leg to $250.” This statement is based on a thorough analysis of the weekly SOL/USD chart.

The chart exposes that SOL has transformed its March 2022 resistance level of around $140 into a robust support zone. Previously, this level served as a strong resistance from mid-December last year until the beginning of March.

By converting this resistance into support, SOL is now poised for a rally towards $250. This price target is just $10 shy of Solana’s all-time high at around $260 from late October 2021.

SOL/USD weekly chart analysis

Adding to the bullish sentiment, crypto analyst Byzantine General (@ByzGeneral) remarked, “SOL looks pretty good to me. Leverage in the system has actually gone down while price is up and at the same time Coinbase has been buying a lot of spot.”

Solana analysis

Notably, not only the SOL/USD charts look ultra strong, but also the chart of SOL against its most fierce competitor in the fight for the superior layer-1 network, Ethereum. According to several analysts, SOL/ETH is primed for a major breakout.

Christopher Inks, the founder of TexasWest Capital, shared his analysis, noting, “SOL/ETH on the weekly looks amazing. It doesn’t get much better than this with the wedge breakout while Stoch RSI is crossing bullishly in oversold and threatening to break out and RSI has bounced at neutral and is nearing a bullish cross. Breaking out above 0.04597 adds confidence to the rally toward a minimum expected target of 0.07231.”

This technical breakdown suggests a very optimistic future for SOL in comparison to ETH. If this technical setup plays out, SOL could outperform ETH by more than 70%.

Macro expert Raoul Pal has also chimed in, stating, “SOL/ETH is looking like a breakout after a perfect consolidation… SOL is likely to take the lead again soon.” Pal’s analysis is based on a falling wedge correction pattern, a bullish signal, which SOL/ETH has already broken out from.

SOL/ETH

However, it is important to note that this breakout needs to be confirmed to avoid being considered a fakeout, indicating a potential major breakout against ETH. Renowned trader Peter Brandt, commenting on Pal’s analysis, identified the pattern as a “Classic Schabacker falling wedge correction,” a bullish signal typically indicating a potential reversal or continuation of the trend.

The Falling Wedge pattern, characterized by converging trend lines, decreasing volume, and a breakout with increased volume, suggests that SOL’s current pattern positions it for significant upward movement.

At press time, SOL traded at $168.59, surpassing the 0.618 Fibonacci retracement level in the weekly chart.

Solana price

Pantera Capital Plans $250M Solana (SOL) Buy, Analyst Predicts Record Rally Toward $1000

Pantera Capital, a prominent crypto-focused asset manager with assets totaling $5.2 billion, has launched a fundraising campaign to purchase discounted Solana (SOL) tokens from the bankrupt estate of crypto exchange FTX. 

According to Bloomberg, the initiative, known as the Pantera Solana Fund, offers investors the opportunity to purchase up to $250 million worth of SOL tokens at a significant discount to the FTX estate.

Solana Token Acquisition Plan

Pantera Capital’s marketing materials, shared with prospective investors in February and reviewed by Bloomberg, outline the opportunity to purchase SOL tokens at a price 39% below the 30-day average or at a fixed price of $59.95. 

However, Bloomberg notes that investors participating in this opportunity must agree to a vesting period of up to four years. This approach reportedly allows FTX liquidators, led by John J. Ray III, to offload SOL tokens gradually, freeing up funds for creditors without exerting immediate downward pressure on the token’s price.

According to Pantera’s pitch document, the FTX estate currently holds approximately 41.1 million SOL tokens, valued at $5.4 billion as of the close of Wednesday’s trading session. This constitutes roughly 10% of the total supply of SOL tokens. 

According to its investor pitch, Pantera aimed to close the fund by the end of February. Although the amount raised by the deadline remains undisclosed, sources familiar with the matter confirmed to Bloomberg that Pantera has secured some funds.

Investors interested in participating in the Pantera Solana Fund must commit a minimum of $25 million. Pantera Capital plans to charge a management fee of 0.75% and a performance cut of 10%.

Apart from its substantial SOL token holdings, FTX and its sister firm, Alameda Research, have invested significantly in startups within Solana’s broader ecosystem. 

According to Bloomberg, FTX’s venture arm, Solana Ventures, and Lightspeed Venture Partners jointly announced a $100 million blockchain gaming fund in November 2021.

Ultimately, the estate’s intention to sell these tokens presents an opportunity to raise funds to repay creditors, considering the notable surge of SOL’s price in the past year. SOL has experienced a staggering 650% increase, trading nearly four times its price when FTX faced its crisis in November 2022.

Crypto Analyst Forecasts SOL To Shatter Previous ATH

SOL, the fifth-largest cryptocurrency by market capitalization, has continued its remarkable upward trajectory and is currently trading at $147.

The token’s price has increased significantly by 14% in the past 24 hours alone, and over the course of 30 days, it has soared by an impressive 56%. 

Despite this uptrend, SOL remains 43% below its previous all-time high (ATH) of $259, achieved in November 2021. However, crypto analyst Altcoin Sherpa believes that SOL will break its previous ATH during this market cycle, with the only uncertainty being the size of the break.

Altcoin Sherpa suggests that reaching $500 is highly probable, and an even more astonishing milestone like $1000 is not entirely out of the question. The analyst further emphasizes its confidence in SOL’s potential, stating that it remains one of their more substantial investments. Altcoin Sherpa also highlights the next significant level to watch for SOL, which is $170.

Solana

Featured image from Shutterstock, chart from TradingView.com 

Solana (SOL) Hits $144: Analysts Feel Optimistic, Is A New ATH Imminent?

Solana (SOL) has been experiencing some volatility this week, but analysts seem optimistic about an ‘imminent markup’ around the corner. In the past 24 hours, Solana (SOL) has registered a 10.6% increase after breaking through the $140 barrier again.

Solana Rises Above $140

January of 2022 marks the last time Solana’s native token traded above the $140 price range. On Thursday, the fifth-largest cryptocurrency by market capitalization hit a new high and followed the uptrend the crypto market is experiencing.

On March 5, SOL’s price spiked 7.5% after going from $132 to $142. However, the excitement about the cryptocurrency surpassing $140 was short-lived.

The price started what looked like a freefall descent that shredded 16% of the token’s price, stopping at the $119 price range. Throughout Wednesday, SOL’s price continued to move in both directions while trying to stabilize above the $128 support level. The token finished the day hovering between the $130-$132 price range.

On Thursday, Solana picked up some momentum and tested the $141 level before facing a pullback to the $135 support zone. Later, SOL broke through the $140 barrier again as the price skyrocketed to $144, increasing 6.6% in just two hours.

Sol, Solana, SOLUSDT

For the past hour, SOL’s price has hovered between the $140-$142 price range, briefly falling below the $140 support zone. At writing time, the cryptocurrency trades at $142.10, accounting for an increase of 10.6% in the last 24 hours and 9.5% in 7 days. In the 30-day time frame, Solana has seen a stellar price surge of 50.8%.

However, SOL seems to be experiencing a slow market activity. According to CoinMarketCap data, the daily trading volume has decreased by 37.7% in the past 24 hours to $6.4 billion.

Is A New ATH Imminent For SOL?

Pseudonym crypto trader and analyst Bluntz previously forecasted Solana’s next leg up to be around the corner, saying that “the revenge pump is close.” Today, the trader reaffirmed that stance on an X (formerly Twitter) post.

Right before the price hit $140, the analyst posted two charts displaying SOL’s pair with BTC and USDT. The trader highlighted the patterns he previously used to make a prediction in February.

Based on the “nice simple ABC zigzag” with its BTC pair and the “nice sideways accumulation wave 4” with its USDT pair, the analyst considers that an SOL markup is “imminent.”

Related Reading: Ethereum Recovers From Dip: ETH Hits $3,900 For The First Time In Two Years

Moreover, crypto trader Ansem suggested that Solana’s new all-time high might be closer than expected. In an X post, the trader shared a chart exhibiting the price performance of the cryptocurrency.

SOL price, SOL

The chart above shows that SOL’s price of $138 was first achieved in early September 2021. Approximately 60 days later, Solana reached its all-time high of $260. If history repeats itself, according to the trader’s post, we could see “Solana’s new all-time high in less than 60 days.”

Solana On A Roll: Crypto Analyst Predicts Push To $600

Like almost every other crypto token in the market, Solana (SOL) is enjoying a rally of its own, rising to nearly $125 in the last 24 hours. Interestingly, this looks like only the beginning of good things to come for the crypto token, as crypto analyst Hansolar predicts that it could run massively in this bull cycle

SOL To Rise To $600

Hansolar mentioned in an X (formerly Twitter) post that SOL will rise to $600. This “fun” target was laid on the premise that SOL could be the new ETH this cycle. Assuming this is the case, the analyst expects SOL to take off later than BTC and ETH. This is because ETH took off when BTC broke into all-time highs (ATHs) during the last bull run. 

Therefore, SOL, following a similar trajectory to ETH in the last cycle, might not take off until BTC and ETH break into ATHs. Hansolar suggested that SOL’s takeoff will be sparked by retail, stating that there will be a time when these investors buy into the crypto token “as the high beta catch-up play.”

Hansolar also offered more evidence to suggest that SOL is likely to replicate ETH’s run in the last bull cycle. He stated that the crypto token was currently at around 50% from its ATH, similar to how ETH was around the 50% mark as BTC was nearing its ATH in the last cycle. Meanwhile, Hansolar offered “fun” targets for Bitcoin and Ethereum, stating they will hit $150,000 and $10,000 in this bull cycle. 

Interestingly, Hansolar’s $600 price prediction for Solana looks very conservative compared to Crypto YouTuber Jake Gagain’s prediction that SOL will hit $750. The analyst stated that the crypto token will hit this price level by next year. 

Between Solana And Ethereum

Crypto analyst Santiago Santos once echoed similar sentiments to Hansolar when he drew a comparison between Solana and Ethereum, noting that the former is going through what the latter did during the ICO boom. He, however, suggested that Solana would perform way better than Ethereum, as it is seeing “meaningful usage and growth,” unlike Ethereum then. 

Santos further asserted that Solana would “converge on Ethereum faster than most believe.” Solana, commonly referred to as the “Ethereum Killer,” has indeed been on the heels of Ethereum as of late. Solana even once surpassed Ethereum in 7-day DEX (decentralized exchange) volume. 

The tremendous rise in Solana’s network activity is believed to be one of the factors driving SOL’s price and what could push it to hit the $600 mark and possibly $750, like Gagain predicted.

At the time of writing, SOL is trading at around $124, up over 13% in the last 24 hours, according to data from CoinMarketCap. 

Solana price chart from Tradingview.com

Solana Drops Below 100-Day MA On 4-Hour Chart, SOL Price In Danger?

Having failed to break its previous high for the year, the price of Solana has continued to move downward. From the height of $118.88, the coin, which is currently ranked 5th in the crypto space with a total supply of 440,961,455 SOL and a market capitalization of $58.2 million,  has made a drop of over 25% and is not showing any signs of stopping.

As of the time of writing, the price of SOL was up by 2.76% and trading around $102.63, below the 100-day moving average in the last 24 hours. Meanwhile, in the daily timeframe, the price has dropped a bearish candlestick, indicating that the price is still bearish.

The moving average indicator generally is used to determine the trend of an asset, which could be an uptrend or downtrend. Since the price of Solana is trading below the 100-day moving average, could this mean that the price has changed from an uptrend to a downtrend?

Solana On The 4-Hour Chart

A technical examination of the chart from the 4-hour timeframe and with the help of a trend line we can see that two resistance levels of $118.88 and $114.87 have been created by previous price movement. We can also see that the price has broken the support level of $103.57. Therefore, the price for the next destination might be the $92.84 support level. 

This can be seen in the image below:

Solana

Also, taking a look at the 4-hour timeframe chart with the help of the MACD indicator in the above image, we can see that the MACD histogram is trending below the MACD zero line. Both the MACD line and the signal line have crossed and are trending below the MACD zero line, suggesting that the price of SOL is bearish and could continue to move downward.

A final look at the chart with the help of the Bull Power Vs. Bear Power Histogram indicator, we can see that the histograms are trending below the zero line. This suggests that buyers have completely lost momentum in the market, and sellers have taken over it. Thus, the price will tend to move downward. 

We can see this in the image below:

SOL price

Possible Outcomes If The SOL Price Continues To Drop

If SOL continues to drop, we might see the price moving toward the support level of $92.84. Also, if it manages to break below this level, the price might move further downward toward the $79.32 support level.

Presently, Solana is seeing minor upsides of 1.3% in the last 24 hours, according to data from CoinMarketCap.

Solana price chart from Tradingview.com (SOL price)

SOL Prediction: Analyst Bullish On Solana, Time To Buy?

Recently, renowned crypto analyst Altcoin Sherpa gave his positive outlook on Solana (SOL) in an X (former Twitter) post. The analyst reviewed the token’s recent behavior and shared his predictions for SOL’s performance.

Wait For The 20% Dip Or Buy Now?

In the X post, the pseudonym analyst suggested that the fifth cryptocurrency by market capitalization may see a bright 2024, surpassing the heights reached at the end of last year.

The chart displays SOL’s recent behavior, starting in late December 2023 when the cryptocurrency reached its highest price since early 2022. Based on the recent performance shown in the chart, the analyst expects SOL’s price to break above the key resistance levels. However, he predicts a price pullback and market selling during the highs of the price.

As the prediction shows, SOL’s price would surpass the $120 price range before facing a pullback. Then, the pattern would repeat itself, and the cryptocurrency’s price would reach the price level established in December. Following this uprise, the token’s price would face a small price correction before breaking above the $126 price range.

Despite the small corrections seen in the prediction, the pseudonym analyst doesn’t forecast a huge correction happening soon and considers that expecting one is “meh for now.”

Further expressing his view on the possibility of a big price correction, the analyst agreed with a member of the crypto community. The X user highlighted that Solana “just came off a 35% drawdown from 125 to 80” and suggested that “by the time the next big correction comes, [the price] will be much higher than it is now.”

To the analyst, it seems more appropriate to buy SOL now and sit on it for the coming months instead of trying to wait for a 20% correction before buying:

Bullish on this one bigly going into 2024 and I think most would make more $ just buying here and sitting on this thing for months instead of trying to wait for the 20% correction.

Solana (SOL) Sees Green

The month of February has been filled with ups and downs for Solana. At the beginning of the month, Solana’s DeFi ecosystem reached an important milestone after the Solana-based decentralized exchanges (DEXs) surpassed Ethereum’s daily trading volume for the second time.

However, the blockchain saw its 11th outage in 2 years just a week after its DeFi ecosystem’s achievement, with the chain being down for almost five hours. Despite crypto investors’ concerns about the outage, Solana’s price rapidly recovered from the price drop.

SOL recently became the fourth-largest cryptocurrency by market capitalization after surpassing BNB on February 14; since then, Solana has gone back to the fifth spot, with its market capitalization sitting at $49.7 billion, an impressive 19.34% increase in the last month.

Solana’s trading volume in the last day has decreased by 9.20%. According to CoinGecko data, it sits at $1.5 billion, suggesting a recent fall in market activity.

At writing time, the crypto market is seeing green, and Solana’s cryptocurrency is not the exception. SOL is trading at $112.4, accounting for a 1.0% price surge in the last 24 hours and a notable 7.8% increase in the past week.

SOL, SOLUSDT, Solana

Crypto CEO Says Get Ready For Solana To ‘Rally Higher Again’ With New Target

Founder and Chief Executive Officer (CEO) of Evai Crypto Ratings, Matthew Dixon, has expressed optimism about the Solana future price outlook, projecting a new bullish target for the cryptocurrency. 

CEO Predicts Bullish Outlook For Solana

In a recent post on X (formerly Twitter), Dixon shared a Solana and USD pair price chart originally published on TradingView, a crypto analysis platform. The crypto CEO indicated that the ongoing price correction for Solana, identified as “wave 4 (blue)” on the price chart, has not concluded and is expected to experience further declines. 

He predicted that the ongoing wave 4 (blue) would reach a price level similar to Solana’s previous price correction, albeit to a lesser degree. The Evai CEO also anticipates that after the conclusion of the recent correction, Solana may experience a price rally once again.

Previously, Solana witnessed a major surge, nearly surpassing the $125 threshold. However, the cryptocurrency lost a substantial portion of its gains as the bullish hype faded, eventually settling below the $100 price mark at some point. 

Additionally, on Tuesday, February 6, the Solana blockchain was temporarily halted due to an outage, resulting in no new blocks being produced for over 25 minutes. This unexpected disruption significantly impacted the overall sentiment of the cryptocurrency, causing slight declines in the price of SOL. Following this, a solution was coordinated among validators, and the network officially resumed operations. 

Presenting another price chart for Solana, Dixon has projected a new upside target of $120 for the cryptocurrency. The crypto CEO has stated that despite the recent blackout, Solana has maintained both short-term and long-term positive prospects. Nonetheless, investors are advised to anticipate a potential mid-term price correction for the cryptocurrency. 

SOL Price Surges Above $100 Mark

Reports from Santiment, a global market intelligence platform, have also indicated a bullish outlook for Solana. Earlier on Thursday, the crypto data platform disclosed on X that Solana is currently dominating the altcoin market and has become one of the few cryptocurrencies outperforming Bitcoin. 

Santiment shared a price chart illustrating Solana’s recent price action, showcasing a robust climb over the past few days. According to their data, in the last 36 hours, Solana’s price relative to Bitcoin has increased by over 4.5%. 

The cryptocurrency market intelligence platform disclosed that the outage earlier this week has instigated “Fear, Uncertainty and Doubt” (FUD) amongst investors, contributing to the current price rebound in Solana. 

Solana rallied by almost 5% in the last day, and at the time of writing, the cryptocurrency is trading at a price of $105.46, reflecting a weekly increase of 4.39%, according to CoinMarketCap. 

Solana price chart from Tradingview.com

Solana In 2024: Roadmap And Key Price Targets For This Year

The Solana Foundation has unveiled a roadmap for 2024, focusing on innovation, developer engagement and network scalability. “2024 is the year of Solana,” the foundation proclaimed, focusing on the key milestones achieved and strategic goals for the year in the statement.

The “Solana Foundation’s State of Developer Ecosystem Report” highlights a surge in developer activity, with over “2,500 active developers committing to open source repositories” and an impressive increase in developer retention, rising “from 31% to over 50% throughout the previous year.”

The report further elucidated the evolution of Solana’s infrastructure, which in 2023 saw a leap in maturity with the deployment of “program frameworks for Rust, Python, and more,” as well as “SDKs available for 10 languages, laying a solid foundation for diverse dApp development.” Solana Labs’ innovative GameShift API has been a game-changer, a piece of “app-specific tooling” designed to revolutionize the gaming space on Solana’s blockchain.

On-chain data provided by Messari reinforces the network’s growth narrative, citing “a 65% quarter-over-quarter increase in daily average non-voting transactions, reaching 40.7 million, and a remarkable 102% quarter-over-quarter rise in average daily fee payers, amounting to 190,000.”

The roadmap also unveils forthcoming advancements poised to redefine blockchain capabilities. First, Solana aims to introduce “token extensions to empower more complex and multifaceted tokenomics.”

Second, a focus in 2024, will be on the launch of Firedancer, a new independent validator client for the Solana blockchain, built by Jump Crypto. It aims to support a higher number of concurrent transactions, increase network throughput, resilience, and efficiency, and address historical weaknesses in Solana’s peer-to-peer interface. Notably, Firedancer went live on the testnet in October 2023.

A third focus in the 2024 roadmap will be the development of Runtime v2 by Solana Labs, which aims to “significantly enhance the network’s performance and developer experience.”

This runtime is a concurrent transaction processor, handling transactions with specified data dependencies and explicit dynamic memory allocation. It introduces changes coordinated by epochs, influencing the cluster’s behavior. Moreover, Solana Core announced support for the Move programming language as a major modification in Runtime v2.

The Solana Foundation’s message via X echoes a commitment to innovation and community engagement: “The strength of the Solana ecosystem is amplified by our passionate community. With the community’s unwavering support, we are ready to accelerate into 2024 and solidify Solana’s position as the premier platform for blockchain development. It’s time to accelerate. Let’s keep building & make 2024 the year of Solana.”

Solana Price Prediction 2024: A Technical Analysis

A technical analysis of the Solana price action in the weekly chart (SOL/USD) offers predictions for 2024. Since mid-November, SOL’s price movement has been encapsulated within a parallel uptrend channel, indicative of a stable and consistent upward trajectory. The parallel lines representing support and resistance have guided the price action, providing clear levels for potential buy and sell points.

The Fibonacci retracement tool, applied from the swing high of around $262 to the swing low of $7.93, unveils key levels that may act as barriers or support in the future.

  • 0.236 at $69.59: A retracement level that previously acted as resistance and has turned into support.
  • 0.382 at $107.74: This level has been tested and is the next major price target of a weekly close.
  • 0.5 at $138.57: From 2021 till early 2022, this price level acted as strong support, but was turned into resistance in April 2022.
  • 0.618 at $169.41: Often considered the ‘golden ratio,’ this level is crucial for assessing trend continuation.
  • 0.786 at $213.30: Breaching this level could signal strong bullish momentum.
  • 1 at $269.22: As soon as SOL reaches its all-time high, the price discovery phase begins.

Solana price

Extended Fibonacci levels, such as 1.618 at $430.69 and 2.618 at $691.98, offer aspirational targets should the uptrend persist. The latter would be an ultra-bullish price target.

The Exponential Moving Averages (EMA) for the 20, 50, 100, and 200 periods all lie below the current price, confirming the strength of the uptrend. A ‘golden cross’ is evident in mid-December with the 50-EMA crossing above the 100-EMA, traditionally a bullish signal.

The trading volume shows a constructive pattern, with higher volume seen on upswings, a positive sign for continued interest in SOL. The Relative Strength Index (RSI) is positioned around 60, suggesting that while the momentum is upward, there is still room for growth before reaching overbought conditions.

The technical analysis, grounded in the weekly chart’s display of a parallel uptrend channel, robust Fibonacci levels, supportive moving averages, and healthy volume and RSI readings, paints a very optimistic price outlook for Solana in 2024.

Solana Poised For Major Upside: Analyst Predicts 47% Surge After Price Breakout

With the recent approval of Bitcoin exchange-traded funds (ETFs) injecting new inflows and igniting a sense of bullish sentiment in the market, Solana (SOL) is emerging as one of the top gainers in the past 24 hours. 

The cryptocurrency has experienced a 4.5% surge, trading at $99, aiming to reclaim the significant $100 milestone lost during a recent deep correction.

Solana Bulls Targeting $150-$165 Price Range 

Solana, holding the fifth position among cryptocurrencies by market capitalization, could undergo a substantial price surge if the current upward momentum continues and successfully breaks out of its downtrend correction.

Renowned crypto analyst Ali Martinez suggests that Solana is breaking out from a bullish flag pattern formed on the 4-hour chart. 

Solana

A sustained close above the $106 mark can trigger a remarkable 47% rally, propelling SOL towards the price range of $150 to $165.

However, at the time of writing, Solana has retraced below the upper boundary of the bull flag formation, which is positioned at $103. 

Nevertheless, a breakout could be imminent if the growing interest in the token persists alongside a sustained bullish momentum. This scenario would position SOL to regain its previously lost highs and set its course toward Ali Martinez’s price targets within $150 to $165.

SOL Market Cap Quadruples, DeFi, And NFT Metrics Skyrocket

Solana has showcased remarkable performance during the fourth quarter of 2023, positioning itself as a leader in the crypto market rally, according to a recent report by Messari. 

One of the key achievements for Solana in Q4 was its notable increase in market capitalization. SOL concluded the year with a market cap of $43.8 billion, marking a staggering 423% quarter-on-quarter (QoQ) growth and an astonishing 1,106% year-on-year (YoY) increase. 

Solana

This growth propelled SOL to surpass notable tokens such as ADA, USDC, and XRP in market cap, securing the 5th position among all tokens. It is worth noting that Solana began 2023 ranked 17th in market capitalization, highlighting its exponential rise in prominence.

The Solana network’s decentralized finance (DeFi) Total Value Locked (TVL) also experienced significant growth. Solana’s DeFi TVL increased by 303% QoQ and an impressive 505% YoY, reaching $1.5 billion. 

The report also highlights the notable increase in DeFi volume on the Solana network. The average daily spot DEX volume experienced a staggering 1,116% QoQ growth, reaching $359 million. 

Among the contributors to this growth, Orca accounted for 45% of the Q4 volumes, followed by Raydium with a 29% market share. Phoenix, a fully on-chain central limit order book, stood out by averaging over 9% of the DEX volume market share.

Solana’s influence in the NFT space also saw substantial growth during Q4. The average daily NFT volume increased by 356% QoQ, reaching $4.8 million. Solana’s market share of NFT volume, excluding Bitcoin, grew from 9% to 26% QoQ, demonstrating its increasing significance in the NFT market.

Solana

Featured image from Shutterstock, chart from TradingView.com

Epic Rally Alert: Solana Hourly Chart Reveals Bull Flag Formation, SOL Targets $163

Solana (SOL), the fifth largest cryptocurrency by market capitalization, has experienced a significant surge after undergoing a correction from its 20-month high of $125, reached on December 25.

Following a dip to the $85 level on Monday, January 8, SOL reclaimed the $100 level again, demonstrating a 6.4% surge in the past 24 hours. 

Moreover, technical analysis indicates a potential bullish continuation pattern known as a bull flag in Solana’s 1-hour chart, which suggests the possibility of further price gains beyond the previous high. 

Solana Optimism For Price Breakout

Technical analyst Ali Martinez has identified a bullish pattern known as a bull flag formation on Solana’s hourly chart. A bull flag is characterized by a consolidation period following a strong upward move. 

In this case, the dip to the $85 level could be considered the consolidation phase. The formation suggests that SOL may experience another significant upward move shortly.

Solana

As seen in the chart above, to confirm the validity of the bull flag pattern, SOL needs to achieve a decisive close above the $110 resistance level. Such a breakthrough could catalyze upward momentum and propel the price to new highs.

If the bull flag pattern holds, Ali Martinez anticipates that SOL could aim for an ambitious target of $163. However, Solana faces multiple resistance levels that it must overcome to reach the potential target indicated in Ali Martinez’s hourly chart analysis. 

The $110 resistance, the $120 mark, and the previous 20-month high of $125 present significant hurdles for Solana’s price action. These levels have the potential to impede further upward movement, as they have previously acted as resistance during the bear market of 2022. 

Additionally, the $132 and $137 levels are anticipated to provide additional resistance, as they were the price points from which Solana’s price decreased in April 2022. 

Lastly, the $151 and $154 levels will serve as the final thresholds for Solana’s bears to hold if they aim to halt any potential price increase before reaching the $163 target.

Solana’s Ecosystem Consistent Growth 

Despite the volatility in SOL’s price over the past month, Token Terminal data reveals consistent growth in Solana’s blockchain ecosystem. 

According to the data, Solana’s circulating market cap has surged impressively to $43.54 billion, representing a substantial 20.08% increase in value over the last 30 days.

Moreover, the fully diluted market cap has surged to $57.13 billion, reflecting an 18.82% growth, which illustrates a strong investor interest in Solana and its potential for future growth.

Solana’s revenue has also experienced substantial growth over the past 30 days, with a staggering increase of 217.18% to reach $5.68 million. On an annual basis, the revenue has reached an impressive $69.12 million, exhibiting a remarkable surge of 142.15%.

Ultimately, Solana’s fees have significantly increased over the past 30 days, with an increase of 217.18% to $11.36 million. On an annualized basis, the fees amount to $138.24 million, marking a substantial growth of 142.15%, reflecting the network’s growing usage and transactional activity.

Solana

Featured image from Shutterstock, chart from TradingView.com 

Solana Price Could Reach $1,000, Analyst Explains Why

Crypto analyst Jacob Canfield has laid out a comprehensive analysis, suggesting Solana (SOL) could be on the brink of an unprecedented market surge. “In my opinion, I think that Solana is going to continue to be one of the biggest movers during this current bull market cycle,” Canfield states, proposing that Solana could potentially escalate its market dominance to the 12-15% range.

Can Solana Hit $1,000?

Canfield bases his analysis on several indicators. He highlights the Solana Dominance (SOL.D) chart, noting that at the peak market cap, it didn’t even crack 3%. Given the current trends and the breakout of SOLBTC from its weekly resistance, Canfield envisions a scenario where Solana could enter a parabolic rally phase, which is further supported by the SOLETH chart showing a similar pattern. “SOLETH – Also currently broke out of a weekly resistance and looks to be forming a parabolic rally against it.”

Solana / ETH

A significant factor in Canfield’s analysis is the current state of Ethereum Dominance (ETH.D). He notes that ETH.D is breaking down from a long-term trendline and losing the 200 weekly moving average, now sitting at 17%. “If Solana continues to trend against Ethereum and it continues to break down to 2019-2020 levels, we could see SOL as the big winner this cycle,” Canfield explains.

However, Canfield does not disregard the potential ramifications of recent news regarding an Ethereum ETF. “This may not play out with the current ETF announcement news as it will bring more attention,” he acknowledges, indicating that an approved Ethereum ETF could shift investor focus and capital back to Ethereum, potentially tempering Solana’s ascent.

Despite potential headwinds from the Ethereum sector, Canfield emphasizes Solana’s robust partnerships with corporate giants like Google, Circle, and Amazon, positing that these collaborations could significantly drive adoption and enhance Solana’s visibility in this cycle of the crypto market.

Furthermore, Canfield’s analysis extends beyond charts and partnerships. He delves into the Solana ecosystem, spotlighting projects that are paving the way for its expansion. From decentralized finance protocols and automated market makers to NFT storage solutions and governance tokens for gaming platforms, Canfield points to a breadth of innovation within Solana that parallels, and in some aspects, seeks to outdo Ethereum’s ecosystem.

In light of the FTX debacle, Canfield remarks on the psychological impact on Solana’s market sentiment, noting that with Sam Bankman-Fried’s legal troubles, there is an opportunity for Solana to redefine itself. “There’s a bit of PTSD around the ecosystem, but it’s time to become its own entity and forge its own future,” he asserts, suggesting that Solana’s future will be shaped by those who are deeply integrated into its ecosystem, from developers to traders and influencers.

His conclusion: “Solana could triple or quadruple it’s all time high market dominance around 12-15% and if it continues to trend against Bitcoin, could easily see a $1,000 per coin and take the #2 spot behind Bitcoin.” When asked about the potential of Ethereum, Canfield emphasized, “No reason to not have allocations to both. It’s like trying to bet on Microsoft or Google. Tesla or Ford: Just buy both.”

Short-Term SOL Price Outlook

On the shorter-term horizon, analyst Rekt Capital brings attention to Solana’s price movements in a recent post on X. “Solana continues to outperform in the market. In 2021, SOL upside deviated to $53 and then $61 before retracing to the bottom of the purple box,” he noted, referring to a specific zone on the price chart that has historically acted as both resistance and support.

SOL/USD

In the Rekt Capital chart, SOL is currently breaking out above the zone. However, if history repeats itself and the zone once again acts as strong resistance, the SOL price could suffer a severe pullback. Using the green arrow in the chart, Rekt Capital paints a scenario in which SOL initially falls back towards $30 before the price rises again towards $42.

Solana (SOL) Leads Gains Among Top Coins, Can Bulls Send The Price To $40? 

SOL ranks among the bullish cryptocurrencies today, benefitting from the ongoing rally in the crypto market. $40 looks more realistic since SOL overcame the psychological resistance level of $20. 

Based on its present trajectory and exciting events in the Solana community, investors wonder if it will attain $40 in the coming days. The technical indicators in the chart below will uncover SOL’s price trajectory in the coming days. 

SOL Testing $36.69 Resistance, Will The Bulls Rally To $40?

SOL is in an uptrend on the daily chart, forming a third consecutive green candle as the buyers continue accumulating. Remarkably, SOL flipped the $33.05 resistance level to support on October 30 and is testing the $36.69 support today, October 31. 

The Relative Strength Index (RSI) indicator displays a value of 77.78, already in the overbought region above 70. The RSI shows no signs of a decline, implying that more buyers are opening long positions for SOL. 

Furthermore, the Moving Average Convergence/Divergence (MACD) indicator is above its signal line, displaying a strong buy signal. This signal is confirmed by the green Histogram bars formed on October 30 and today. 

Therefore, SOL will likely rally to the $40 resistance level in the coming days if the buyers push it above the $36.69 resistance level.

However, if rejection occurs at $36.69 and the RSI retraces from the overbought level, buyers must apply a trailing stop loss to curtail massive losses. 

Nevertheless, SOL looks well positioned to return to $40 based on its strong support level at $33.05. Also, some exciting developments in the Solana community are driving more investors to the ecosystem and boosting SOL’s price. 

SOLUSD price chart

Solana’s Launch Of Block Explorer Amidst Other Developments

Solana Developers, on October 30, announced that Cymbal’s Human Readable Block Explorer now supports Solana. It’s worth mentioning that Solana has organized over 466,000 NFT projects, has over 10 million active wallets, and tracked over 36 million tokens in real time. The Cymbal AI helps Solana users keep track of their activities with ease and is a welcome development in the ecosystem. 

Also, there is much excitement in the crypto community for the ongoing Solana Breakpoint 2023 annual conference that began on October 30. This event is in Amsterdam, Netherlands, with notable speakers taking vital topics surrounding blockchain technology.

The first day of the event featured an address from JavaScript co-founder and Brave CEO Brendan Eich. According to Eich, there are massive integrations with Solana support coming to the Brave browser in 2024. This announcement by the CEO is likely driving the adoption of SOL tokens ahead of a potential price surge above $40. 

Additionally, Phantom Mobile announced the creation of an NFT feature not available on their mobile devices but supported by Solana. According to the developers with Camera Mint on Phantom Mobile, users can instantly convert photos and videos into Solana NFTs using the app. 

The diversity of the Solana ecosystem makes it ideal for most investors since its tokens are still quite affordable. Therefore, SOL could rally in the coming days if the buyers continue the ongoing accumulation phase.