Bitcoin Traders Closing More Positions As Prices Range Above $60,000

Bitcoin has been trending lower after failing to break above $66,000 in early May, deflating hopes of immediate price gains post-Halving. Taking to X, one analyst shared on-chain data that paints a more nuanced picture than a simple loss of confidence in recent weeks. 

Bitcoin Open Interest Remains Low: Bullish?

The analyst, pointing to CryptoQuant data, observes that leveraged traders on perpetual trading platforms like Binance appear to be closing their positions more than opening new ones. The analyst notes that the reading is at -20% at the monthly change in Open Interest. 

BTC open interest in one month | Source: Analyst on X

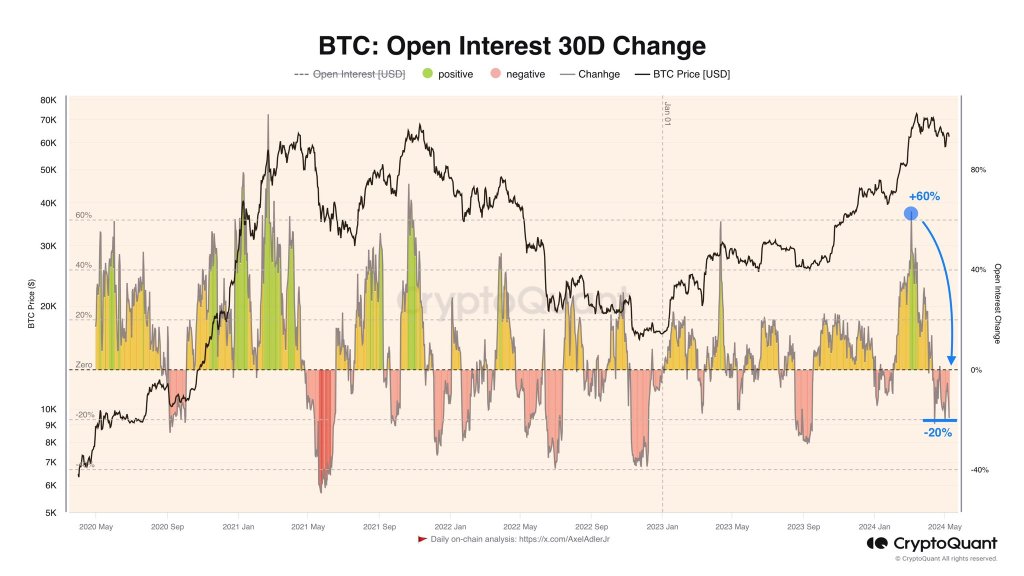
At this level, it shows that more traders are closing more positions than opening new ones. This development suggests that most traders adopt a strategic wait-and-see, watching prices evolve.

Despite the decrease in positions opening, it’s important to note that this is not a sign of BTC’s downfall or the invalidation of a potential surge. The analyst interpreted this contraction as a strategic move by traders, who are cautiously optimistic and not exiting the market due to bearish expectations. 

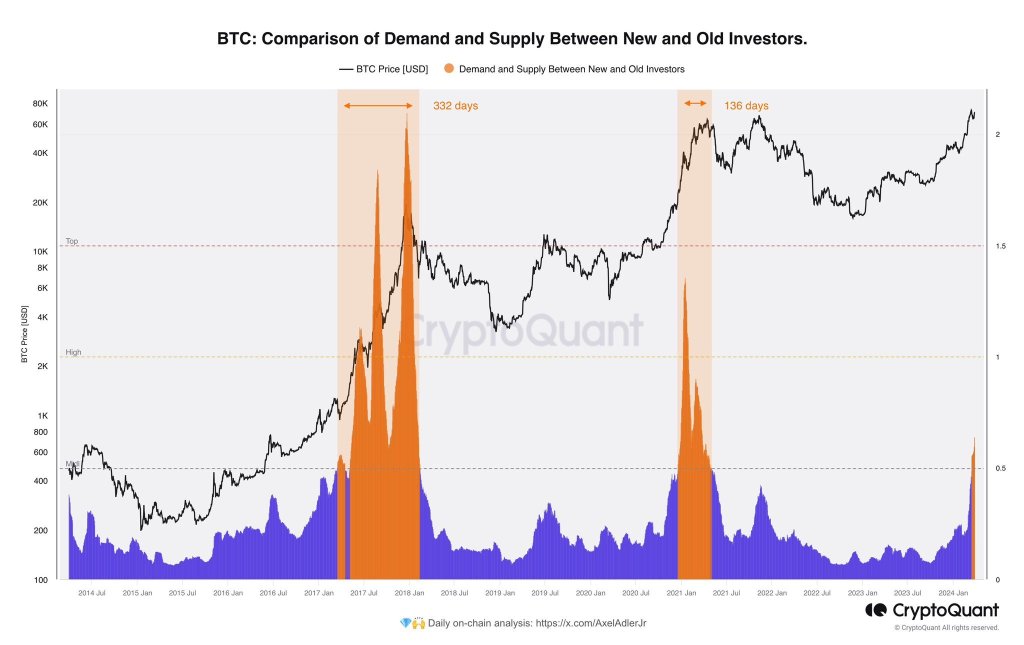
In a separate post, the analyst added that the Bitcoin market needs the current wave of liquidation and “negativity” for accumulating short positions. All short positions opened at spot levels bet that BTC will continue trickling lower, even breaking below $56,500. 

BTC long liquidation dominance | Source: Analyst on X

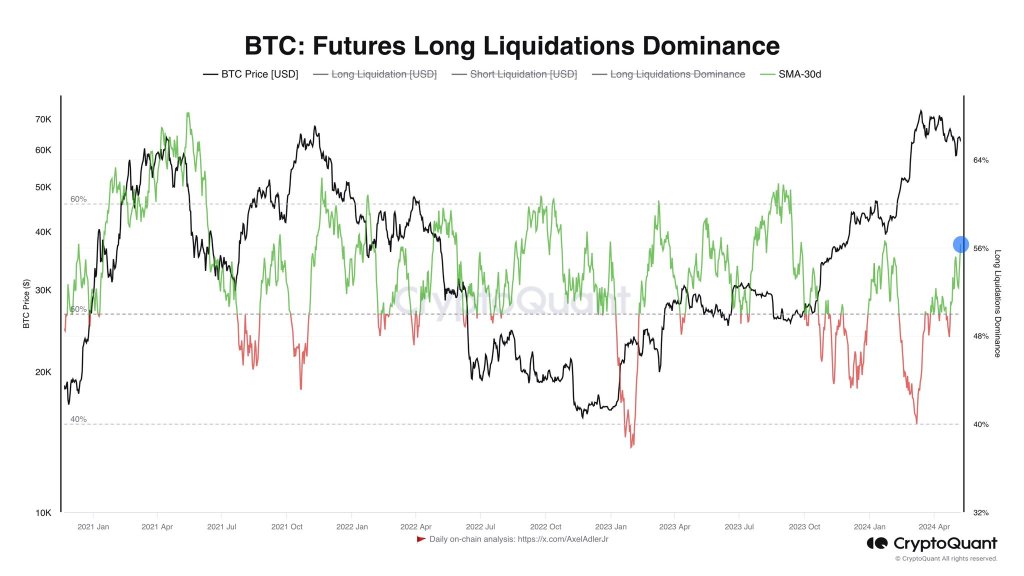
However, the more short positions there are, the higher the possibility of a “short squeeze” forming. When this happens, there will be a sudden price spike, liquidating shorts and forcing sellers to buy back into the market to prevent further damage. 

BTC Inside A Trade Range: Will $60,000 Fail?

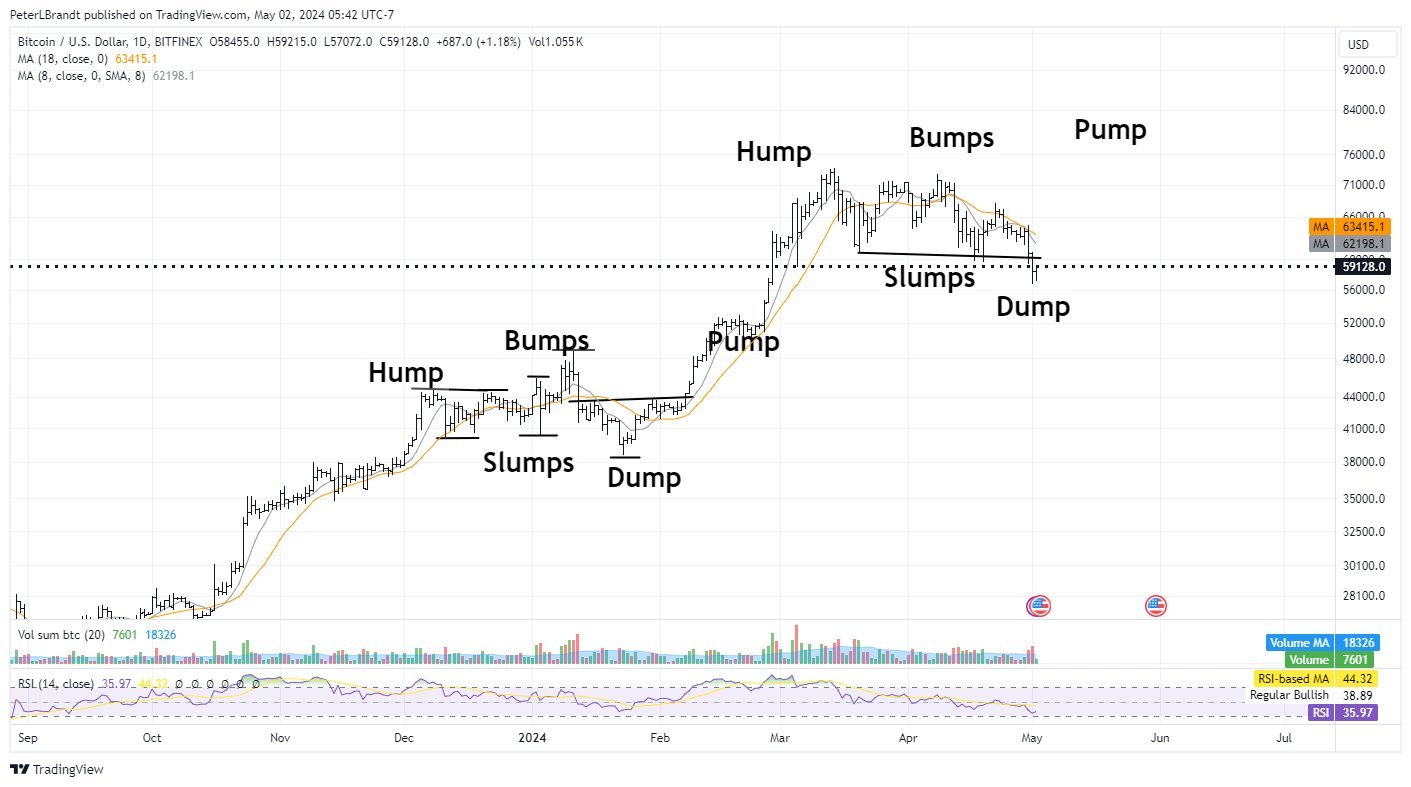
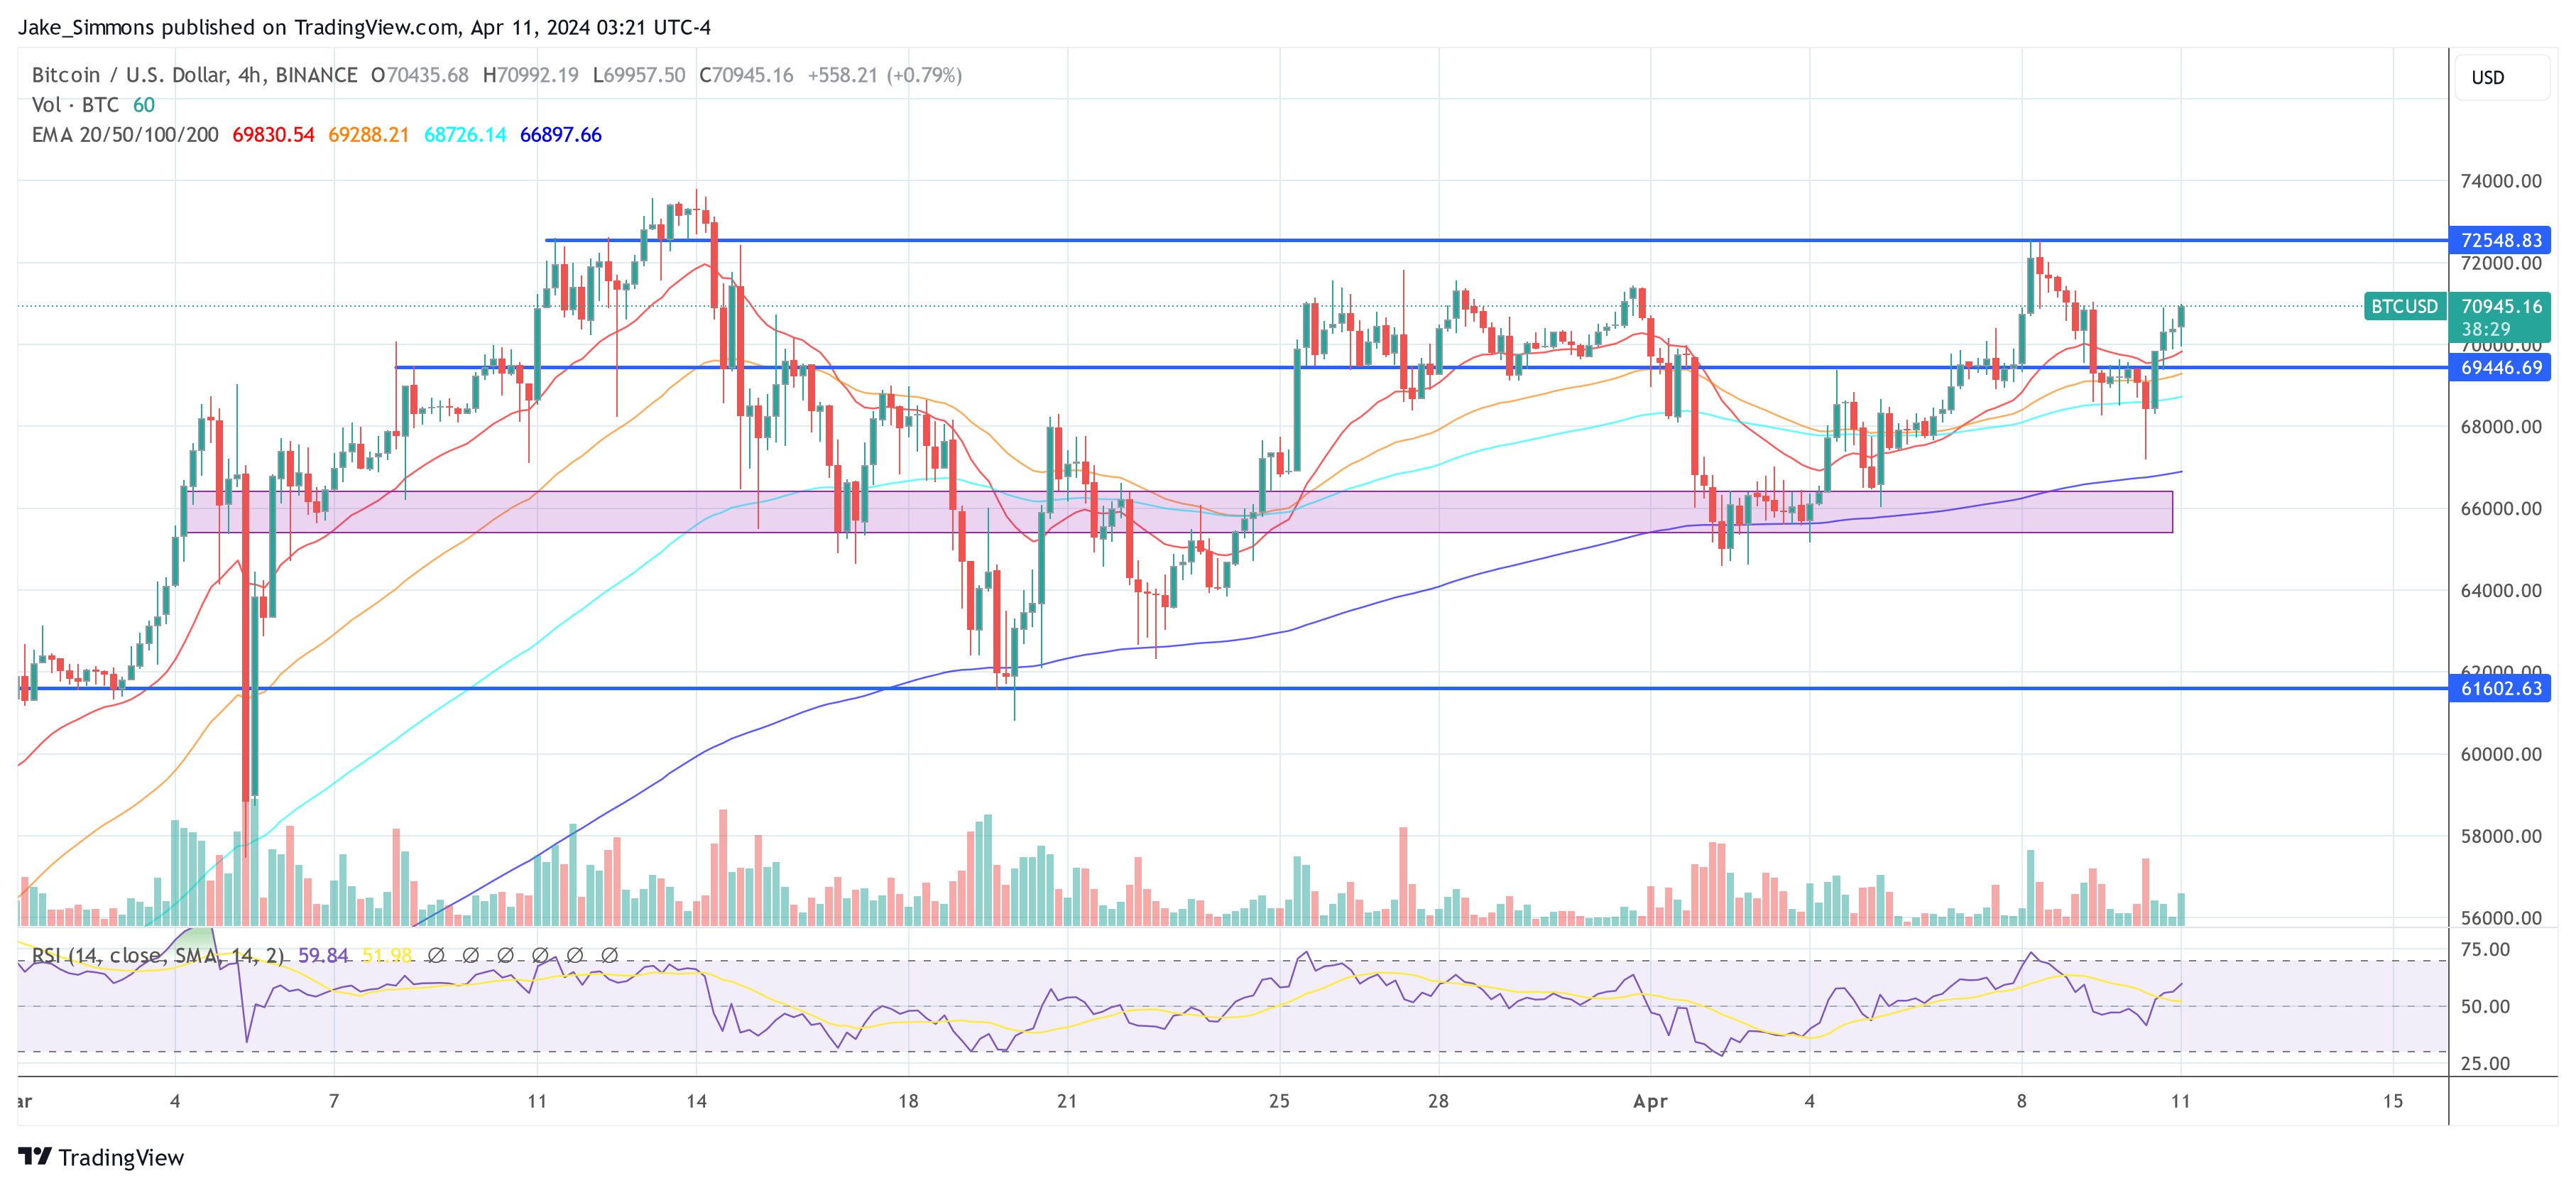
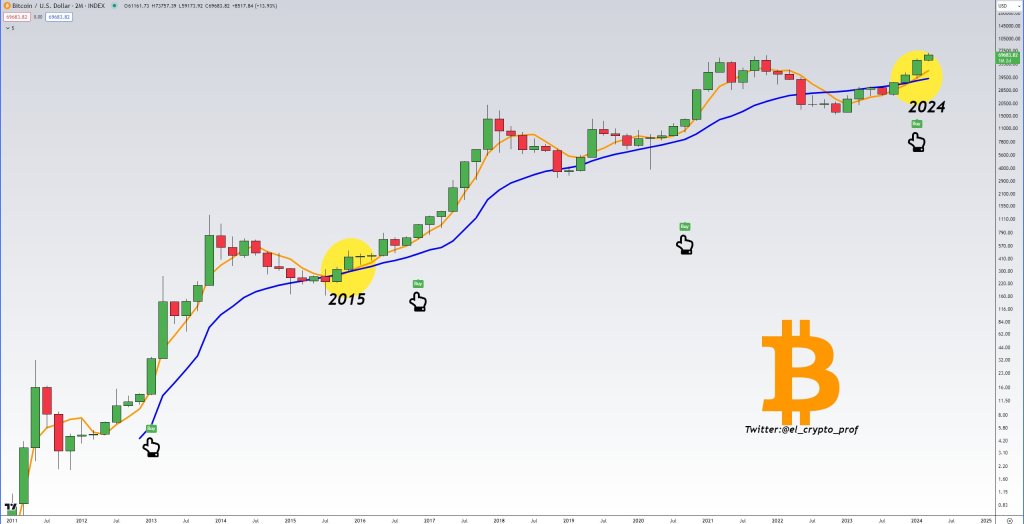
Despite the potential upside hinted by on-chain data, prices remain confined within a narrow range. Last week, bulls failed to close above $66,000, confirming the impressive march from May 3.

Bitcoin trending sideways on the daily chart | Source: BTCUSDT on Binance, TradingView

Bitcoin found resistance and is moving lower toward the psychological $60,000 level. From price action, losses below this line might fast-track the collapse toward $56,500 registered in early May. 

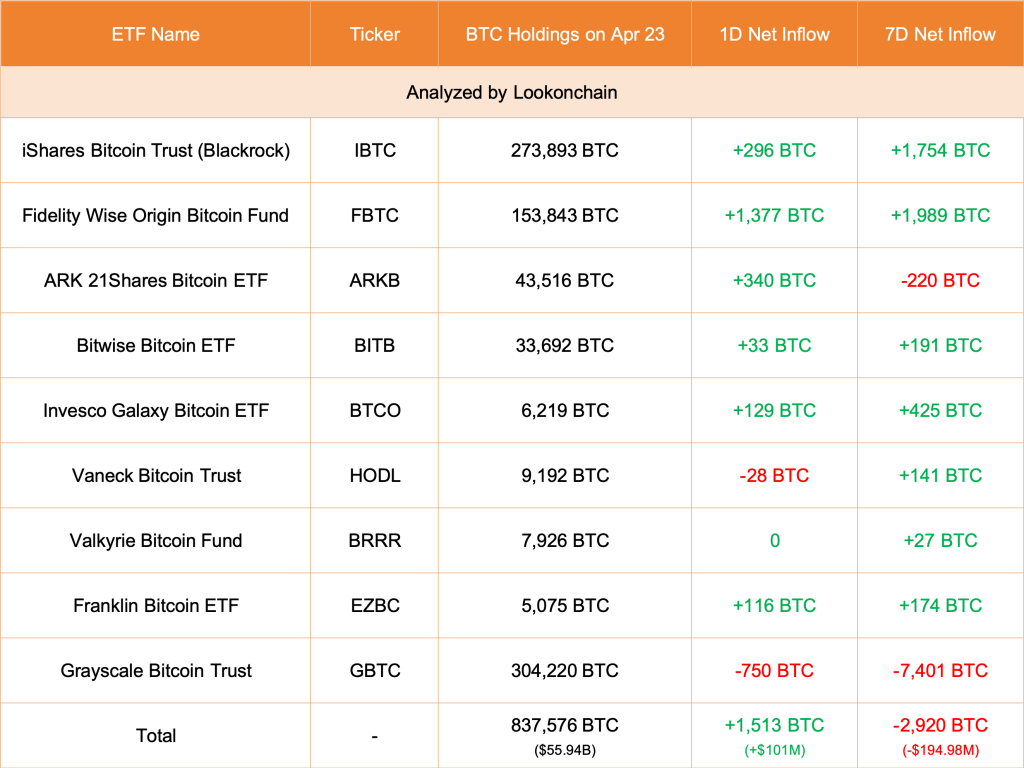
Going forward, traders will closely monitor how prices evolve after the all-important Halving on April 20. Considering the approval of spot Bitcoin exchange-traded funds (ETFs) and the involvement of institutions, some analysts expected prices to shoot higher immediately.

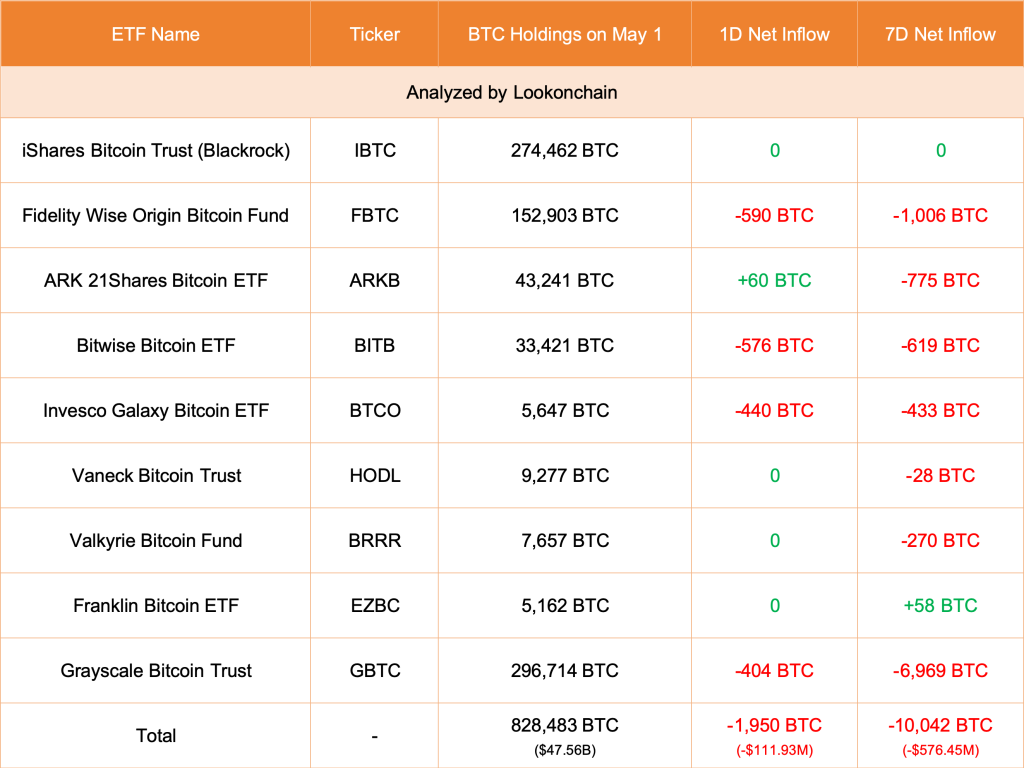
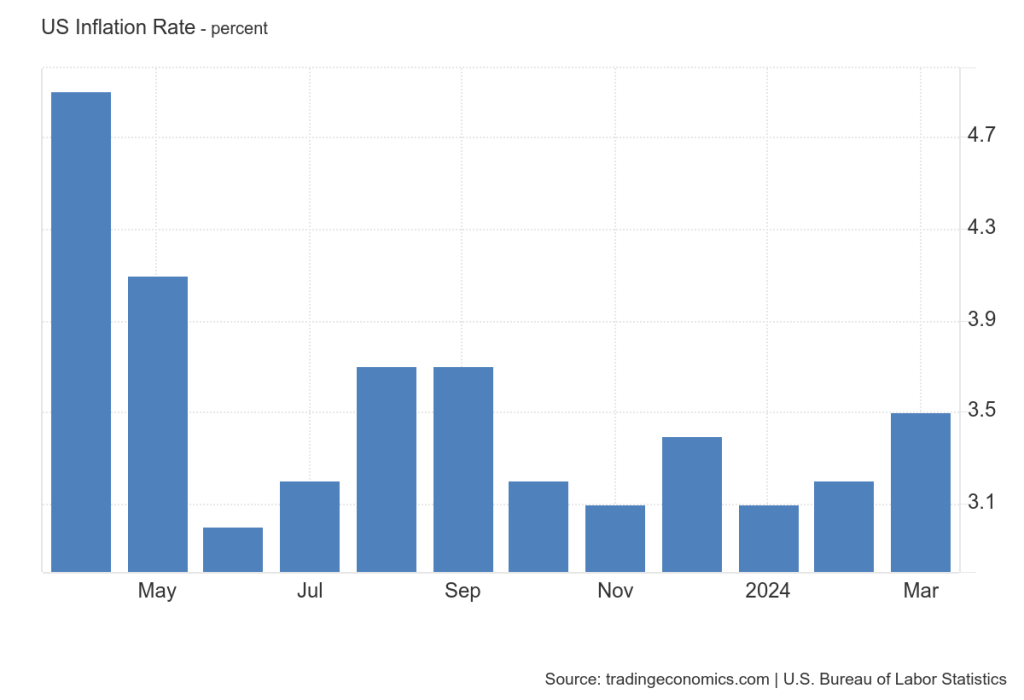
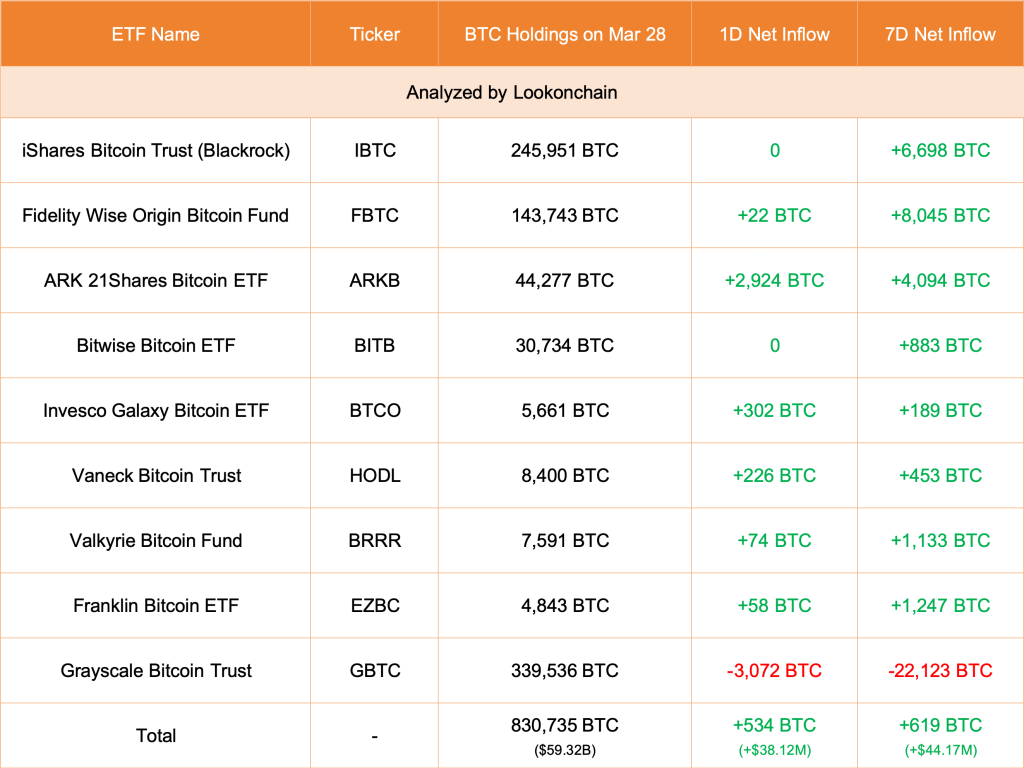
Nonetheless, this has not been the case. Prices continue to hang amid fluctuating inflows to spot ETFs, and the United States Federal Reserve is still not slashing interest rates.

Bitcoin Bottom In? Retracement From $73,800 Is Deeper And Took Longer To Form

Some analysts were frightened by the recent drop in Bitcoin prices. Though the coin is showing signs of strength, multiple leveraged longs were liquidated early this week.

In a post on X, one analyst thinks Bitcoin might have just found support, bottoming up after the contraction this week, pushing it lower from the multi-week range established in mid-March through to the better part of April.

 Bitcoin Retracement Is Deeper And Took Longer: Bottom In?

Expressing confidence, the analyst cited a historical pattern. Based on a price action assessment in the weekly chart, the analyst notes that whenever Bitcoin posts a deep retracement, there is usually a higher probability of the coin bottoming up and shaking off weakness.

At the same time, prices tend to recover after a retracement that takes longer than expected. 

BTC retracements over time | Source: Analyst on X

Building on their historical pattern observation, the analyst applied it to the current BTC situation. The trader said up to the current level, the retracement from an all-time high is deeper and also took longer than usual, spanning several weeks. As a result, the analyst projected a high likelihood that Bitcoin prices might have found a bottom. 

While confidence abounds, it is still challenging to pick bottoms. Bitcoin and crypto assets are volatile, with prices moving quickly in either direction. At spot rates, Bitcoin is trading above $60,000, reversing losses of May 1.

Even though this might cement the analyst’s position, BTC remains within a bear breakout formation, defined by the wide-ranging, high-volume bear bar of April 30.

Bitcoin price trending upward on the daily chart | Source: BTCUSDT on Binance, TradingView

Moreover, the coin is still boxed away from the April trade range, suggesting that weakness remains. Should there be a conclusive close above $62,000, the trend will likely shift in favor of bulls, reversing the losses of April 30.

Before then, aggressive traders might be unloading at higher prices, aligning with the current bearish formation.

Market Forces Will Shape BTC Prices

Despite the bearish outlook, most analysts are bullish, expecting a sharp price recovery. One of them took to X, suggesting that buyers will likely take charge if prices recover from spot rates and return to the horizontal range of March to April.

BTC must move back to range for uptrend continuation | Source: Analyst on X

The pace and direction at which prices move going forward lean on market factors. So far, spot Bitcoin exchange-traded fund (ETF) issuers are decreasing their holdings.

At the same time, the United States Federal Reserve is tracking inflation and other metrics as they tune monetary policy. If inflation drops, the USD will likely strengthen, heaping more pressure on the world’s most valuable crypto.

Bitcoin Slump Pushes New Whales Underwater: A Rare Opportunity To Buy?

As Bitcoin slumps, on-chain data by Ki Young Ju, the founder of the blockchain analytics platform CryptoQuant, paints a stark picture: all new whales, including holders of spot exchange-traded funds (ETFs), are now underwater. 

New Whales And Spot ETF Investors Are In Red

Taking to X, Ju said that more losses would be incoming, predicting that HODLers will find “max pain” at around $51,000. The dip is less than $10,000 from spot rates, suggesting that although there are cracks, the correction might not be deep.

This overview is welcomed, considering the recent sell-off. Even so, predicting price bottoms in a fast-moving market influenced by multiple forces is tough.

New BTC whales are underwater | Source: Ki Young Ju on X

As price action stands, Ju says believers may take the opportunity to double down on the coin. The founder adds that the current price discount presents an opportunity for savvy investors to outperform traditional finance whales, including institutions with BTC exposure via spot ETFs in the United States. 

Bitcoin price trending downward on the daily chart | Source: BTCUSDT on Binance, TradingView

Bitcoin is under immense liquidation pressure at the time of this writing. Though bulls soaked up the sell-off earlier today, the coin remains within a bearish breakout. Prices are trading below the support zone of between $60,000 and $61,000 and below April 2024.

Inflow To Spot Bitcoin ETFs Decline As Sentiment Deteriorate

This formation suggests that though bulls are optimistic, the path of least resistance remains southwards for now. BTC dropped after posting impressive returns from October 2023 to March 2024, when prices peaked. Some analysts think the current cool-off is inevitable following sharp gains in the last six months.

The fact that whales are underwater was unexpected, considering the state of affairs in the last week of April. Then, the inflow from new whales nearly doubled the cumulative holdings of older whales. Analysts said this influx of fresh capital pointed to growing institutional interest.

However, looking at the current price action, new whales are now in the red territory, and their excitement seems to wane. 

According to Lookonchain data, inflow into the eight-spot Bitcoin ETFs, including BlackRock, has stalled. On May 1, all issuers, including Grayscale via GBTC, decreased by 1,950 BTC. Of note is that BlackRock’s IBIT has not seen inflows for five straight days.

Spot Bitcoin ETF tracker | Source: Lookonchain via X

Still, confidence abounds. Inflows into spot Bitcoin ETFs are highly influenced by sentiment, which rests on how prices perform. If BTC shakes off the current weakness and tears higher in the expected post-Halving rally, spot ETF issuers will begin receiving new inflows. 

$59,600: Analyst Explains Why Bitcoin Must Stay Above This Level

Bitcoin bulls may soon be back in business. According to Willy Woo, an on-chain analyst, market data shows that urgent “market sells” responsible for forcing the coin from all-time highs are now falling. This development may prop up prices, preventing further sell-offs.

Bitcoin Selling Pressure Easing

This preview is due to falling Cumulative Volume Delta (CVD) data, an on-chain indicator that can also track market sentiment. Specifically, it tracks buying and selling aggression from market participants. Now that CVD is dropping, Woo says more BTC holders are likely willing to weather the storm. Their decision may directly support prices. 

Bitcoin CVD data | Source: Willy Woo on X

Woo adds that BTC must reject selling pressure and end the current short-term weakness as things stand. As on-chain data shows, BTC should stay above $59,600. The CVD lie has historically separated bullish and bearish zones. 

Based on this, BTC should remain above the $60,000 round number for the uptrend to be sustained. If not, and bears take over, pressing prices lower below the CVD level could signal the beginning of a new bear regime.

Thus far, BTC is under immense selling pressure, shaving approximately 15% from all-time highs. The coin has support at around the $60,000 and $61,000 zone, moving inside a range. Resistance is at an all-time high of around $74,000 on the upper end. 

Bitcoin price trending sideways on the daily chart | Source: BTCUSDT on Binance, TradingView

Based on this preview, any losses below $60,000, as Woo notes, would likely see BTC dump. The coin might drop to $53,000 in the short term, torching stop losses and fueling the sell-off.

Will Hong Kong Spot ETF Launch Lift Prices?

Whether BTC bulls will flow back depends mostly on institutional involvement in the days to come. Following the approval of spot Bitcoin exchange-traded funds (ETFs) in January, prices spiked higher, breaking previous all-time highs.

Institutional involvement has been vital. However, inflows have slowed down, especially in the last two weeks of April. Analysts are now looking at the launch of spot Bitcoin ETFs in Hong Kong on April 30. 

In a recent interview, Zhu Haokang, the Head of Digital Asset Management in Hong Kong, is bullish. Haokang expects trading volume to eclipse those seen in the United States. The executive says the product is unique, allowing for a physical subscription that’s more attractive for BTC miners. Moreover, it is global, drawing interest from Singapore and the Middle East investors.

Bitcoin Under Pressure But Whales Hold Over $331 Billion Of BTC: A Sign To Buy?

While Bitcoin prices struggle for momentum and are caged inside a narrow range, on-chain data tells a different story. Taking to X, one analyst notes that whales, which are large crypto holders, are actively accumulating the world’s largest coin by market cap. 

BTC whales accumulating | Source: Analyst via X

Bitcoin Whales Accumulating Despite Weakness

By the time this data was shared, Bitcoin whales held over 5.1 million BTC worth a staggering $331 billion. That there is still demand when the coin moves in a narrow range flies in the face of recent market weakness and skeptics betting on even more price dumps.

Currently, Bitcoin is inside a range, with caps at $73,800 and $60,000. Despite overall market confidence, the coin has failed to pull higher, breaking above $70,000 even after Halving on April 20. Even though prices are firm, the absence of follow-through after April 21 and 22 hints at weakness.

Bitcoin price trending sideways on the daily chart | Source: BTCUSDT on Binance, TradingView

From the BTCUSDT price chart, the coin could explode should it break above the middle BB. If the leg up is accompanied by positive fundamental events, momentum could push the coin to all-time highs.

On the flip side, BTC is likely to slip even lower should sellers flow back. The sharp rejection of bulls on April 24 is bearish. As such, this might set a wave of lower lows in motion, taking the coin below April 2023 lows.

Traders Panicked Sold, Register Huge Losses

Parallel market data shows panic sellers on Binance and OKX, two major crypto exchanges by trading volumes, have dumped a combined 5,137 BTC at a loss over the past two weeks. As data shows, prices have been weaving lower during this time, with bulls failing to counter the dump, especially after two consecutive losses on April 12 and 13.

Meanwhile, there have been sharp outflows from ARKB, the spot Bitcoin exchange-traded fund (ETF). Data shows that ARKB sold 490 BTC, worth $31 million, on April 25. This is the third-largest single-day outflow in history.

ARKB outflows | Source: Analyst via X

Recent price pressures on BTC coincide with a marked drop in spot ETF inflows in the second half of April. On April 25, Lookonchain data revealed that GBTC and all the nine spot ETF issuers decreased over 2,100 BTC worth roughly $135 million.

Old Bitcoin Whales Moving Coins: Will This Help Push BTC Above $74,000?

While Bitcoin struggles to extend gains, on-chain data shared by Ki Young Ju, the founder of CryptoQuant, on X shows increased movement of old coins. As the Bitcoin Average Dormancy chart shows, this trend recently hit a 13-year high. 

More Old Whales Moving Coins

The Bitcoin Average Dormancy shows the average number of days each BTC has been dormant. On-chain data indicates that coins held for 3 to 5 years have changed hands and moved to new owners. 

BTC dormancy chart | Source: CryptoQuant

While there was movement, interestingly, data shows that they were not transferred to exchanges. Instead, it is highly likely that they were traded over the counter (OTC).

Usually, any transfer to centralized exchanges like Binance or Coinbase could suggest the intention of selling. The more coins hit these exchanges, especially from whales, the higher the chance of price dumping. However, if trades are made via OTC, the impact on spot rates is negligible, which is a positive for bulls.

Further analysis of these transfers using the Spent Output Profit Ratio (SOPR) indicator suggests that whales moving them made decent profits. Historically, whenever whales dump and register profits, prices tend to dip.

Will Bitcoin Prices Retest All-Time Highs

However, in a post on X, one analyst says prices will likely increase because of the impact of spot Bitcoin exchange-traded funds (ETFs). These derivatives are like a buffer against price drops, considering the pace of inflows in the past weeks.

Spot ETFs allow institutions to gain regulated exposure to BTC. Coupled with decreasing outflows from GBTC, the odds of prices rising remain elevated. 

According to Lookonchain data, GBTC unloaded 750 BTC on April 23. However, Fidelity and other eight spot ETF issuers bought 1,513 BTC on behalf of their clients. Spot Bitcoin ETF issuers sell shares representing BTC holdings. These coins can be purchased from secondary markets like Binance, via OTC platforms, or directly from miners. 

Spot Bitcoin ETF flow data | Source: Lookonchain

BTC prices remain muted and capped below $68,000, representing April 13 highs.

To define the uptrend, there must be a high volume expansion above this liquidation line, reversing recent losses. 

Bitcoin price trending downward on the daily chart | Source: BTCUSDT on Binance, TradingView

Even so, looking at the BTCUSDT candlestick arrangement in the daily chart, bulls must break above all-time highs for a clear trend continuation. Ideally, the uptick above $73,800 and the current range should be with expanding volumes, confirming the presence of buyers.

This Metric Printed In 2017 Before Bitcoin Exploded: Is A Mega Run Incoming?

In a post on X, one analyst has picked out a key on-chain metric that could signal the beginning of a strong leg up, similar to the explosive gains 2017. Currently, Bitcoin prices remain steady and edging higher. However, the coin failed to register sharp upswings, as most traders had predicted before the Halving event on April 20.

Flow Indicator Dips: A Bull Run In The Making?

Taking to X, the analyst said there has been a sharp drop in the 7-day average Flow indicator at leading crypto exchanges like Coinbase and Binance. When this was highlighted, the Flow indicator pointed to a decline from 161,000 to 76,000 BTC, a nearly 50% drop. 

BTC daily exchange flow | Source: Analyst on X

Interestingly, a similar pattern emerged in 2017 before Bitcoin embarked on a historic bull run.

The analyst said the Flow indicator dropped to 64,500 BTC across exchanges days and weeks later before prices exploded to around $20,000 in December 2017. 

Bitcoin price trending upward on the daily chart | Source: BTCUSDT on Binance, TradingView

For now, only time will tell if Bitcoin is preparing for a strong leg up. The coin remains within a bear formation, looking at the candlestick arrangement in the daily chart. Even though prices rose after Halving Day on April 20, sellers are in charge. As it is, the April 13 bearish engulfing pattern continues to define price action. Technically, a close above $68,000 might be the foundation for a rally towards $74,000 in the days ahead.

Bitcoin Supply Rapidly Shrinking

While the Flow indicator points to declining BTC across exchanges, another analyst has discovered an interesting development. Taking to X, another analyst noted that the available Bitcoin supply dipped below 4.6 million for the first time before April 20, when the network halved miner rewards. 

BTC supply falling | Source: Analyst on X

Since Halving reduces daily emissions by half, even if the current demand is sustained, the analyst says a supply squeeze will drive prices higher. Even so, as mentioned earlier, whether BTC will rally depends on the pace at which immediate resistance levels are cleared.

Historically, prices tend to rally a few months after Halving Day. However, in the past few months, there have been notable deviations. For instance, prices soared to all-time highs before Halving Day. This is the first time this has happened.

Beyond technical formations, the United States Securities and Exchange Commission (SEC) approved the first spot Bitcoin ETFs in January 2024. Through this product, institutions are free to gain exposure through shares. These shifting dynamics will shape price action in the current epoch, possibly leading to new deviations from historical performances. 

Conservative Projection Places Bitcoin At $245,000 In 5 Years

A recent analysis paints a rosy picture of Bitcoin’s future, even with a conservative growth projection. Taking to X, Michael Sullivan predicts that the world’s most valuable coin could reach a staggering $245,000 within just five years if it maintains a mere 30% compound annual growth rate (CAGR). 

Bitcoin Projections: From Conservative To Exponential Growth

The analysis explores various growth possibilities for Bitcoin. Assuming the coin’s growth rate significantly contracts in the coming years, growing at just 30% CAGR, Sullivan projects the coin to reach $245,000 by 2029. 

BTC price at a CAGR of 30% | Source: Analyst

A decade later, it will be at $909,000; by 2039, each coin in circulation will be trading at a whopping $3.37 million. If, however, the CAGR rises to 40%, Bitcoin would be worth $10.3 million in 15 years and $1.9 million in 10 years.

Still, even at these mega valuations, Bitcoin has been soaring at unprecedented rates, outperforming all traditional finance assets since launching. To demonstrate, Bitcoin registered a CAGR of 73.7% over the past four years. 

Therefore, if this trend continues, Sullivan says BTC will smash above the $1 million level a year after halving in 2028. However, half a decade later, each coin will change hands at over $16.5 million. 

BTC at a CAGR of 73.7% | Source: Analyst on X

A look back at Bitcoin’s history makes it clear that the coin has been on a tear. Following this historical trend and making projections for the future, BTC could be far more valuable in the next five or ten years.

There Are No Guarantees, Crypto Is Dynamic

While these projections are undoubtedly exciting for Bitcoin holders, it’s crucial to remember that they are just projections. The crypto market, just like any other tradable asset, doesn’t move in straight lines. 

As an illustration, after peaking at nearly $70,000 in 2021, prices crashed to as low as $15,600 the following year. In 2017, BTC rose to around $20,000 before tanking to below $4,000 a year later in 2018. This volatility and the dynamic market, influenced by new circumstances, don’t guarantee these lofty projections.

Bitcoin price trending upward on the daily chart | Source: BTCUSDT on Binance, TradingView

Nonetheless, analysts remain optimistic of what lies ahead, especially after the historic Halving event on April 20. As traditional finance players join in, finding exposure in BTC through spot exchange-traded funds (ETFs), prices might rise, even breaking above the all-time highs of around $74,000.

Bitcoin Analyst Set Sight On $79,591: Urges Traders To Be Patient

While Bitcoin prices hover around 15% below their all-time highs, with some skeptics predicting more losses, one analyst on X expects the coin to bounce strongly, even breaking above all-time highs.

Taking to X, the trader argues that Bitcoin has yet to breach the Golden Ratio Multiplier’s Cycle Top, currently sitting at $79,591. Supposedly, the analyst continues, this target price increases the longer it remains unchallenged. 

Bitcoin price action favors bulls | Source: Analyst on X

Bitcoin Traders Need To Be Patient

So far, BTC is trending lower and is technically within a bear breakout formation following sharp losses on April 13. As the coin struggles for gains and is boxed inside the bear bar, the odds of further upswings like those registered in Q1 2024 remain muted. 

However, even as BTC bulls are muted, the analyst emphasizes the prices are “respecting data points” despite prices dumping lower and taking longer to break higher.

Most traders expect prices to rise higher following March 2024’s impressive surge. However, the analyst believes traders need to have patience.  

Bitcoin price trending downward on the daily chart | Source: BTCUSDT on Binance, TradingView

Looking at how BTCUSDT prices are unfolding, it is clear that momentum is fading, and participation is low. CoinMarketCap data shows that trading volume on the last day is flat, at $46 billion. 

Overall, trading volume–a measure of engagement and trader interest– has dropped since mid-March, when the coin soared to all-time highs of approximately $74,000.

Whales Are Keeping Off From The Market

Parallel data from IntoTheBlock reveals that addresses holding at least 0.1% have also been slowing down in their accumulation, making the drop even more severe.

According to a CoinDesk report, when BTC fell on March 19, prices bounced strongly on March 20 following aggressive buying pressure whales. IntoTheBlock data showed they bought 80,000 BTC, forcing prices back to over $71,000.

Technically, by tracking whale movements, traders and investors can gauge overall market sentiment and their confidence for gains. This, in turn, could impact the sustainability of trends.

Their heavy involvement could precede sharp price gains, lifting the broader crypto markets. The fact that whales appear to be keeping off could suggest that they expect prices to drop even more. 

Moreover, other factors, such as the pace of inflows into spot Bitcoin exchange-traded funds (ETFs), point to a bleak future. CryptoQuant data shows that inflows have been stagnant in the past trading week. At the same time, IBIT, the spot BTC ETF offered by BlackRock, has been the only product out of the eight registering inflows.

Bitcoin Readying For A 12-Year Bull Run To $650,000 If Bulls Take Charge: Analyst

Even with Bitcoin prices facing pressure from sellers, Willy Woo, an on-chain analyst, thinks the coin will reach new highs thanks to the launch of new Bitcoin exchange-traded funds (ETFs). In a post on X, Woo said the coin could soar to as high as $91,000 in a bear bottom but soar to as high as $650,000 in a bull market top.

However, Bitcoin will only soar to these mega valuations, assuming that leading asset managers will fully deploy their recommended allocations to the world’s most valuable crypto asset.

Bitcoin In A Wide Range

At spot rates, Bitcoin looks shaky. Even after the surge to all-time highs of over $73,000 in mid-March 2024, the coin has been under pressure. So far, prices are within a range. There are caps at $73,800, or an all-time high, on the upper end and around $61,000 on the lower end of its current range. 

As long as prices are inside this zone, the uptrend remains. This preview considers the formation established in the better part of Q1 2024 after the first spot of Bitcoin ETFs in the United States was approved.

Bitcoin price trending upward on the daily chart | Source: BTCUSDT on Binance, TradingView

In the post on X, the analyst should note that the rise to $91,000 and $650,000 are long-term targets and not for the current market cycle. Most importantly, Woo added, it will depend on how fast and aggressively asset managers like BlackRock add BTC to their diversified portfolios.

Even so, this projection excludes inflows from non-custodial wallets. Capital flows from these wallets are projected to be higher due to rising crypto adoption.

Here’s How BTC Will Soar In The Coming Years

In Woo’s assessment, asset managers manage around $100 trillion globally. If they decide to invest 2% of their holdings in Bitcoin as Fidelity recommends, the asset could receive around $2 trillion. Additionally, considering the coin’s value, based on on-chain movement, worth around $561 billion, the total investment would reach $2.56 trillion.

Using the Market Value to Realized Value (MVRV) ratio, Woo said BTC could soar to a market high of $650,000 in a bull cycle. The MVRV is a metric that compares market capitalization to on-chain investment.

Conversely, BTC could reach a swing low of $91,000 if the crypto market crushes. The MVRV ratio is typically 5X in bull market tops and 0.7X in bear market bottoms.

Woo thinks Bitcoin, like gold, is ready for a 12-year bull run. Even so, adoption and emerging regulations in Europe and Asia will shape the path to $91,000 and $650,000.

Bitcoin “Looks Healthy” After 2 Months, Backs BTC To Rally Above $74,000

Bitcoin, one analyst notes on X, is looking healthy for the first time since the coin soared to over $70,000, printing all-time highs back in March 2024. The assessment is due to funding rates dropping to within ordinary levels, an indicator that volatility is also falling and moments of fear of missing out (FOMO) are fading. 

BTC funding rate is dropping | Analyst on X

Funding Rates At “Normal Levels” As FOMO Dissipates

In crypto perpetual trading, the funding rate is the fee exchanged between market participants. These fees are market-determined and are adjusted every eight hours or so. 

Depending on market conditions, they can be positive or negative. However, they play a critical role in determining momentum. Of note, bulls pay a fee to bears When perpetual prices are higher than the spot price. This, in turn, discourages buying in the perpetual market and incentivizes buying into the spot, bringing prices closer. 

Whenever prices rally, as has been the case since the start of the year when Bitcoin has generally been in the green, those who enter long have to pay sellers to keep prices from deviating, as mentioned above. 

However, at spot rates, the rate leveraged buyers are paying is slightly lower as FOMO drops. Once prices rapidly expand, ideally above March 2024 highs, this funding rate will likely increase to February and March 2024 levels.

Bitcoin price trending upward on the daily chart | Source: BTCUSDT on Binance, TradingView

So far, Bitcoin is changing hands above $70,800 at spot rates and within a bullish formation. Of note is that buyers are in charge of reversing losses posted on April 8. 

Even so, for the uptrend to remain, prices must break out above $72,500 and the April 8 high on rising volume. BTC will likely float to over $73,800 and enter price discovery in that case.

Bitcoin Rises After CPI Data In The United States, Institutions Pouring In?

With FOMO dissipating and “normalcy resuming,” the analyst said the coin is now better positioned to soar higher, backed by organic momentum generated from market participants. After dipping slightly on April 9, the coin rose following positive news about the Consumer Price Index (CPI) in the United States. 

While the “hot” CPI pushed other assets lower, Bitcoin prices bounced to spot levels. Experts say the coin might benefit as risk-averse traders shift to safe-haven coins to shield their value from raging inflation.

Beyond this, analysts expect demand for spot Bitcoin exchange-traded funds (ETFs) to rise in the months ahead. As institutions pour in, buying shares of spot BTC ETFs issued by players like Fidelity, the demand for the underlying coin might soar to fresh levels, lifting prices. Moreover, some analysts are bullish, saying prices will benefit once GBTC stops offloading coins. 

Bitcoin To $100,000: Can Hong Kong’s Spot ETFs Make It Happen?

In a recent analysis, Stanislas Bernard, the founder of Sinz 21st.Capital, delved into the complexities surrounding Hong Kong’s consideration to approve spot Bitcoin ETFs against the backdrop of China’s escalating economic crisis. With the nation grappling with a record debt-to-GDP ratio of 288% in 2023, and witnessing one of the most severe housing market collapses in three decades, the financial instability has triggered an unprecedented capital flight towards overseas markets.

The Perfect Timing For A Spot Bitcoin ETF?

Amidst these turbulent economic times, Hong Kong’s potential approval of spot Bitcoin ETFs stands out as a pivotal development that could not only be a safe haven for Chinese investors but also significantly influence Bitcoin’s valuation, potentially catapulting it to the elusive $100,000 mark.

China’s economic woes have been intensifying, marked by a towering debt ratio and a plummeting housing sector that has investors scrambling for alternatives. “China currently faces a significant economic downturn, exacerbated by soaring debt and malinvestments in real estate. The crisis, becoming well-known in 2021 with the default of Evergrande Group, has now spread, causing a ripple effect that will likely slow down the Chinese economy for years to come,” Bernard pointed out.

This backdrop of economic instability has incited a significant shift in investor behavior, notably among Chinese investors who, faced with stringent capital controls, have sought refuge in ETFs that offer exposure to foreign markets. Yet, this avenue has been fraught with its own challenges.

“Investors are paying premiums as high as 43% on certain US-focused ETFs due to quota limitations, which speaks volumes about the desperation to find safer investment harbors,” Bernard notes. Such premiums underscore the pervasive fear and uncertainty that have gripped the Chinese market, driving investors towards seemingly any available exit from the volatility of the domestic market.

The Role Of Hong Kong

Bernard believes that not only Hong Kongers but also Chinese mainlanders will flock to Bitcoin ETFs. “They are pretty integrated. Mainland is HK’s largest trading partner. Would not be possible to approve a spot ETF and then close it to mainland. They will enforce transaction limits instead,” the expert said.

In the midst of these developments, Hong Kong’ Securities and Futures Commission (SFC) is reportedly considering the approval of spot Bitcoin ETFs already by the end of April, as reported yesterday. This move is viewed as a strategic effort to capture a portion of the capital flowing into Bitcoin, especially in the wake of the SEC’s approval of similar ETFs in the US, which saw a meteoric rise with $12 billion of net flow.

“Hong Kong is scrambling for a change. The approval of spot Bitcoin ETFs could unlock a vast reservoir of stranded Chinese capital into Bitcoin, providing a much-needed life raft for investors,” Bernard explained.
The anticipated approval of spot Bitcoin ETFs by Hong Kong authorities has been met with significant enthusiasm within the crypto community. Influential figures such as Bitcoin Munger and Stack Hodler have been vocal about the potential impact of this development on Bitcoin’s price.

“Hong Kong ETFs approval have accelerated to next week. Most accounts on CT weren’t making a big deal about them, but they are a big deal. They are going to take us to $100k+ in due time. Tick tock!” stated popular Bitcoin analyst Bitcoin Munger (@bitcoinmunger). He refers to the regional yearly year-over-year supply change from West to East.

regional yearly year-over-year supply change

Stack Hodler (@stackhodler) further emphasized the urgency among Chinese investors to find secure investment avenues outside the traditional system, “Chinese investors were panic-buying a Gold fund at a 30% premium this month as they attempt to get their wealth into something outside the Chinese system. The approval of Hong Kong spot ETFs could be the turning point, offering a sanctioned avenue for wealth preservation amidst the crumbling real estate market.”

Overall, the potential approval of spot Bitcoin ETFs in Hong Kong is poised to be a landmark development, not just for the region but for the global market. By offering a secure and regulated channel for investment, it could serve as a catalyst for significant capital inflow into Bitcoin, reinforcing its status as a viable store of value.

“As we stand at the cusp of this historic development, the implications for Bitcoin and the broader cryptocurrency market could be profound. The approval of spot Bitcoin ETFs in Hong Kong could indeed be the harbinger of a new era, potentially driving Bitcoin’s value to new heights,” concluded Bernard.

At press time, BTC traded at $70,945.

Bitcoin price

Bitcoin Tumbles on Hot CPI Data, But This Analyst Stays Ultra Bullish: Here’s Why

The better-than-expected United States Consumer Price Index (CPI) released on April 10 is already sending shock waves through the financial market. Bitcoin and most crypto assets are trading lower, extending losses recorded on April 9, weighing negatively against optimists.

United States CPI Data Came In Hot

According to Trading Economics data on April 10, CPI, a key economic metric for gauging inflation, rose 0.4% in March, pushing the annual inflation rate to 3.5%. Notably, this surpassed economist predictions and, most importantly, dashed hopes for the United States Federal Reserve (Fed) to slash rates aggressively this year.

United States CPI data | Source: Trading Economics

However, amidst the market jitters, Matt Hougan, the CIO of Bitwise Asset Management, offered a contrarian perspective as fear permeated the Bitcoin and crypto market. In a post on X, Hougan downplayed the influence of the CPI data on Bitcoin’s long-term trajectory. 

The executive argues that investors and traders should track other market factors like spot Bitcoin exchange-traded fund (ETF) inflows and rising government deficits. In Hougan’s assessment, these can strongly influence price, even lifting Bitcoin higher since they are currently aligned.

Time To Buy The Bitcoin Dip?

As such, even with the fall in BTC, the drop could offer potential buying opportunities for long-term holders. Some supporters believe the “hot” CPI data only exposes the vulnerabilities of fiat currencies. This would potentially drive investors to use Bitcoin as a hedge. 

Moreover, this upbeat sentiment is backed by solid demand for gold, a store of value asset preferred by traditional finance investors. Analysts anticipate Bitcoin will follow a similar path as investors seek to protect value amid rising inflation.

Further bolstering the bullish sentiment is the possibility of a spot Bitcoin ETF launch in Hong Kong before the end of April.

The Hong Kong Securities and Futures Commission (SFC) has been assessing various applications. Leading Chinese asset managers have submitted some. If the product is approved, it could further channel more capital to BTC, boosting inflows from the United States.

Bitcoin price trending sideways on the daily chart | Source: BTCUSDT on Binance, TradingView

When writing, BTC is steady but under pressure. April 9’s losses have been confirmed. The coin might track lower if bulls fail to push prices above all-time highs of around $74,000.

Bitcoin remains in a broader bullish formation, technically moving inside a rising wedge. This bullish outlook will only be invalidated if prices tank below $61,500 in the sessions ahead.

Bitcoin Can Reach $140,000 After This Rare Signal Prints: Analyst

Bitcoin may be hovering below its all-time highs, but analysts are turning bullish based on a rare chart formation. Taking to X, the analyst observed that BTC has closed two consecutive months above the upper Bollinger Band on the monthly chart. 

Bitcoin rides the Bollinger Bands | Source: Analyst on X

A Rare Bollinger Band Signal Prints: BTC To $140,000?

The analyst said that historically, when Bitcoin closes two consecutive months above the upper Bollinger Band on the monthly chart, prices tend to double within three months. If this pattern holds, Bitcoin will surge to over $140,000 by July 2024, just three months after the Bitcoin halving event.

Bitcoin is trading below $73,800, the all-time high registered in March 2024. However, after weeks of lower lows, the sharp recovery earlier on April 8 suggests buyers could be flowing back. At press time, the coin is changing hands above $71,800, convincingly breaking above the liquidation level of around $72,000. 

Bitcoin price trending upwards on the daily chart | Source: BTCUSDT on Binance, TradingView

Despite the bullish breakout, whether the uptrend continues remains to be seen. Of note is that BTC prices tend to collapse before the Halving, which is set to take place in the coming weeks, dumping to as low as 20%. BTC fell after peaking at $73,800, dropping to around the $60,000 level before snapping back higher to current levels.

A refreshing close above $74,000 might form the basis of even more gains in the days ahead, perhaps towards $100,000 in the weeks ahead.

BTC might breakout | Source: Analyst on X

Another analyst suggests that Bitcoin could rally to $140,000 within four weeks, especially if it follows a similar price pattern to December 2020. After breaking above the $20,000 high of 2017, Bitcoin continued to rally, peaking at around $70,000 for a nearly 3X surge.

Currently, buyers are eyeing the $74,000 mark and the all-time high. If this level is surpassed, as it was in late 2020, the possibility of Bitcoin at least doubling to $140,000 becomes more likely.

Will Halving, Macroeconomic Factors, And Spot ETFs Drive Prices?

The current bullish sentiment might continue. Possible drivers include interest in spot Bitcoin exchange-traded funds (ETFs). So far, billions have been channeled to these products, lifting demand and thus prices. The upcoming Halving event could further buoy demand, lifting prices even higher in the coming months. 

Beyond Bitcoin-driven fundamentals, analysts are also looking at market events, especially in the United States. Some speculate that the United States Federal Reserve (Fed) might not slash interest by at least three times this year as labor conditions become firm and inflation slows down.

If the Fed reduces interest rates, reversing their hawkish outlook, BTC could lead other safe havens in an uptrend.

Bitcoin Ready To Rip? Indicator Prints Bullish Signal After 9 Years

One analyst on X thinks Bitcoin bulls may be in for a treat in the coming months after one key indicator printed a buy signal for the first time in nearly a decade. While pointing to a bullish crossover on the 2-month chart’s Golden Moment Indicator, the analyst said the signal is again flashing green in almost nine years. 

Further cementing this outlook, this is forming as yet the Supertrend indicator, which has historically preceded every major Bitcoin uptrend, is also bullish.

BTC bull signals print | Source: Analyst on X

Bitcoin On A Bullish Path?

Though the analyst might be bullish on the world’s most valuable coin, the asset remains consolidated.  Technically, reading from the formation in the daily chart, the coin is slowly losing the uptrend momentum. This week, Bitcoin failed to build on to late last week’s spike to push above $72,000 in a buy trend continuation.

Bitcoin price trending upward on the daily chart | Source: BTCUSDT on Binance, TradingView

In the daily chart, Bitcoin is trading above the 20-day moving average. However, prices have been moving horizontally below $72,000. Despite this, traders are hopeful. 

Whether bulls will flow back and thrust the coin to fresh highs above $74,000 will depend on many other factors.

Inflows Into Spot BTC ETFs Pick Up Momentum

A key influencer on price and sentiment remains spot Bitcoin exchange-traded funds (ETFs) and their flow trend. Since launching, nine out of the ten spot Bitcoin ETFs have accumulated over 500,000 BTC, or roughly 2.5% of the total supply. 

When Grayscale’s BTC holding is factored in, all spot Bitcoin ETF issuers in the United States control 830,000 BTC. Cumulatively, this figure translates to roughly 4% of the total supply.

Of note, after last week’s slowdown, inflows continued throughout this week, pushing their holdings even higher—a net positive for the price and, most importantly, investor confidence. By March 28, Lookonchain data shows that 21Shares led the charge, adding 2,924 BTC. 

Spot Bitcoin ETF issuers accumulating | Source: Lookonchain via X

Despite the general lull in Bitcoin prices, the uptick in demand for these derivative products indicates growing interest among institutional and retail investors.

It remains to be seen how prices react going into April, an important month. In less than four weeks, the network will halve miner rewards from 6.25 BTC to 3.125 BTC, making the coin scarce. If the current level of demand remains, BTC prices will likely rise as market forces automatically adjust prices. 

Are Old Bitcoin Whales Selling Or Mitigating Risks Using Spot BTC ETFs?

Ki Young Ju, the founder of CryptoQuant, a blockchain analytics firm, has noticed a curious trend. In a post on X, the founder shared a snapshot suggesting that Bitcoin “old whales” might be shifting their holdings to “new whales,” mainly traditional finance heavyweights like Fidelity and BlackRock.

The United States Securities and Exchange Commission (SEC) recently approved these new whales to list spot Bitcoin exchange-traded funds (ETFs) for all investors. 

Bitcoin old whales moving holding | Source: Analyst on X

“Old Whales” Moving Coins: Selling Or Risk Mitigation?

While a definitive sell-off isn’t confirmed, commentators replying to the founder’s post believe these “old whales” could be mitigating risk. In their assessment, moving their Bitcoin stash from self-custody to a regulated investment vehicle like spot Bitcoin ETFs is a better measure of covering unexpected eventualities.

If this is the approach, then it could prove strategic. Bitcoin holders can transact without depending on a third party. Notably, this development coincides with a significant drop in BTC inventory on major exchanges like Coinbase and Binance, as well as at GBTC.

The decline has accelerated since the introduction of spot Bitcoin ETFs, hinting at a potential departure from exchanges. Meanwhile, the operators of GBTC are unwinding the product and converting it to a spot Bitcoin ETF following a court decision.

Will Spot BTC ETFs Gain Traction?

Even so, that “old whales” are moving their coins to centralized products like ETFs contradicts the core philosophy of BTC as a tool for financial self-sovereignty. Whether more users, mainly retailers, will choose to own spot Bitcoin ETF shares rather than the underlying coins directly remains to be seen.

Institutions might be obliged by law to use a regulated product if they need to be exposed to BTC. However, retailers can choose to buy directly from exchanges or mine. This freedom might lead to more retailers opting to buy BTC.

Bitcoin price trending upwards on the daily chart | Source: BTCUSDT on Binance, TradingView

This trend emerges ahead of the highly anticipated Bitcoin halving. This event is set for mid-April 2024 and will further reduce BTC’s circulating supply, potentially driving higher prices. Before then, BTC prices are firm, steady above $70,000 at the time of writing.