Bitcoin Price Taps $28,000 On Grayscale Ruling, Soaring Stock Market

Bitcoin price has thus far made a 7% intraday move following news that a US court ruled in favor of Grayscale against the SEC. At the same time, the stock market is surging.

Could a perfect storm for the top cryptocurrency by market cap be building?

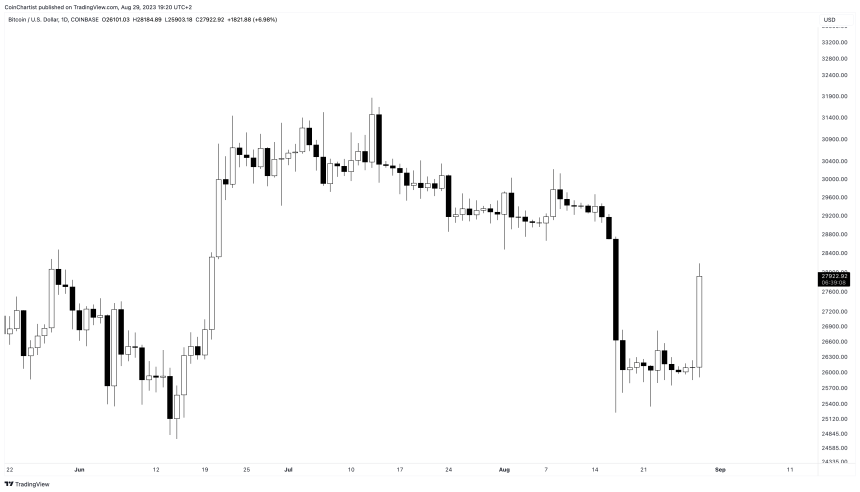
Back At $28,000: Grayscale Court Ruling Causes BTC To Bounce

In an asset class as volatile as crypto, prices — and moods — can change in a flash. That’s exactly what we’ve witnessed on a small scale today, moments after news broke that a US court is forcing the SEC to reconsider Grayscale’s Bitcoin ETF.

The news is significant because not only does it increase the chance Grayscale can move ahead with an ETF, but it also improves the likelihood of other ETFs like
BlackRock getting the green light.

Green is definitely the color of the day, with BTCUSD climbing back to $28,000 per coin on the heels of the news.

BTCUSD_2023-08-29_13-20-53

Bitcoin Price Could Benefit From A New Stock Market High

It isn’t just crypto getting a major boost today. US stock indexes are also soaring today. The S&P 500 is up over 1.2%, the tech-heavy Nasdaq over 1.88%, and the Dow Jones Industrial Average at 0.63%. The latest bounce in stocks puts traditional markets within striking distance of a new all-time high.

This is important because if Bitcoin price is already turning bullish in the wake of the Grayscale news, then a simultaneous stock market all-time high could cause crypto to go ballistic.

SPX_2023-08-29_13-29-07

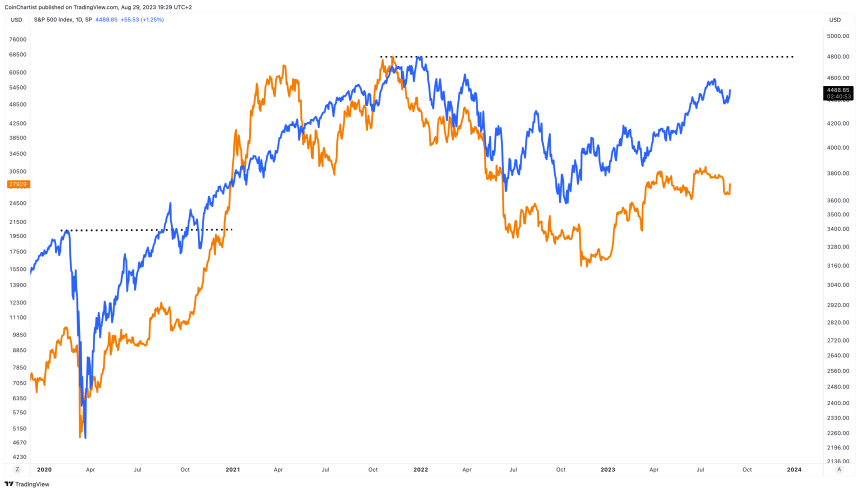
Cryptocurrencies have a ton of catching up to do relative to the stock market. Furthermore, back in 2020, after the S&P 500 made a new all-time high, Bitcoin price followed in the weeks to come and set a record of its own. Is this what we can expect if the stock market sets new record highs, and a slew of ETFs are approved?

Bitcoin & The Global Currency Meltdown | BTCUSD September 28, 2022

In this episode of NewsBTC’s daily technical analysis videos, we examine how Bitcoin is trading against other currency pairs and not USD. We also look at BTC against WTI Crude Oil and the S&P 500.

Take a look at the video below:

VIDEO: Bitcoin Price Analysis (BTCUSD): September 28, 2022

The market continues to be shaken up by the strength of the dollar. Following yesterday’s rally in BTC that was immediately wiped out, traders are even more hesitant to pull the trigger with the top cryptocurrency rising again.

Bitcoin Daily Momentum Change Causes Chain Reaction

Bitcoin daily has flipped bullish on the LMACD, setting off a chain reaction across a variety of timeframes. In terms of this chain reaction, we have a bullish crossover on the 3-day and the weekly timeframe. Both, especially the weekly, have been like bait, snapping back at bulls each time they attempt to turn the tides of momentum.


Momentum causes a bullish chain reaction of crossovers | Source: BTCUSD on TradingView.com
How BTC Fares Against Other World Currencies

The DXY Dollar Currency Index is the dollar trading against a weighted basket of top national currencies. These currencies include the British pound sterling, the euro, the Canadian dollar, Japanese yen, Swedish krona, and Swiss franc.

Due to the enormous shakeup and volatility in global currency markets, we put Bitcoin up against other currencies and not the standard USD pair.

As you can see, the pound, euro, canadian dollar, and Japanese yen all crossed bullish weeks prior, while the USD pair struggles to do so. Other strong national currencies like the Swedish krona and Swiss franc have yet to cross over much like the dollar. 

Bitcoin could be bottoming against several top currencies | Source: BTCUSD on TradingView.com

Related Reading: Bitcoin Shows Resilience In Dollar-Driven Bloodbath | BTCUSD September 26, 2022

Comparing The Top Crypto To The S&P 500 And WTI Crude Oil

Continuing the deep dive into unorthodox Bitcoin charts, we’ve combined the charts of BTCUSD and the SPX. This unique chart shows that Bitcoin never made a higher high in late 2021, and the downtrend began with the April peak. This chart also is flipping bullish and has a weekly close confirming the crossover.  Bullish momentum will need to grow to sustain a rally.

Next, we’ve compared Bitcoin to what could be the most important macro asset globally: oil. In this comparison, much like the SPX example, we put BTCUSD up against WTI Crude Oil. WTI Crude oil is American produced oil from West Texas Intermediate. 

In this oddball trading pair, Bitcoin also had a lower high and a much steeper downtrend. However, Bitcoin flipped bullish against oil several weeks ago, but has yet to produce a meaningful upside move. Is such a move coming soon enough?

Bitcoin has crossed bullish against the SPX and WTI Crude Oil | Source: BTCUSD on TradingView.com

Learn crypto technical analysis yourself with the NewsBTC Trading Course. Click here to access the free educational program.

Follow @TonySpilotroBTC on Twitter or join the TonyTradesBTC Telegram for exclusive daily market insights and technical analysis education. Please note: Content is educational and should not be considered investment advice.

Featured image from iStockPhoto, Charts from TradingView.com

WATCH: Waiting On The Bitcoin Monthly: Will Crypto Sink Or Soar? BTCUSD August 31, 2022

In this episode of NewsBTC’s all-new daily technical analysis videos, we are once again looking at the Bitcoin price monthly chart as well as the monthly chart on Ethereum, and major stock market indexes that have a high correlation with crypto.

Take a look at the video below.

VIDEO: Bitcoin Price Analysis (BTCUSD): August 31, 2022

There isn’t much to report on since yesterday’s video, so all eyes remain on the pivotal monthly close in Bitcoin and other risk assets. As you learned in yesterday’s video, the BTCUSD monthly is on a TD9 buy setup, and could risk a lower low which could perfect the series. In the next video, we take one last look at monthly timeframes ahead of tonight’s close.

One Last Look At The Bitcoin Monthly Support Line (And Other Cryptocurrencies)

Tonight’s August monthly close is critical across all risk assets – cryptocurrencies and stocks included. After staging an attempt at a recovery, Bitcoin, Ethereum, and major stock indices have been rejected back to support. Holding at this support level is the first step in a recovery, while losing it is a clearer sign of additional downside.

In the chart below, we can see that all that is separating BTCUSD from disastrous new lows is one horizontal line – former all-time high resistance turned support. If the level fails to hold firm as support, crypto could see and extended bear market.

The S&P 500 and Nasdaq losing their support levels has even more dangerous implications, possibly adding fuel to a recession in the United States.

Bitcoin hangs on by a thread at a key resistance turned support level | Source: BTCUSD on TradingView.com
Cyclical Tools Give Hope For A Bottom

There is no denying that things look negative for Bitcoin and other risk assets at this point in time, cyclical behavior dating back to the first major bear drawdown in BTCUSD could provide hope that the worst is over and a new bullish phase could begin.

In the video, we compare past cycles using the LMACD, Relative Strength Index, Stochastic, and the Average Directional Index. The fact that these tools could indicate a bottom is in might provide a clue to how the monthly candle will close tonight. With less than hours remaining in the monthly candle, it will be a nail-biter.

We also take a closer look at this cyclical behavior in Bitcoin | Source: BTCUSD on TradingView.com

Learn crypto technical analysis yourself with the NewsBTC Trading Course. Click here to access the free educational program.

Follow @TonySpilotroBTC on Twitter or join the TonyTradesBTC Telegram for exclusive daily market insights and technical analysis education. Please note: Content is educational and should not be considered investment advice.

Featured image from iStockPhoto, Charts from TradingView.com