In a recent report published by QuickNode, the first quarter of 2024 showed the dominance of decentralized finance (DeFi) and the notable growth of Web3 gaming in the crypto industry, which outperformed the stablecoin sector in key metrics, indicating investor preference and market sentiment during this period.
Hopes For Second ‘DeFi Summer’
Per the report, DeFi experienced a significant resurgence in Q1’24, fueled by a surge in developer and user activity, particularly on chains like Solana (SOL) and Base.
This resurgence has sparked growing hopes of a second ‘DeFi Summer,’ as DeFi projects embrace new concepts such as staking, liquid staking, restaking, and liquid restaking, which have been catalysts for its growth. Notably, staking now represents a substantial portion of DeFi’s Total Value Locked (TVL).
While stablecoins remain the top spot for address activity, DeFi surpassed stablecoins in an essential metric: transaction counts.
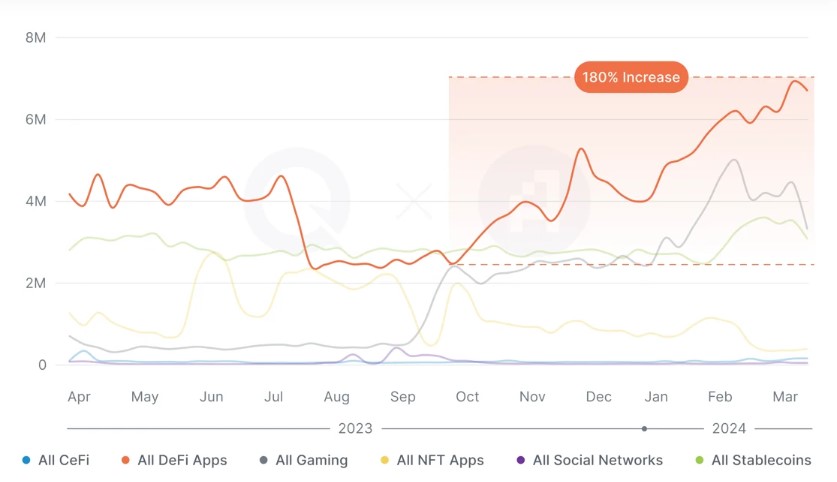
DeFi emerged as the leader in transactions for Q1’24, averaging nearly 7 million daily transactions. Furthermore, DeFi led in fees spent, gas usage, and the overall number of projects despite comprising only approximately 4% of the total crypto market cap.
The TVL for yield-generating protocols within DeFi witnessed steady growth, climbing from $26.5 billion in Q3’23 to $59.7 billion in Q1’24. According to QuickNode, this rally signifies a return of confidence and liquidity to the DeFi markets as investors seek opportunities for yield generation.
Players Take Control With Web3 Gaming
In parallel, Web3-based gaming has emerged as a significant departure from conventional gaming platforms. By leveraging cryptocurrencies and non-fungible tokens (NFTs), Web3 gaming offers players new and decentralized gaming.
Players now have the opportunity to actively participate in games and earn rewards, shifting control away from centralized entities within the gaming ecosystem.
The report highlights the growth of Web3 gaming, surpassing stablecoins in transaction volume and achieving the highest year-over-year (YoY) active address growth across all categories, with a 155% increase in active addresses during Q1 ’24.
This surge in player engagement and participation is evident through the exponential growth of transactions within Web3 gaming, which experienced a staggering 370% YoY increase.
The Appeal Of Stablecoins
Although stablecoins continue to lead in daily active users, representing over 41% of all Web3 user activity, other categories have shown higher quarter-over-quarter (QoQ) activity growth, indicating potential catch-up.
Tether’s USDT remains the dominant stablecoin, controlling approximately 75% of the market cap. Notably, Circle’s USDC has taken the lead in volume and average transaction size, partly due to Coinbase’s efforts to integrate USDC on its platform and promote its use on its Layer 2 network, Base.

In addition, the report notes that stablecoins have proven attractive to both new and experienced users, offering stability and value predictability, especially during periods of market uncertainty.
QuickNode attributes the surge in stablecoin user activity in Q1’24 to several factors, including the approval and listing of spot Bitcoin ETFs in the US, the anticipation of Bitcoin’s next Halving event, the devaluation of fiat currencies, the popularity of low-volatility assets, and the strength of the USD, to which over 90% of stablecoin transactions are anchored.
Featured image from Shutterstock, chart from TradingView.com


