Bitcoin might not be able to observe any extended runs of bullish momentum until this on-chain indicator reverses its trend.
Stablecoin Whale Supply Has Dropped To Lowest In Six Months
During the past few days, Bitcoin has registered some rise and has managed to breach the $27,000 level. The asset has, however, been unable to build up any sustained moves above this mark so far.
The below chart shows how the cryptocurrency’s price has changed in recent days:
While moves above the level have all failed, the asset is still more than 3% up during the past week, which is more than some of the other top coins like Ethereum (ETH), Cardano (ADA), and Dogecoin (DOGE).
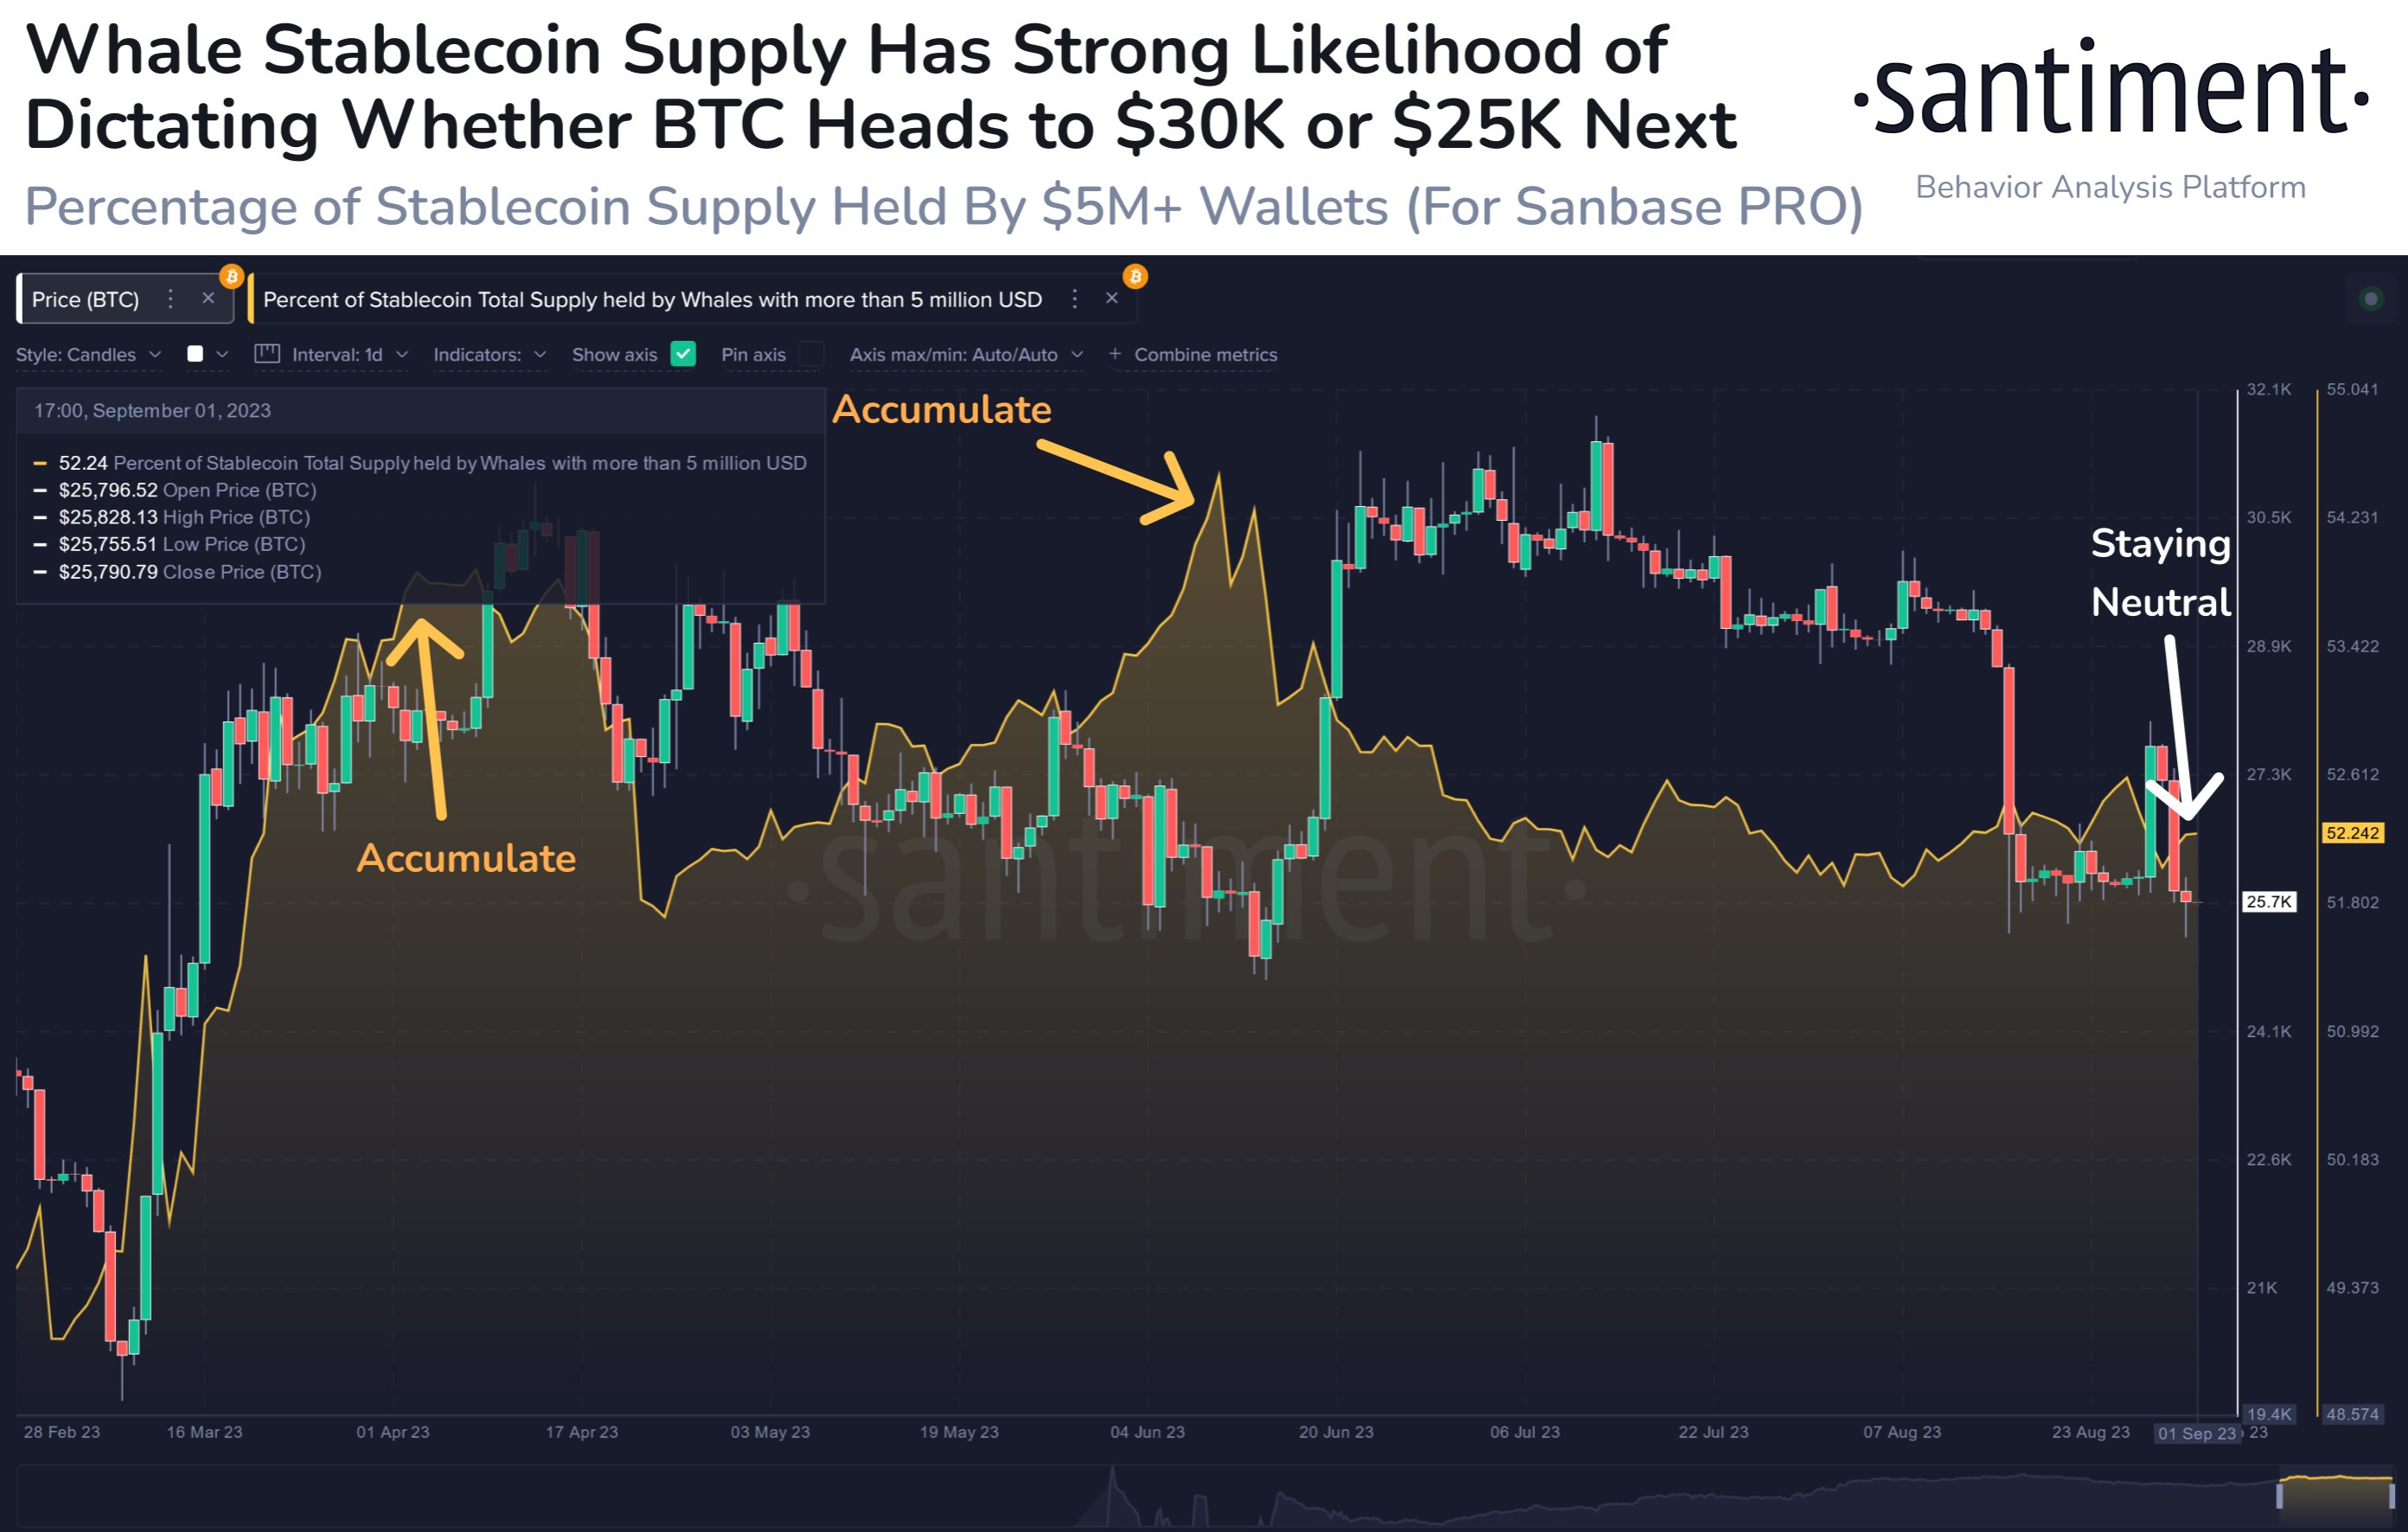
Now, as for whether Bitcoin can find a proper break toward higher levels, data from the on-chain analytics firm Santiment may provide some hints. The indicator of interest here is the combined percentage of the stablecoin circulating supply that’s being held by the whales.
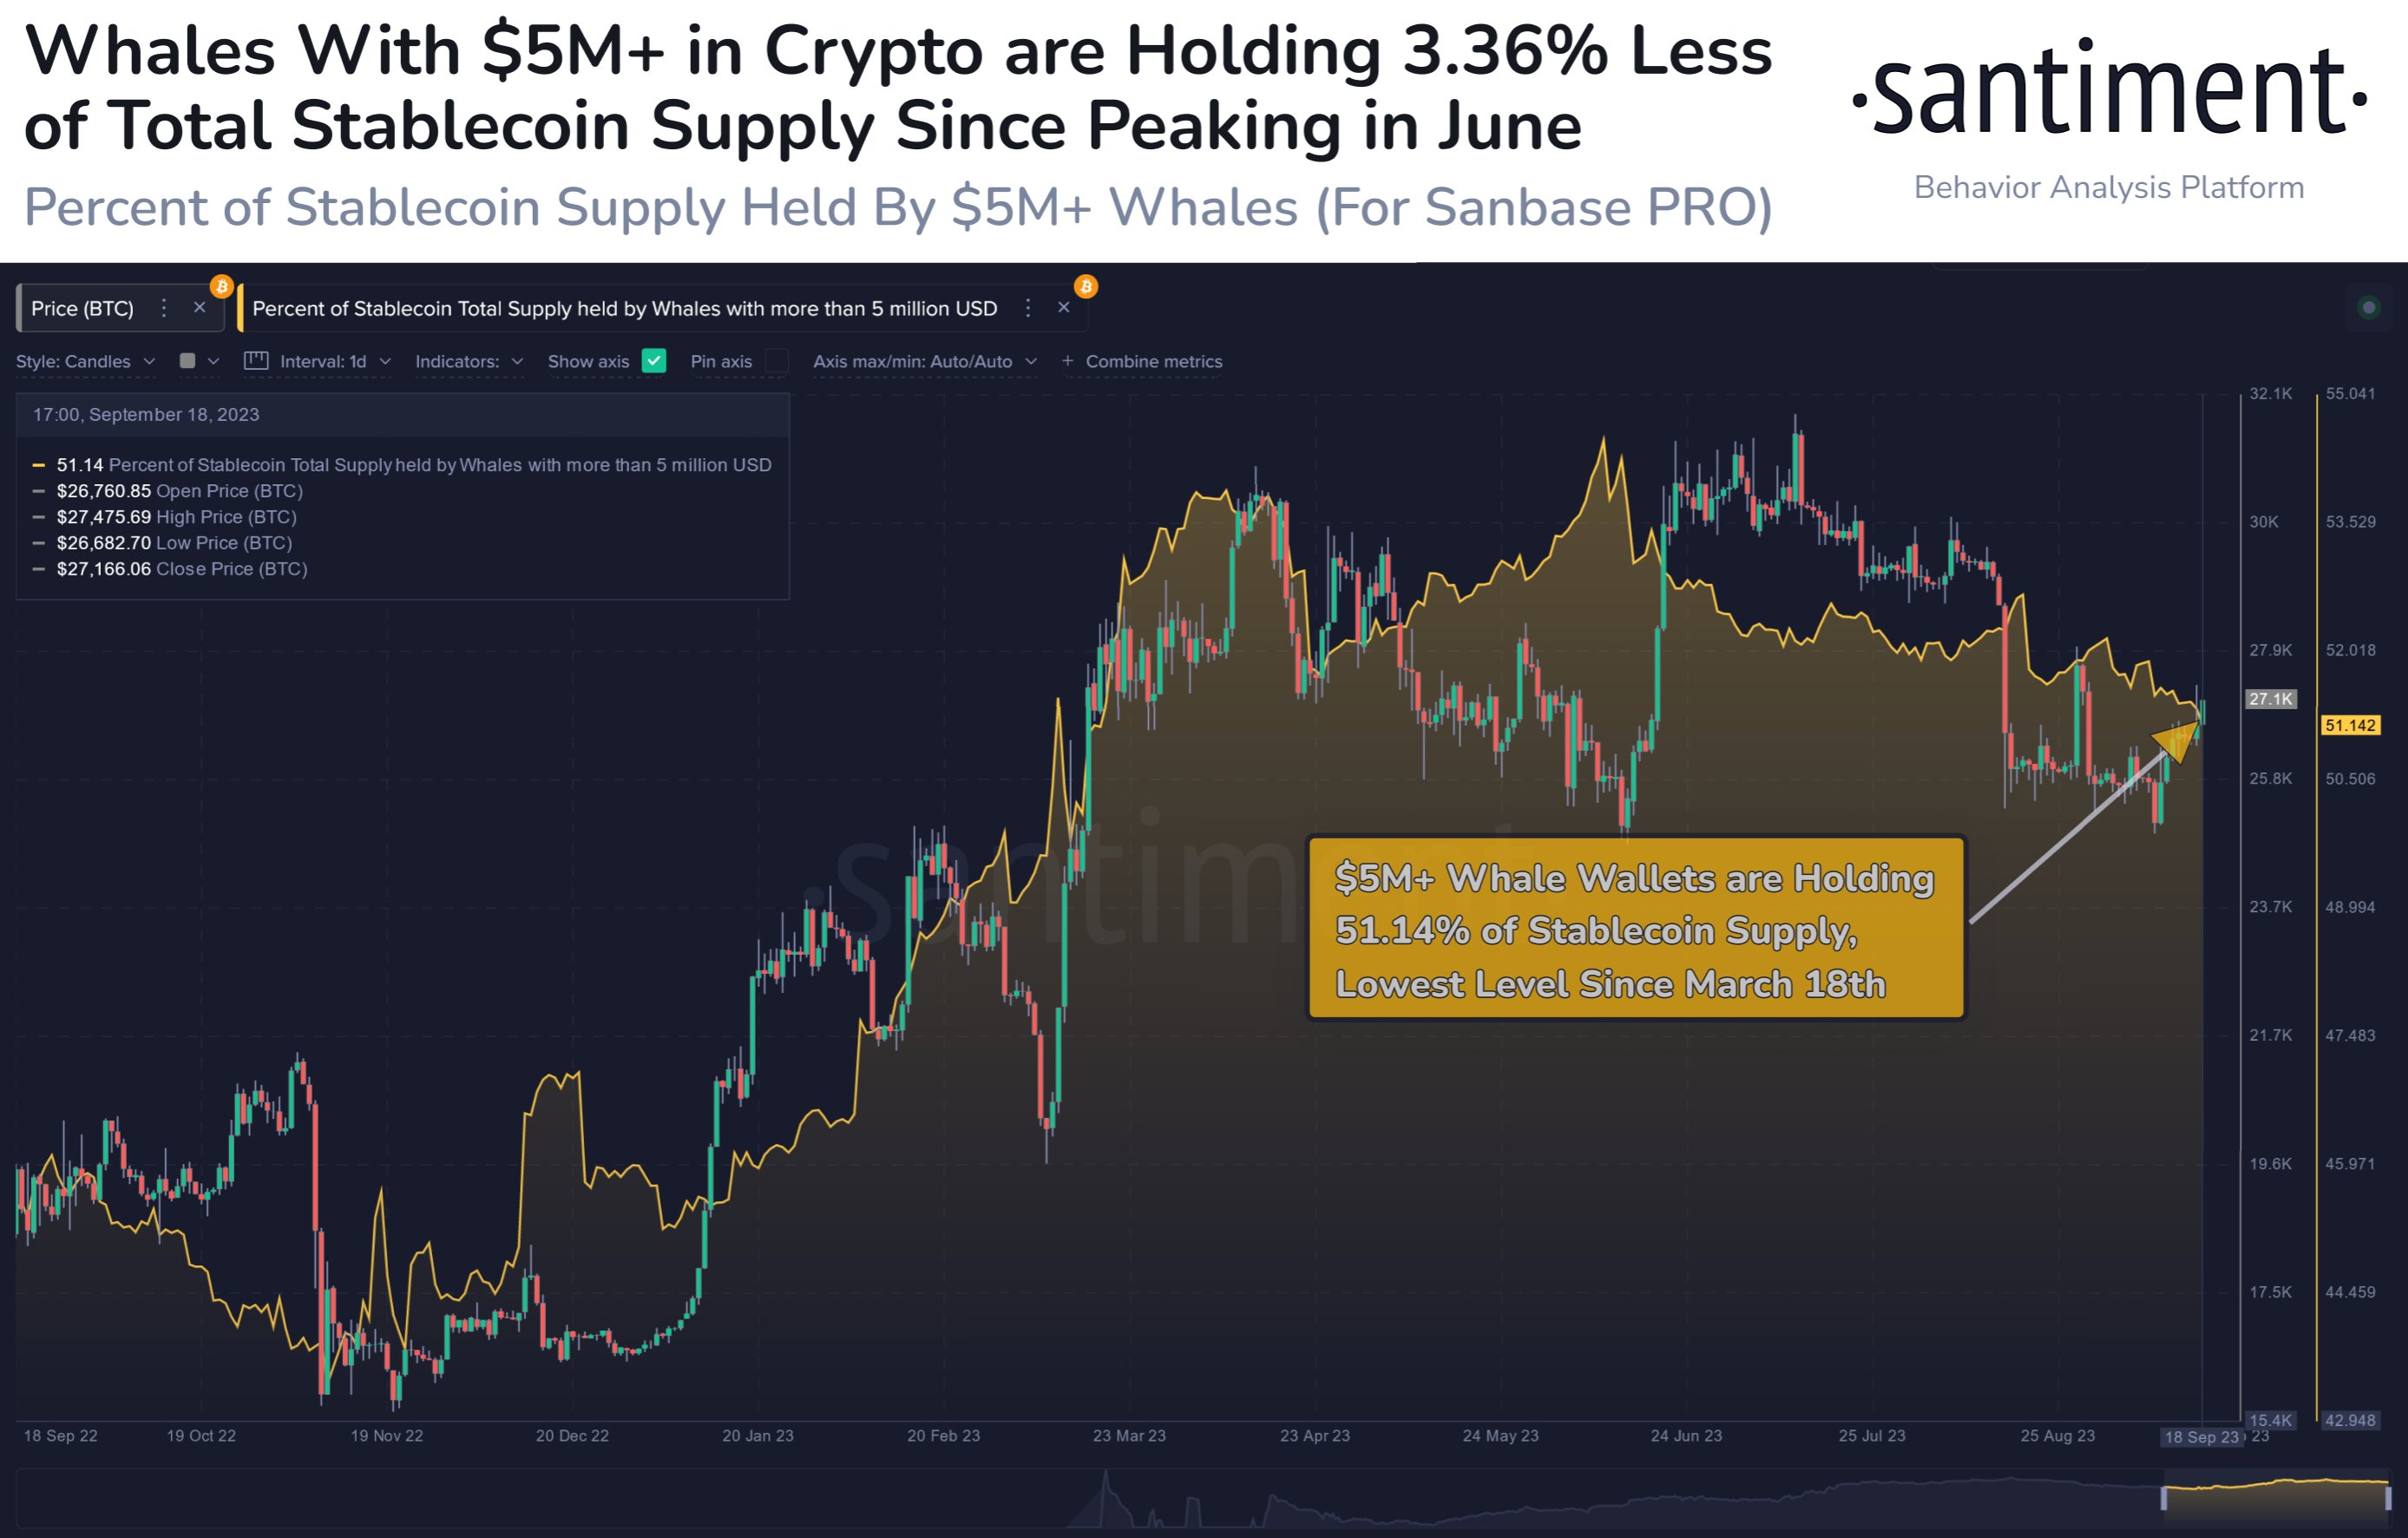
Here is a chart that shows the trend in this indicator over the past year:
The “whales” here refer to entities that are carrying at least $5 million in their addresses. These investors are among the largest in the market, so they can hold some notable influence.
Related Reading: Here’s Where Next Bitcoin Resistance Lies, From An On-Chain Perspective
From the graph, it’s visible that the total stablecoin supply held by these humongous holders has been on a net decline during the past few months. Following the latest drawdown in the metric, its value has hit 51.14%, which is the lowest observed since March 18th, about six months ago.
What Does This Mean For The Bitcoin Price?
Now, the main question is: what’s the relevance of this metric to Bitcoin? The answer to this question lies in the reason why these holders generally choose to hold stablecoins.
Investors may want to hold their capital in the form of these fiat-tied tokens whenever they intend to avoid the volatility associated with other assets in the sector like BTC.
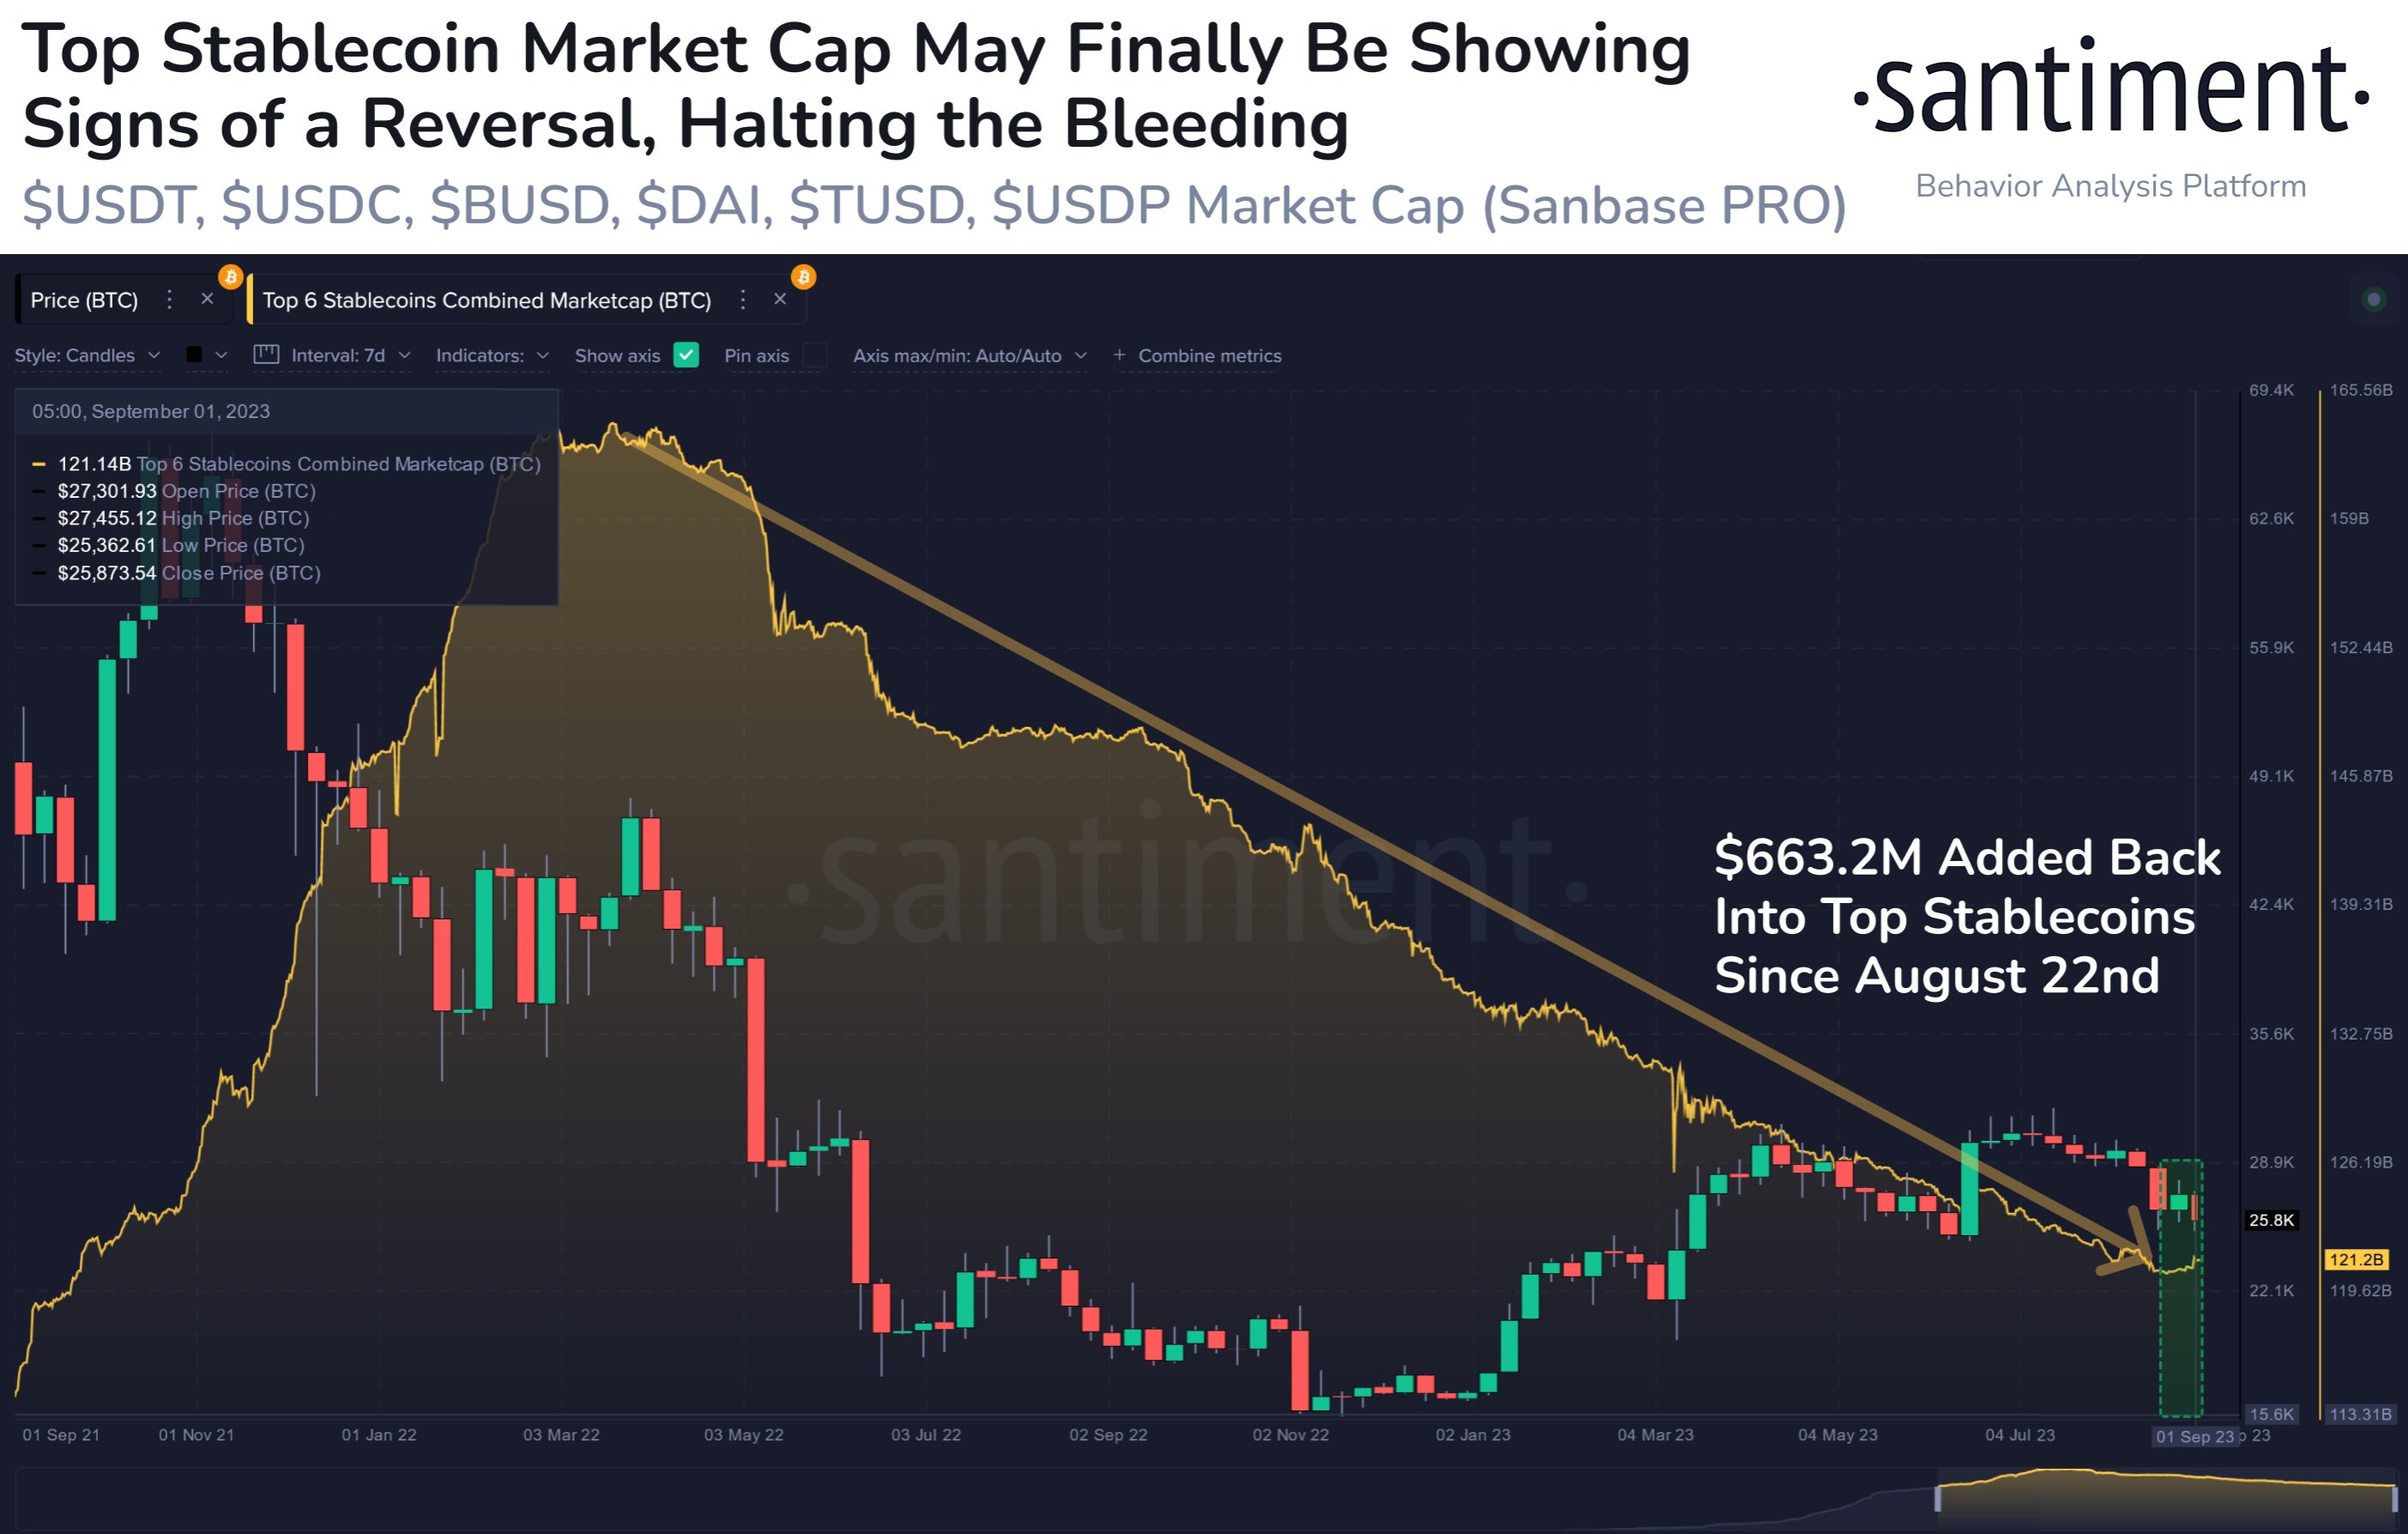
Such holders are probable to return back into the market as if they were looking to completely exit the sector, they may have done so through outflows into fiat. Once these stablecoin investors find that the prices are right to jump back into the volatile side of the market, they swap their tokens for them.
This act of shifting naturally provides a buying pressure on the prices of the coins that they are moving into. Because of this reason, the stablecoin supply could serve as a measure of the potential dry powder available for Bitcoin and other cryptocurrencies.
As the whales are clearly the most significant entities in the sector, the stablecoin supply held by them is of particular importance. Generally, uptrends in BTC follow periods where the whales significantly shed their stable supplies, as it means that they are buying into the asset with them.
Examples of such a trend are visible in the chart, as this pattern formed both prior to the January rally and the rebound in June. These investors have been decreasing their supply recently as well, but as BTC has gone down in this period instead, it’s likely that this decline is coming from withdrawals into fiat.
A turnaround in this indicator may be the one to watch for, as it can be a sign of fresh capital injections into the sector. Perhaps only once the whales’ buying power would return to the same levels as it was earlier in the year when Bitcoin breached $30,000, the asset would be able to find a sustained upward move.