The increase in staking has reduced the appeal of ether from a yield perspective, the report said.
Five Reasons Why the World Needs a Standardized Ethereum Staking Rate
An ether (ETH) staking benchmark could attract institutional investors into the Ethereum ecosystem and unlock a new wave of innovation.
Ethereum Merge Is One: Here Are The Highlights So Far
It has been a year since the Merge took place, and as expected, the world’s second largest cryptocurrency, Ethereum, has experienced many changes since then. What are some of them? Let’s take a look.
One Year In: How Has Ethereum Changed?
According to a prominent figure in the Ethereum community, Sassal, 980,000 ETH have been burned since Ethereum transitioned from a proof-of-work (PoW) consensus to proof-of-stake (PoS).
Ahead of the Merge, Ethereum had implemented a significant upgrade known as the London hard fork. This introduced a fee-burning mechanism with transaction base fees being burned immediately after a transaction is processed.
This move was geared towards making Ether deflationary, considering that some tokens are removed permanently from circulation. Ethereum supply is down by 0.25% since the Merge took place.
Furthermore, the Merge resulted in the network being secured by validators who stake their ETH as against Miners, who were the backbone of the network under the PoW consensus. In line with this, over 11.6 million ETH (since the Merge) has been staked to secure the network and also earn passive income in return.
The top stakers include the staking platform Lido DAO which has a market share of 22.64%, according to data from Dune Analytics. Other top stakers include exchanges like Coinbase, Binance, and Kraken.
Meanwhile, the number of validators on the network has significantly increased since the Merge, with 362,000 new validators joining the network.
Down In Valuation But Not Value
Ethereum’s price has increased by close to 11% from a year ago. However, many may consider this insignificant for a token that hit an all-time high of $4,891 the previous year. Nevertheless, there are positives to take from the Merge, as Ethereum has undoubtedly become more valuable since it occurred despite the current bear market woes.
A crypto analyst noted that ETH’s annual inflation rate has decreased since the Merge, and trading activity on Ethereum’s layer-2 chains has also increased significantly. That would suggest that more people are being onboarded into the Ethereum ecosystem.
According to him, Ethereum’s fundamentals are also at an all-time high, as there are factors that show that the ecosystem is stable and healthy. One of them happens to be the fact that traditional financial (TradFi) institutions are taking an interest in ETH.
Cathie Wood’s ARK Invest recently filed to offer an Ethereum Spot ETF (a first of its kind). This is alongside other institutions that have filed to offer an Ethereum futures ETF (of which ARK Invest happens to be among them).
Featured image from WAYA Media
Ethereum Merge anniversary — 99% energy drop but centralization fears linger

Energy use is down, and staking is up, but technical concerns still mark the road ahead for the second-largest cryptocurrency by market cap.
Ethereum’s Lifetime Energy Use Before the Merge Equaled Switzerland’s for a Year
If Bitcoin’s energy consumption can be thought of as a skyscraper, Ethereum’s energy use post-Merge, would be the size of a raspberry, according to University of Cambridge research.
How Advisors Can Prepare for Ethereum’s Unlock
Ethereum’s Shanghai upgrade will unlock ether that has been staked since the Merge, potentially leading to selling pressure that market participants could ride out or take advantage of.
‘Withdrawals are coming!’ — Ethereum devs confirm epoch for Shapella fork

Shapella will take effect at epoch 194,048, which is scheduled for 10:27:35pm UTC on April 12.
Vitalik reveals a new phase in the Ethereum roadmap: ‘The Scourge’


The remaining milestones of the Ethereum roadmap consist of The Surge, The Scourge, The Verge, The Purge and The Splurge.
Ethereum Price Looking At Possible Downward Shift – More Headaches Ahead For ETH?
The post-Merge landscape of Ethereum took many by surprise; the figures and the outcome weren’t something they had in mind.
Bad macroeconomic conditions and other negative factors overshadowed what was expected as a breakthrough. It was, in some ways, but the fanfare pre-Marge was so hyped up, until a few days following the event.
The optimism that had been building up in the days leading up to the CPI report, which ultimately brought down the broader financial markets, was wiped out in the fall on September 13.
Ethereum (ETH) Feeling Fed Hike Stress This Early?
As of this writing, Ether was down as it was reported that a further 75 basis point hike in interest rate by the U.S. Federal Reserve is possible in November if economic conditions don’t improve.
ETH, this early, could be starting to get stressed with the Fed’s looming rate bump. The chart suggests that ETH may be in for more losses, but what does it actually show?
Chart: TradingView.com
If the graph is any indication, things aren’t looking so rosy.
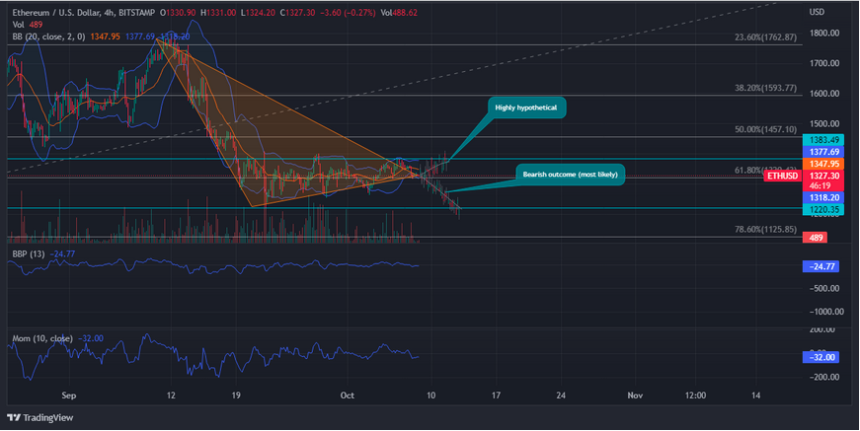
Since September 19th, the altcoin has traded between $1,408.15 and $1,219.29, with support located at the 61.80 percent Fibonacci retracement level, now at $1,265.02. The bull bear power indicator has formed a downward pointing at the time of writing.
This may indicate that it will be even more challenging for prices to rise above the $1,384.77 resistance level. Since September 15th, the center of the Bollinger Band has been providing dynamic resistance.
The indicator also revealed the formation of a crunch zone, making a price move over $1,384.77 more difficult.
The 20-day to 250-day simple moving averages are all acting as resistance levels, adding to the downward pressure on the altcoin.
The intraday chart displays a falling triangle formation. In light of the aforementioned, this may indicate to investors and traders that a further correction may occur in the near future.
With present market pressures, a market correction might push the price down to $1,220.35, a 10% decrease.
Speculative Bullish Run – How This May Transpire
If the support at $1,265.02 holds, the resistance at $1,384.77 could be retested. This hypothetical rise is supported by the Chaikin money flow index, which indicates the market is still dominated by buyers to some extent.
Bullish investors can use the CMF as a springboard and a strength boost for the previously mentioned weak support line. Even if the momentum indicator is bearish, it is creating a slow rise.
These variables can assist the price eventually reach the $1,384.77 resistance level and break through it, allowing a rebound to occur. If today’s trading session ends on a poor note, investors and trailers can participate in the price rebound by buying the dip.
ETH total market cap at $162 billion | Featured image from Kryptografen, Chart: TradingView.com
CoinShares’ Butterfill suggests ‘continued hesitancy’ among investors


Matrixport’s head of strategy said he believes the market is currently in a “wait-and-see environment” but could shift after the U.S. mid-term elections in November.
Arthur Hayes Questions PoS Ethereum’s Decentralization, Suggests Rising Price

The controversial Arthur Hayes asks a burning question in his latest blog post. Is the PoS Ethereum prone to centralization? The former BitMEX CEO compares it to the Binance Smart Chain, that’s famously and admittedly centralized. Arthur Hayes also describes how the validator’s disagreements with the majority are going to go, and predicts disaster for the dApps that build over a platform that doesn’t prioritize censorship resistance. In the short term, though, he’s bullish on Ethereum.
Before getting into all of that, Artur Hayes describes a concerning reality that many people in crypto Twitter have noticed and discussed. It has to do with the validators:
“As of 21 September, Lido Finance, Coinbase, and Kraken together control slightly over 50% of all ETH staked on the beacon chain. This means they are the most powerful validators and, in essence, they could censor what sorts of transactions are processed. What do all three of these centralized entities have in common? They are all US-owned companies or DAOs with major investments from US venture capitalists.”
For those keeping score, that’s a centralizing factor and a few single points of failure. All of those companies are under US jurisdiction, one of the most restrictive in the world. And of course, Arthur Hayes recognizes “protections in place to help ensure decentralization” and that the system punishes validators that censor transactions. Nevertheless, the PoS system seems fragile. Big institutions that the government can sue are the validators. And the biggest validators will control the whole system.
Arthur Hayes Sees Centralization
How will the slashing mechanism that punishes unruly validators play out? According to Arthur Hayes, this is how the system will deal with rebels:
- “There is a way to slowly lose your ETH if < 33% of the network refuses to attest to blocks. Slowly losing your ETH means that a validator is punished by reducing the deposit on a node. Should the deposit drop below 16 ETH, that validation node is removed from the network. This capital becomes dead capital as for the foreseeable future you cannot unstake ETH.”
- “There is a fast way to lose your ETH if > 33% of the network refuses to attest to blocks. The penalties get exponentially worse quickly such that opposing validators quickly fall below the 16 ETH threshold and are booted from the network.”
Hayes predicts that everyone will let that happen again and again, and compares it to the original DAO story. Ethereum’s developers decided to fork and “everyone at the time tacitly went along with the devs who forked the protocol so that folks could get their money back, rather than staying true to Ethereum’s supposed “code is law” ethos.”
ETH price chart on OkCoin | Source: ETH/USD on TradingView.com
Bullish On Ethereum Short-Term
Don’t get Arthur Hayes wrong, despite the criticism of the platform and PoS systems, he still thinks Ethereum will do well in relation to the dollar.
“ETH as a financial asset — fully tethered to the US-led financial system and under the pretense of “decentralization” — could still do extremely well in the near future. The issue that I wrestle with is whether truly decentralized financial and social dApps can exist at scale (i.e., with hundreds of millions of users)”
In the end, it all goes back to the most important factor: scarcity. According to Hayes, the only thing that matters in the next three to six months is “how ETH issuance per block falls under the new Proof-of-Stake model. In the few days post-merge, the rate of ETH emissions has dropped on average from a +13,000 ETH per day to -100 ETH.” If this continues, Arthur Hayes is optimistic:
“The price of ETH continues to get smoked due to deteriorating USD liquidity, but give the changes in the supply and demand dynamics time to percolate. Check back in a few months, and I suspect you’ll see that the dramatic reduction in supply has created a strong and rising floor on the price.”
Is the former BitMEX CEO right about this? We’ll find out soon enough.
Featured Image by GuerrillaBuzz Crypto PR on Unsplash | Charts by TradingView
Litecoin Price Watch: Why Only 15% of LTC Holders Are Making Profit
Litecoin has made it to the list of the best altcoins to buy in 2022. But for the past 24 hours, the crypto has fallen prey to the volatility that is currently wrecking havoc in crypto space.
As of this writing, Litecoin (LTC) is trading at $52.43, down nearly 1.1 percent in the last seven days, and losing 2.5 percent in the last 24 hours, data from Coingecko show, Monday.
At a glance, it can be said that LTC is on the same boat with Ethereum, the world’s second biggest crypto by market cap.
But when taking into consideration the percentage of its holders that are making profit, a great disparity can be seen.
Litecoin Holders In Tough Spot, Profit-Wise
TipRanks, an online data provider, revealed on September 25 that only 15% of the total holders of Litecoin are making profit and 12% are on status quo, leaving 74% dealing with tremendous losses. This was before the altcoin started to hit below the $53 mark.
In comparison, Ethereum is doing better than its fellow digital coin. Data shows 51% of its holders are in profit while 46% incurred losses. The remaining 3% are breaking even.
The huge difference between the percentages of holders of the two altcoins enjoying profit is not much of a surprise as Ethereum is pushing for a bullish streak following the initiatives to improve its network.
Litecoin, on the other hand, was left to deal with momentum-derailing losses.
Network’s Stagnant State Causing LTC Decline
Litecoin’s network has little to no activity at all and that is one of the reasons why it is failing to catch up with the likes of Ethereum.
With its stagnant state, Litecoin is forced into a bearish outlook along with the majority of the cryptocurrency market.
Over the past weeks, the crypto space continued to bleed and that trend is still continuing up to this date.
Ethereum, meanwhile, despite showing some struggle to maintain trading price of $1,500, is the subject of excitement of the crypto community as it recently transitioned into proof-of-stake (PoS) mechanism with what the space is calling “The Merge.”
While the historic event failed to deliver the rally that was expected of the king of all altcoins, it gave holders and investors something to look forward to.
LTC total market cap at $3.7 billion on the daily chart | Source: TradingView.com
Featured image from Cryptotelegram, chart from TradingView.com
Ethereum risks another 10% drop versus Bitcoin as $15.4M exits ETH investment funds

Macroeconomic factors and centralization concerns are putting pressure on Ethereum’s price post-Merge.
Ethereum: Can The Top Altcoin End Bitcoin’s Dominance Post Merge?
Ethereum (ETH), dubbed as the ‘leader of all altcoins’ has long carried the burden and pressure of supplanting Bitcoin (BTC) as the king of all cryptocurrencies.
To this date, it hasn’t succeeded or has come close into completing that mission. Not even The Merge could catapult Ethereum to the top and frankly, it hasn’t been able to even just leave a dent on the wall that was built by Bitcoin to keep its position.
In terms of price, there is considerable gap between the two crypto assets. Tracking from CoinGecko shows that as of this writing, Bitcoin is trading at $19,003 while Ethereum is at $1,338. Both currencies experienced price drop for the last seven days, 5.8% and 14.9%, respectively.
Image: Zipmex
Misplaced Confidence And Hopes With Merge
Last July during an interview, Ethereum Researcher Vivek Raman expressed confidence that The Merge will enable to altcoin alpha to finally topple the biggest of its hurdles and surpass Bitcoin, becoming the new most prominent cryptocurrency.
The Merge refers to an upgrade that was completed this September that will put Ethereum to a proof-of-stake (PoS) system. It was also deemed to change the network’s monetary policy, making it more environmentally friendly while reducing ETH supply.
But since the migration, Ethereum hasn’t been able to respond with an appropriate bullish run. Instead, along with Bitcoin and all other altcoins, it continues to deal with plummeting prices.
A Moment Of Victory For Ethereum
While it still fails to rise in the same level of prominence as that of Bitcoin’s, Ethereum did have a moment of victory against the crypto king after The Merge, courtesy of a rather strange observed trend reversal in crypto market.
Bitcoin’s trading dominance came to an abrupt end after ETH trading volume soared to greater heights and ultimately hit an all-time high.
Experts, however, believe that this effect of The Merge to Bitcoin is minimal and there will be resultant price movements, it will be transient. This is because the shift to a proof-of-stake mechanism has always been part of the plan for Ethereum since day one.
Hiro CEO Alex Miller said Bitcoin has already established itself as “the core asset,” calling the crypto “the digital gold.” For that matter, he believes Ethereum surpassing its rival in terms of market capitalization remains improbable as of this time.
ETH total market cap at $165 billion on the daily chart | Source: TradingView.com
Featured image Coinpedia, Chart: TradingView.com
(The analysis represents the author’s personal views and should not be construed as investment advice).
Post-Merge Profit-Taking Cuts 13% Off Ethereum Ratio Against BTC
We’re in a post-merge world, and the lessons keep arriving. As it turns out, the mythical Merge was a sell-the-news event for Ethereum. Technically, the event was a success and Ethereum kept a 100% uptime as optimistically predicted. Economically, the asset has been bleeding for the whole post-merge season. As a result, Ethereum lost ground against bitcoin, and bitcoin dominance is back up.
Let’s go to Arcane Research’s The Weekly Update for the exact stats and numbers:
“Since the merge, Ether (ETH) is down 17% in USD and down 13% compared to BTC, with ETHBTC currently trading at 0.07. ETH has found support at 0.07 ETHBTC, which represents the average ETHBTC price over the last 365 days.”
Will this become a tendency or are these just the post-merge jitters?
The Post-Merge Post-Mortem
For a rational analysis, let’s quote The Weekly Update:
“Ether traded idly after the merge, and volatility remained low until U.S. markets opened down. The ETH blow was related to a correlated environment to risk assets, but excess leverage from long traders contributed to exacerbating Ether’s relative underperformance versus BTC.”
And the fact of the matter is that the old adage “buy the rumor, sell the news” applies perfectly here. Fuelled by hype, Ethereum’s price ballooned before the event. It was still far away from its all-time high of around $4,8K, but $1.7K was great for the market we’re in. The asset outperformed bitcoin and threatened its dominance. It was overbought, though. Post-merge, people sold and ETH is now in a downtrend. Textbook behavior that shouldn’t surprise a soul.
The chart to watch, though, is that of Ethereum’s issuance. The main difference between the post-merge Ethereum and its predecessor is that the new coin will be much more scarce. And that could affect the price tremendously.
ETH price chart for 09/21/2022 on Bittrex | Source: ETH/USD on TradingView.com
State Of The Ethereum Forks
One of the drivers of the pre-merge rally was the expectation that there might be forks and there might be airdrops. Two brand new Ethereum forks emerged from the messy situation. Those two suffered the most during this post-merge period. Back to The Weekly Update:
“Ether has not struggled in isolation, Ether forks have experienced severe headwinds, and both ETHW and Poloniex’s competitor fork EthereumFair (ETF) have seen more than two-thirds of their valuation slashed since launch.”
This brutal smackdown was to be expected. All forks generate something akin to an airdrop, as people received the equivalent to the ETH they had in ETHW and ETF. Users exchanged that free money for harder currencies pretty fast. And now it’s time for those forks, who the all-powerful stablecoins don’t support, to prove their worth.
An older fork was also in the news because of the merge and has been struggling as much as its cousins.
“Ethereum Classic has also underperformed versus ETH. Amid the merge, many miners migrated to ETC, leading ETC’s hashrate to peak at 300 TH/s. However, as the difficulty has increased in ETC, the hashrate in ETC has declined to 186 TH/s”
Some people thought that Ethereum Classic, who remains a Proof-Of-Work blockchain, was going to thrive post-merge. So far, they’ve been proven wrong. But we’re in the early innings and things might drastically change for old reliable Ethereum Classic.
ETHBTC price chart on Binance | Source: The Weekly Update
Conclusions
Apparently, the merge was a success but the price didn’t hear the news. However, we should take into account that September is usually a bad month for cryptocurrencies in general. That, mixed with the classic “buy the rumor, sell the news” behavior have ETH against the ropes. For now.
Featured Image by Gerd Altmann from Pixabay | Charts by TradingView and The Weekly Update
Ethereum miners dump 30K ETH, stonewalling ‘ultra sound money’ deflation narrative

Ethereum miners have sold over $40 million worth of ETH because of the Merge and plummeting revenue.
ETH Backpedals After Hitting $1,800 Ahead Of Merge Last Week
As the integration has progressed, Ethereum’s price has slid precipitously. Since the general financial markets are facing a period of extreme pessimism, ETH could continue to fall over the next few days.
On the morning of September 15th, the Merge went into effect. The price of ETH dropped 11.91 percent during the day, wiping off all of the gains it has made since September 14.
The outlook for ETH after the integration is bleak because it suggests the crypto winter will continue through the summer months.
In the time after this article was written, the coin’s price has found support near the 61.80 Fib level, at around $1,329.91. A portion of the Donchian channel’s lower section has also been explored by the bears. This shift indicates a deeper descending pressure.
ETH Rebound Still A Big Possibility
ETH’s recovery is feasible, but only in the far future, as the Merge raised more concerns than it answered, and the broader financial markets are still battling to reestablish confidence.
A positive outlook for Ethereum’s future is something this occasion is meant to instill in traders and investors. Traders and investors, however, believe that the proof-of-stake system is a wrong turn for ETH.
According to a post in r/CryptoCurrency on Reddit, the proof-of-stake mechanism benefits the wealthy at the expense of the poor. Investors and dealers are under increased pressure to sell because of the combination of current market circumstances and skepticism surrounding the upgrade.
Momentum and stochastic RSI indicators reveal this information. The present convergence of the Stoch RSI is bearish, indicating that investor sentiment is at an all-time low.
Ethereum Bulls Feeling The Pain
Additionally, ETH’s momentum is a staggering -410.90. The bulls are experiencing anxiety in the broader financial markets and the Merge.
Ethereum also closely follows Bitcoin. As of the time of writing, the correlation coefficient is 0.69, indicating that the price fluctuations of the two closely track one another.
With the crypto market on a downward trend, it is easy to assert that ETH’s investors and traders are in it for the long haul.
Gary Gensler, chairman of the Securities and Exchange Commission, stated that staking might classify Ethereum as a security, exposing ETH to legal difficulties.
Ethereum is not, however, the only cryptocurrency that uses proof-of-stake. ADA, SOL, and DOT are based on the proof-of-stake protocol.
If Ethereum is categorized as a security, the other currencies could be subject to regulatory investigation, leading to additional price declines for Ethereum and other proof-of-stake currencies.
In the short run, $1,329.91 has proven to be a price level that can survive a bearish assault. Only time will tell whether Ethereum will rebound from this decline.
ETH total market cap at $164.5 billion on the daily chart | Source: TradingView.com
Featured image from Coinpedia, Chart: TradingView.com
(The analysis represents the author’s personal views and should not be construed as investment advice).
Bitcoin Monthly Stats: Cost Basis, Long-Term Holders, And The Cyclical Bottom
In this month’s The Bitcoin Monthly, ARK Invest focused on Ethereum and the Merge. As a side dish, they did publish some premium and review-worthy stats that we’re about to cover. Never mind the market, the Bitcoin network keeps producing block after block regardless. The stats that this whole activity produces can be critical in understanding the market, though.
That’s where ARK Invest’s The Bitcoin Monthly comes in. The publication defines itself as “an “earnings report” that details on-chain activity and showcases the openness, transparency, and accessibility of blockchain data.” So, the data we’re about to cover is The Bitcoin Monthly’s reason to be.
The Bitcoin Monthly: 200-Week Moving Average And Investor Cost Basis
- “After closing above its 200-week moving average in July,1 bitcoin’s price reversed and slipped below it in August. Currently at $22,680, the 200-week moving average now seems to be resistance.”
The center couldn’t hold. The price’s recovery was short-lived. Markets are red across the board and bitcoin is no exception. At the time of writing, bitcoin trades at $19,874. For those keeping score, that’s just below last cycle’s all-time high of $20K. Something that shouldn’t happen, but a few degrees of error are always understandable.
- “Bitcoin currently trades above investor cost basis at $19,360, its strongest on-chain support level (…) Importantly, throughout bitcoin’s history, trading at investor price usually marks a bottoming process.”
Times are tough, but bitcoin still trades above investor cost basis. The Bitcoin Monthly clarifies, “Investor price is calculated by subtracting the cost basis of miners from the general cost basis of the market.” As we see it, The Bitcoin Monthly is calling the bottom. They didn’t say it in those exact words, but they certainly insinuated it.
Is the bottom really in, though?
BTC price chart for 09/17/2022 on Gemini | Source: BTC/USD on TradingView.com
The Bitcoin Monthly: Short-Term Holder Vs. Long-Term Holder
- “The short-term-holder (STH) cost basis is approaching its longterm-holder (LTH) cost basis ––an event that has marked cyclical bottoms in the past. (…) Since the end of July, the difference between short- and long-term holders’ cost basis has shrunk from $5,840 to $2,500”
The Bitcoin Monthly sees it as a sign that “the market typically is capitulating and shifting back to long-term participation.” Bitcoin’s consolidation process might be ending soon. We could stay for a while in the bottom area, though. That has happened before. The point is, all of the indicators The Bitcoin Monthly highlighted this month point in the same direction. To the bottom.
- “The supply held by long-term bitcoin holders is 34,500 coins away from reaching 13.55 million– its all-time high. Long-term-holder supply constitutes 70.6% of total outstanding supply.
This one is the most bullish of all the featured stats. To clarify, coins that haven’t moved in 155 days or more qualify as “long-term holder supply.” The tourists and the people with high hopes left a long time ago. And the lion’s share of the bitcoin supply is now in the true believers’ possession. A remarkable situation that doesn’t get mentioned enough.
About The Ethereum Merge
- “In August, ether outperformed bitcoin by 7.6% (…) Historically, ether has outperformed bitcoin during “riskon” bull markets and underperformed during “risk-off” bear markets.”
The merge’s effects affected the market throughout the whole narrative. Even though we’re in a “risk-off bear market,” ETH took over and lead the market for a while there. They accomplished the mythical feat and… the market turned on them. After what seemed like mission accomplished, ETH’s price started to bleed.
Hidden behind a secret door, that’s what The Bitcoin Monthly contained.
Featured Image by Maxim Hopman on Unsplash | Charts by TradingView
Nifty News: Rumors of new Yuga Labs collection quashed, Budweiser celebrates the Merge and more…

Yuga Labs was said to be looking at raising around $50 million from the sale of 100,000 tokenized land plots, but the firm’s co-founder says it’s all “fake news.”
WATCH: Ethereum Merge Sell The News Event | ETHUSD September 15, 2022
In this episode of NewsBTC’s daily technical analysis videos, we examine the price action in Ethereum following the Merge upgrade in both the ETHUSD and ETHBTC trading pairs.
Take a look at the video below:
VIDEO: Ethereum Price Analysis (ETHUSD): September 15, 2022
Overnight last night, the Ethereum Merge upgrade occurred. As many expected, it turned out to be a sell-the-news event for the second-ranked cryptocurrency and has fallen by more than 10% intraday on the USD pair.
ETHUSD Pair Turns Bearish Post-Merge
On daily timeframes, things continue to look bad for Ethereum and other top crypto assets. The stock market is also in danger, adding stress to the entire situation.
ETHUSD on daily timeframes could be forming a head and shoulders top, just as LMACD crosses bearish. More downside could be necessary where the Relative Strength Index would hopefully find support at a lower trend line.
Ethereum sold off sharply after The Merge update was completed | Source: ETHUSD on TradingView.com
The Remaining Bullish Signal On Ethereum Weekly Charts
Turning on the Ichimoku gives Ether bulls at least some hope of hanging onto recent gains. Finding support in the Ichimoku cloud could lead to renewed energy and a retest of highs. The Ichomuku on Ethereum weekly charts also is trying to find support above the Tenkan-sen. Slightly above the Tenkan-sen is an even more important line to hold: the middle Bollinger Band.
Finding support above the middle Bollinger Band has in the past led to some of the altcoin’s strongest bull trends.
ETHUSD attempts to hold above the middle Bollinger Bands on weekly timeframes | Source: ETHUSD on TradingView.com
Related Reading: WATCH: Bitcoin Brutalized After August CPI Data Release | BTCUSD September 13, 2022
Ether Takes Beating On ETHBTC Ratio
The downside in Ethereum could be due to ongoing bearish macro conditions and strength in the dollar, but Ether even took a dive on the BTC trading pair.
Although the ETHUSD pair is hoping to find support at the bottom of the Ichimoku cloud, the BTC pair is trying to establish support above the cloud both on daily and weekly timeframes. On the weekly, the bottom of the cloud was already tested and held, which is a bullish sign. However, the downtrend resistance line appears to have struck again and sent Ether tumbling against Bitcoin.
Despite the bearish signals on the ETHBTC pair, the video’s conclusion provides a longer-term bullish outlook you have to see for the full picture.
Was downtrend resistance able to stop Ethereum once again? | Source: ETHBTC on TradingView.com
Learn crypto technical analysis yourself with the NewsBTC Trading Course. Click here to access the free educational program.
Follow @TonySpilotroBTC on Twitter or join the TonyTradesBTC Telegram for exclusive daily market insights and technical analysis education. Please note: Content is educational and should not be considered investment advice.
Featured image from iStockPhoto, Charts from TradingView.com


