Tron price is gaining pace above the $0.1220 resistance against the US Dollar. TRX is outperforming Bitcoin and could rise further above $0.1250.
- Tron is moving higher above the $0.120 resistance level against the US dollar.
- The price is trading above $0.1220 and the 100 simple moving average (4 hours).
- There was a break above a key bearish trend line with resistance at $0.120 on the 4-hour chart of the TRX/USD pair (data source from Kraken).
- The pair could continue to climb higher toward $0.1275 or even $0.1320.
Tron Price Regains Strength
Recently, Bitcoin and Ethereum saw a fresh decline below $63,500 and $3,100 respectively. However, Tron price remained stable above the $0.1180 support and even climbed higher.
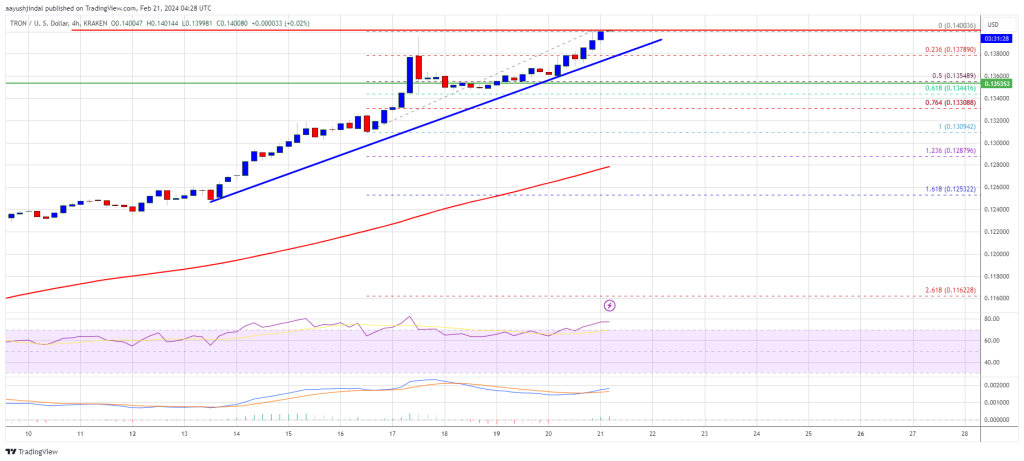
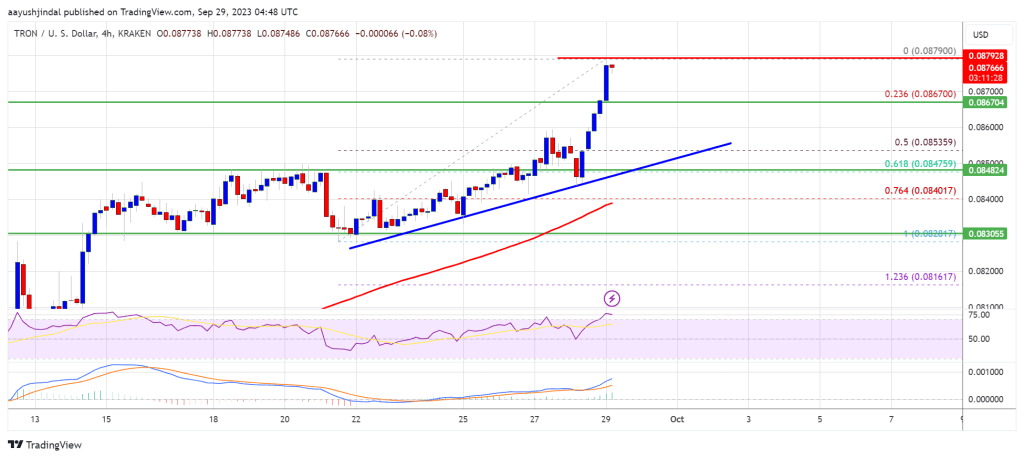
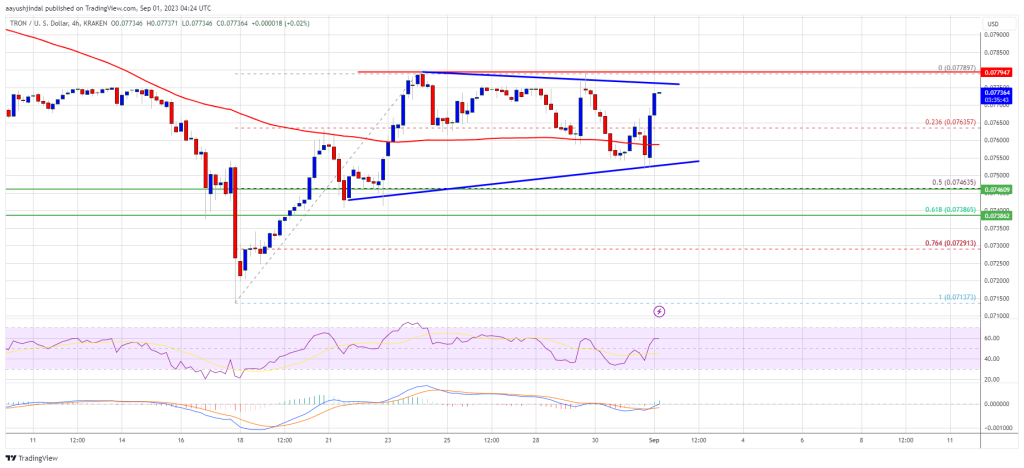
There was a decent move above the $0.120 resistance zone. TRX price cleared the 50% Fib retracement level of the downward move from the $0.1239 swing high to the $0.1181 low. Besides, there was a break above a key bearish trend line with resistance at $0.120 on the 4-hour chart of the TRX/USD pair.
Tron price is now trading above $0.1220 and the 100 simple moving average (4 hours). On the upside, an initial resistance is near the $0.1250 level.
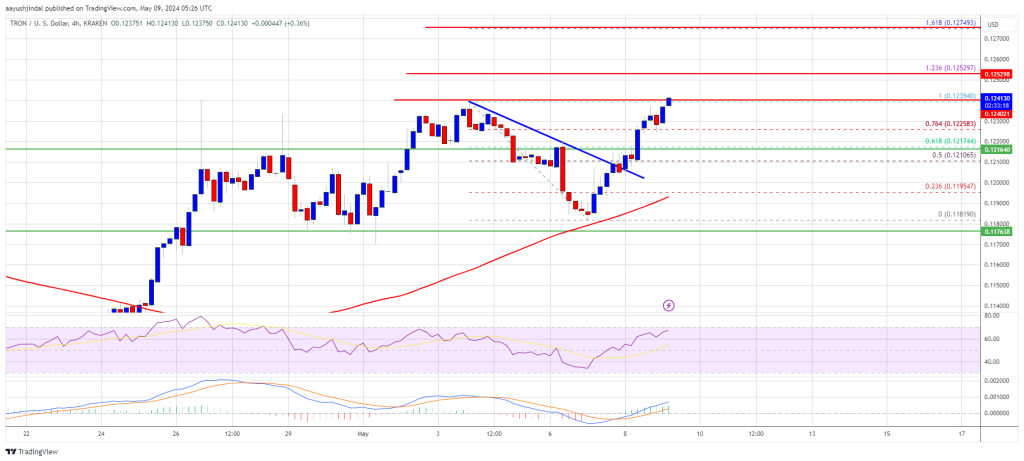
Source: TRXUSD on TradingView.com
The first major resistance is near $0.1275 or the 1.618 Fib extension level of the downward move from the $0.1239 swing high to the $0.1181 low, above which the price could accelerate higher. The next resistance is near $0.1320. A close above the $0.1320 resistance might send TRX further higher toward $0.1365. The next major resistance is near the $0.140 level, above which the bulls are likely to aim for a larger increase toward $0.150.
Are Dips Supported in TRX?
If TRX price fails to clear the $0.1250 resistance, it could start a downside correction. Initial support on the downside is near the $0.1220 zone.
The first major support is near the $0.1195 level or the 100 simple moving average (4 hours), below which it could test $0.1180. Any more losses might send Tron toward the $0.1150 support in the coming sessions.
Technical Indicators
4 hours MACD – The MACD for TRX/USD is gaining momentum in the bullish zone.
4 hours RSI (Relative Strength Index) – The RSI for TRX/USD is currently above the 50 level.
Major Support Levels – $0.1220, $0.1195, and $0.1180.
Major Resistance Levels – $0.1250, $0.1275, and $0.1320.