UNI Price Prediction – Uniswap Recovery Could Remain Capped

UNI price turned red and declined below the $10.00 support. Uniswap is showing many bearish signs and recoveries could face hurdles near $10.00.

  • UNI started a fresh decline below the $10.00 support zone.
  • The price is trading below $9.50 and the 100 simple moving average (4 hours).
  • There is a key bearish trend line forming with resistance near $10.25 on the 4-hour chart of the UNI/USD pair (data source from Kraken).
  • The pair might recover but the upsides might be limited above $10.00.

UNI Price Takes Hit

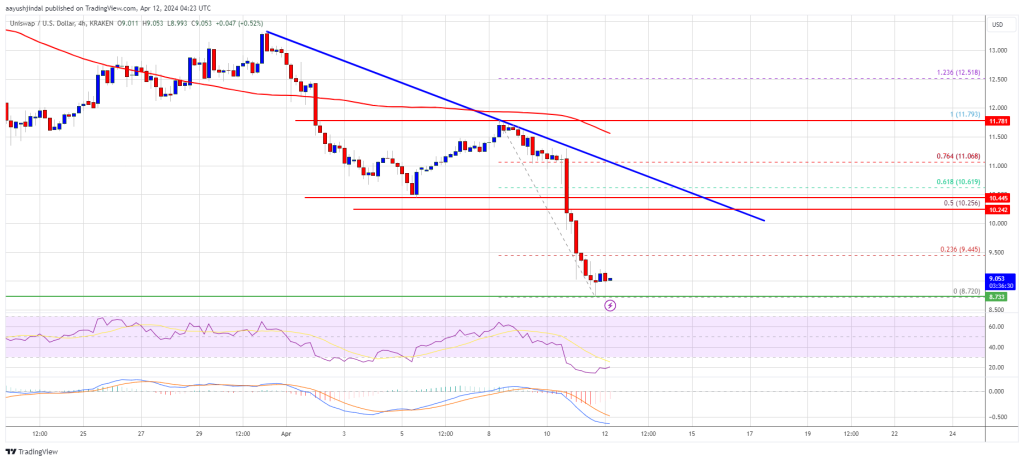
After the SEC news, UNI started a major decline. There was an increase in selling pressure on Uniswap below the $12.00 pivot level. The price declined over 15% and traded below the $10.00 support. It also increased some pressure on Bitcoin and Ethereum.

There was also a drop below the $9.20 level. The price traded as low as $8.72 and it is still showing many bearish signs. There is also a key bearish trend line forming with resistance near $10.25 on the 4-hour chart of the UNI/USD pair.

UNI price is now trading well below $10.00 and the 100 simple moving average (4 hours). Immediate resistance on the upside is near the $9.45 level. It is near the 23.6% Fib retracement level of the downward move from the $11.79 swing high to the $8.72 low.

The next key resistance is near the $10.25 level or the trend line. It coincides with the 50% Fib retracement level of the downward move from the $11.79 swing high to the $8.72 low.

UNI Price Prediction

Source: UNIUSD on TradingView.com

A close above the $10.25 level could open the doors for more gains in the near term. The next key resistance could be near $11.80, above which the bulls are likely to aim a test of the $12.00 level. Any more gains might send UNI toward $13.50.

More Losses In Uniswap?

If UNI price fails to climb above $9.45 or $9.50, it could continue to move down. The first major support is near the $8.70 level.

The next major support is near the $8.50 level. A downside break below the $8.50 support might open the doors for a push toward $7.65.

Technical Indicators

4-Hours MACD – The MACD for UNI/USD is gaining momentum in the bearish zone.

4-Hours RSI (Relative Strength Index) – The RSI for UNI/USD is below the 25 level.

Major Support Levels – $8.70, $8.50, and $7.65.

Major Resistance Levels – $9.45, $10.00, and $10.25.
UNI Price Prediction – Uniswap Bulls Sight Key Bullish Move To $7

UNI price is moving higher from the $6.00 support. Uniswap is up 5% and it could rally if there is a clear move above the $6.35 resistance zone.

  • UNI started a fresh increase from the $5.50 support zone.
  • The price is trading above $6.00 and the 100 simple moving average (4 hours).
  • There is a key bearish trend line forming with resistance near $6.20 on the 4-hour chart of the UNI/USD pair (data source from Kraken).
  • The pair is showing bullish signs and might rally if it clears the $6.35 resistance.

UNI Price Aims Higher

After forming a support base above $5.65, UNI started a fresh increase. There was a decent upward move in Uniswap above the $6.00 and $6.20 resistance levels.

However, the bears were active near the $6.35 zone. A high was formed at $6.33 before there was a downside correction. The price declined below the $6.20 level. There was a move below the 23.6% Fib retracement level of the upward move from the $5.53 swing low to the $6.33 high.

It tested the $6.00 support and the 50% Fib retracement level of the upward move from the $5.53 swing low to the $6.33 high. Uniswap is rising again above the $6.10 level, outperforming Bitcoin and Ethereum.

UNI price is trading above $6.00 and the 100 simple moving average (4 hours). Immediate resistance on the upside is near the $6.20 level. There is also a key bearish trend line forming with resistance near $6.20 on the 4-hour chart of the UNI/USD pair.

UNI Price Prediction

Source: UNIUSD on TradingView.com

The next key resistance is near the $6.35 level. A close above the $6.35 level could open the doors for more gains in the near term. The next key resistance could be near $7.00, above which the bulls are likely to aim a test of the $7.20 level. Any more gains might send UNI toward $7.50.

Dips Supported in Uniswap?

If UNI price fails to climb above $6.20 or $6.35, it could start another downside correction. The first major support is near the $6.00 level.

The next major support is near the $5.85 level. A downside break below the $5.85 support might open the doors for a push toward $5.50.

Technical Indicators

4-Hours MACD – The MACD for UNI/USD is gaining momentum in the bullish zone.

4-Hours RSI (Relative Strength Index) – The RSI for UNI/USD is above the 50 level.

Major Support Levels – $6.00, $5.85 and $5.50.

Major Resistance Levels – $6.20, $6.35 and $7.00.

UNI Price Prediction – Uniswap Momentum Reignites, 15% Lift-off Possible

UNI price is moving higher from the $5.65 support. Uniswap is up 5% and it seems like the bulls could aim a fresh surge toward the $8.00 zone.

  • UNI started a fresh increase above the $6.00 and $6.20 resistance levels.
  • The price is trading above $6.50 and the 100 simple moving average (4 hours).
  • There was a break above a key bearish trend line with resistance near $6.60 on the 4-hour chart of the UNI/USD pair (data source from Kraken).
  • The pair is showing bullish signs and might rally if it clears the $7.25 resistance.

UNI Price Aims Higher

After forming a support base above $5.65, UNI started a fresh increase. The bulls were able to push Uniswap’s price above the $6.00 and $6.20 resistance levels, outperforming Bitcoin and Ethereum.

There was a break above a key bearish trend line with resistance near $6.60 on the 4-hour chart of the UNI/USD pair. The pair even cleared the $6.75 resistance level. It is now approaching the 50% Fib retracement level of the downward move from the $8.24 swing high to the $5.67 low.

UNI is now trading above $6.50 and the 100 simple moving average (4 hours). Immediate resistance on the upside is near the $6.95 level. The next key resistance is near the $7.250 level. It is close to the 61.8% Fib retracement level of the downward move from the $8.24 swing high to the $5.67 low.

UNI Price Prediction

Source: UNIUSD on TradingView.com

A close above the $7.25 level could open the doors for more gains in the near term. The next key resistance could be near $7.65, above which the bulls are likely to aim a test of the $8.00 level. Any more gains might send UNI toward $8.25.

Dips Supported in Uniswap?

If UNI price fails to climb above $6.95 or $7.25, it could correct further lower. The first major support is near the $6.60 level or the 100 simple moving average (4 hours).

The next major support is near the $6.25 level. A downside break below the $6.25 support might open the doors for a push toward $6.00.

Technical Indicators

4-Hours MACD – The MACD for UNI/USD is gaining momentum in the bullish zone.

4-Hours RSI (Relative Strength Index) – The RSI for UNI/USD is well above the 50 level.

Major Support Levels – $6.60, $6.25 and $6.00.

Major Resistance Levels – $6.95, $7.25 and $8.00.

UNI Price Prediction – After 25% Rally Uniswap Turned Attractive On Dips

UNI price rallied over 25% and climbed above $6.20. Uniswap is now consolidating gains and any dips might be attractive to the bulls in the near term.

  • UNI started a fresh increase above the $5.20 and $6.00 resistance levels.
  • The price is trading above $5.80 and the 100 simple moving average (4 hours).
  • There was a break above a key declining channel with resistance near $5.25 on the 4-hour chart of the UNI/USD pair (data source from Kraken).
  • The pair might correct lower, but the bulls could be active near the $5.60 and $5.55 levels.

UNI Price Regains Strength

After forming a support base above $4.80, UNI started a fresh surge. The bulls were able to push Uniswap’s price above the $5.25 and $5.30 resistance levels, outperforming Bitcoin and Ethereum.

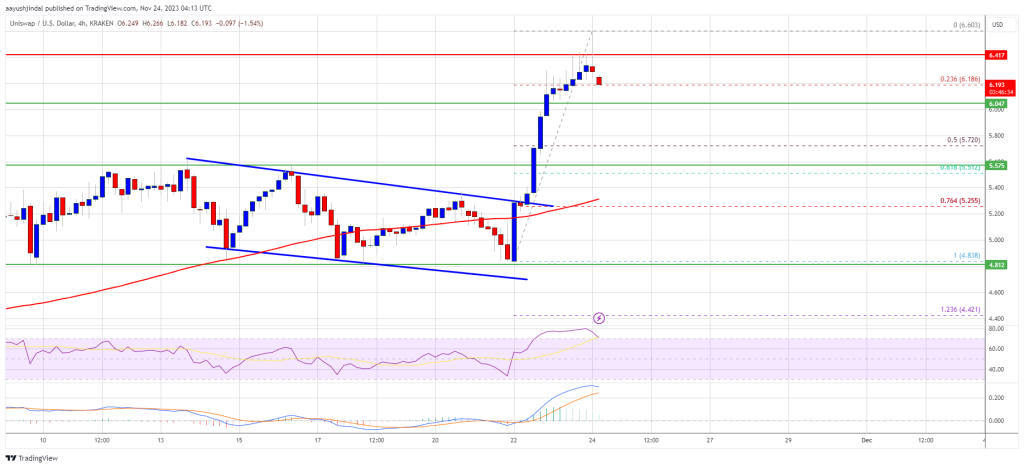
There was a break above a key declining channel with resistance near $5.25 on the 4-hour chart of the UNI/USD pair. The pair pumped over 25% and even climbed above $6.20. A new multi-week high was formed near $6.60 and the price is correcting lower.

There was a move below the $6.25 level. Uniswap is now approaching the 23.6% Fib retracement level of the upward move from the $4.83 low to the $6.60 high.

UNI is still trading above $5.80 and the 100 simple moving average (4 hours). If there is a fresh increase, the price might face resistance near the $6.40 level. The next key resistance is near the $6.60 level. A close above the $6.60 level could open the doors for more gains in the near term.

UNI Price Prediction

Source: UNIUSD on TradingView.com

The next key resistance could be near $6.88, above which the bulls are likely to aim a test of the $7.00 level. Any more gains might send UNI toward $7.20.

Dips Supported in Uniswap?

If UNI price fails to climb above $6.40 or $6.60, it could correct further lower. The first major support is near the $6.05 level. The next major support is near the $5.70 level.

The mains support is near $5.55 or the 61.8% Fib retracement level of the upward move from the $4.83 low to the $6.60 high. A downside break below the $5.55 support might open the doors for a push toward $5.00.

Technical Indicators

4-Hours MACD – The MACD for UNI/USD is losing momentum in the bullish zone.

4-Hours RSI (Relative Strength Index) – The RSI for UNI/USD is well above the 50 level.

Major Support Levels – $6.05, $5.70 and $5.55.

Major Resistance Levels – $6.40, $6.60 and $7.00.

Charted: Uniswap’s UNI Sets New ATH At $45, Why It Could Extend Gains

Uniswap’s UNI gained momentum and traded to a new all-time high near $45.00 against the US Dollar. The price is likely to continue higher above $45.50 and $46.00 in the near term.

  • UNI started a fresh increase after forming a base above the $40.00 level against the US dollar.
  • The price is trading nicely above $42.00 and the 100 simple moving average (4-hours).
  • There was a break above a major contracting triangle with resistance near $40.00 on the 4-hours chart of the UNI/USD pair (data source from Kraken).
  • The pair is likely to continue higher if it clears the $45.00 and $45.50 resistance levels in the near term.

Uniswap’s UNI Gains Traction

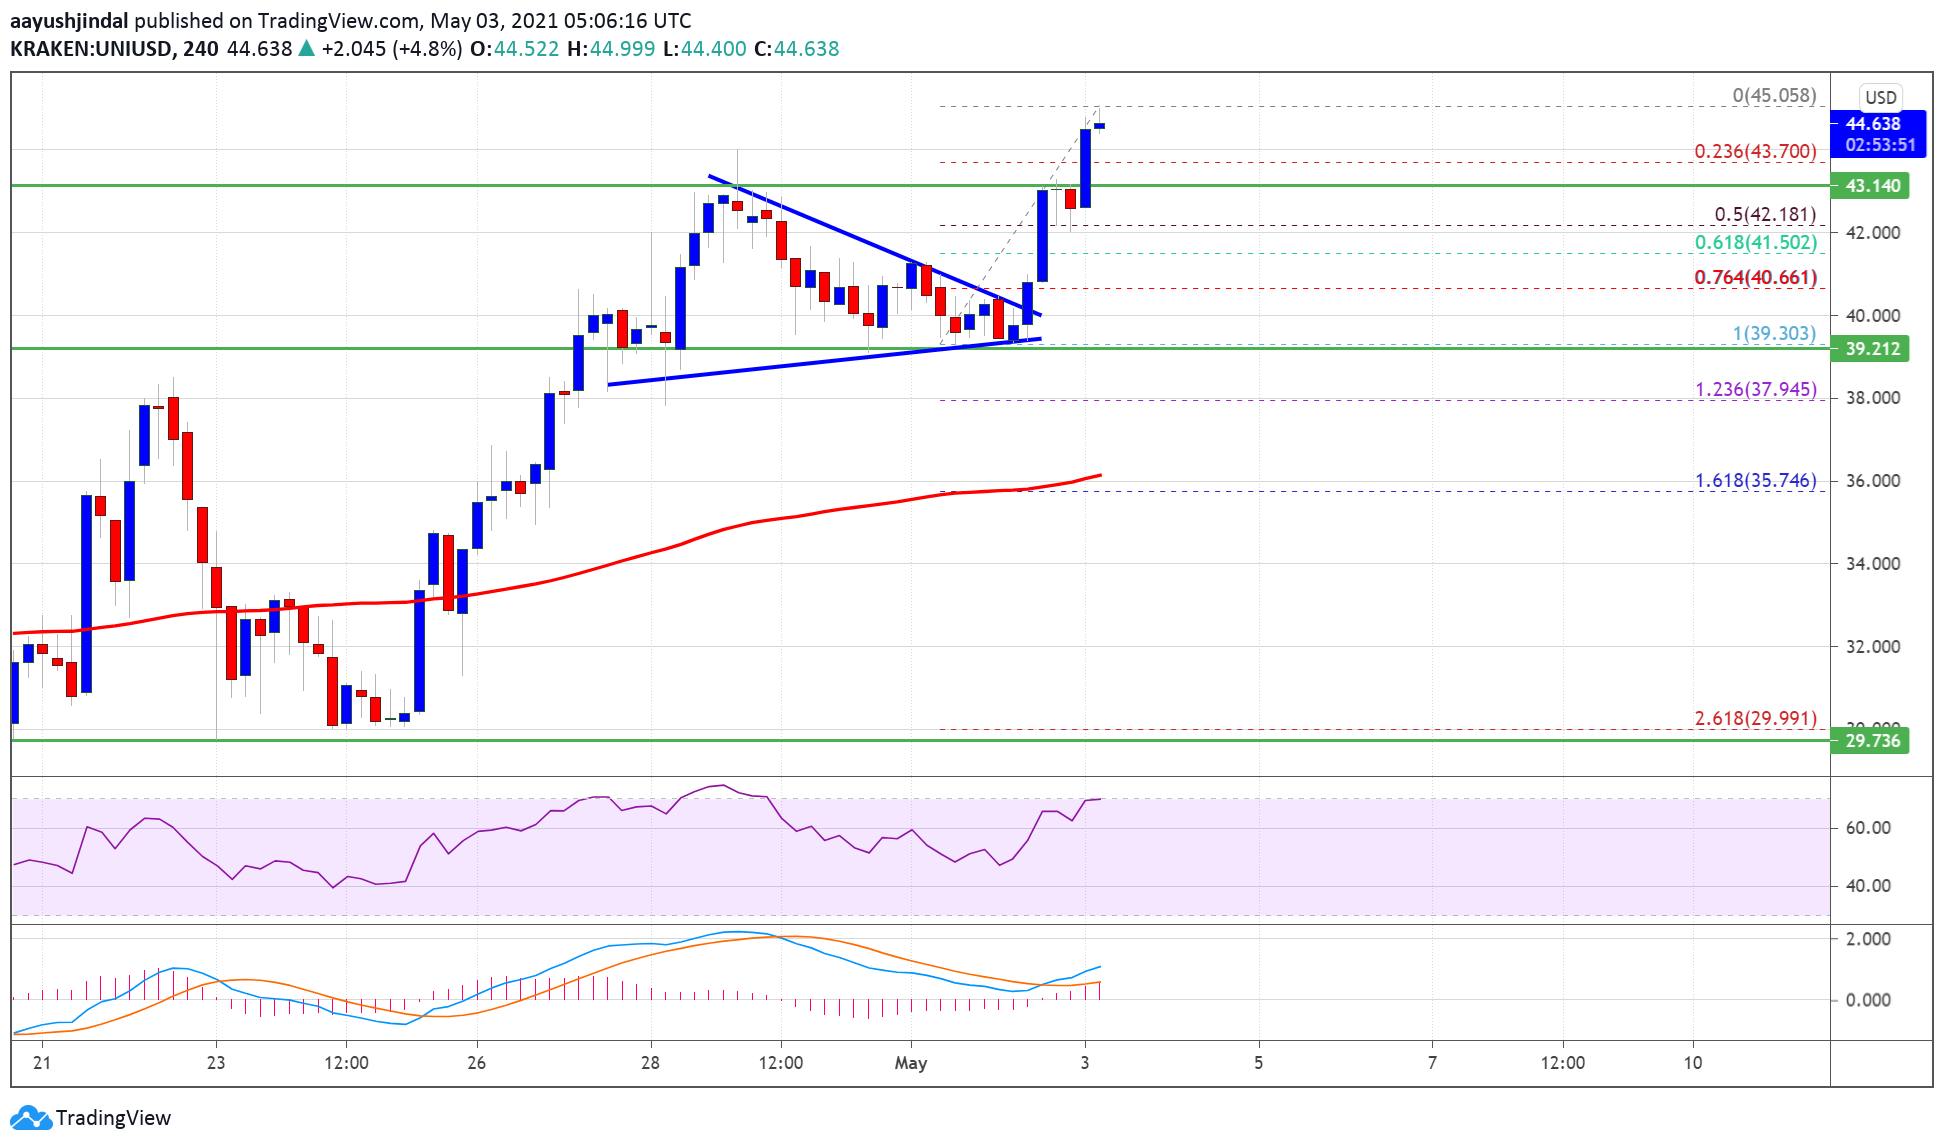
After forming a support base above $40.00, UNI started a fresh increase. The last swing low was near $39.30 before the bulls pushed the price above the $42.00 resistance.

There was a break above a major contracting triangle with resistance near $40.00 on the 4-hours chart of the UNI/USD pair. The pair broke the $43.00 and $44.00 resistance levels. A new all-time high is formed near $45.05, with a bullish angle, unlike bitcoin and just like ethereum.

The price is now trading nicely above $42.00 and the 100 simple moving average (4-hours). An immediate support is near the $43.70 level. It is close to the 23.6% Fib retracement level of the upward move from the $39.30 low to $45.05 high.

Uniswap’s UNI

Source: UNIUSD on TradingView.com

On the upside, the price is facing hurdles near $45.00. A close above the $45.00 level could open the doors for a more gains in the near term. The next key resistance could be near $46.50, above which the bulls are likely to aim a test of the $50.00 level.

Dips Supported?

If UNI price fails to climb above $45.00 or $45.50, it could correct lower. The first major support is near the $43.70 and $43.50 levels.

The main support is now forming near the $42.00 zone. It is near the 50% Fib retracement level of the upward move from the $39.30 low to $45.05 high. A downside break below the $42.00 support might open the doors for a push towards the key $40.00.

Technical Indicators

4-Hours MACD – The MACD for UNI/USD is gaining momentum in the bullish zone.

4-Hours RSI (Relative Strength Index) – The RSI for UNI/USD is well above the 60 level.

Major Support Levels – $43.50, $42.00 and $40.00.

Major Resistance Levels – $45.00, $46.50 and $50.00.

UNI Mum as Uniswap V3 Announcement Leaves Bulls Wanting More

Key Uniswap Takeaways

  • Uniswap (UNI/USD) surged on Wednesday but lacked the momentum to turn the upside move into a price rally.
  • The move uphill appeared after the decentralized exchange unveiled a long-awaited network upgrade.
  • No hints on gas-solving layer-2 solution left bulls wanting more upside cues.

Uniswap climbed on Wednesday after the leading decentralized exchange team released details on its major upcoming protocol upgrade.

V3 Outlook

The latest published specifications showed that the “Uniswap V3” update would improve gas fee issues on the network. Uniswap consumes a majority of gas fees on the Ethereum network. Data fetched by ETH Gas Station shows that the exchanged charged $2 million worth of ETH for transactions in the past 30 days.

Uniswap’s new iteration aims to solve gas issues. However, the exchange won’t alleviate the problems until it launched its Layer 2 scaling solution, powered by a separate “Optimism” solution, which is also a part of the Uniswap v3 update.

The new revelations did not provide enough updates about when Uniswap would integrate Optimism into its protocol. But the exchange did state that it would introduce “concentrated liquidity,” a feature that would provide individual liquidity providers “granular control” over price areas for their allocated capital.

“Liquidity providers can provide liquidity with up to 4000x capital efficiency relative to Uniswap v2, earning higher returns on their capital,” the update read. “Even with these groundbreaking design improvements, the gas cost of v3 swaps on Ethereum mainnet is slightly cheaper than v2. Transactions made on the Optimism deployment will likely be significantly cheaper!”

UNI/USD Climbs Cautiously

The UNI/USD exchange rate jumped 1.48 percent to $31.47 after the Uniswap V3 announcement. Nevertheless, the pair’s volumes declined in the period of upside moves, showing a lack of bullish conviction among traders.

Uniswap, UNIUSD, UNIUSDT, UNIBTC, cryptocurrency, decentralized finance
Uniswap posts cautious gains after its v3 update. Source: UNIUSD on TradingView.com

Uniswap also faced downside pressure from its 50-4H simple moving average wave, which served as short-term resistance for the token. A break above the price ceiling posed the greater potential for UNI to reach the $35-36 price range as it attempts a full-fledged breakout out of its Ascending Triangle, a bullish continuation pattern.

Meanwhile, a failure to close above the 50-4HMA risked having Uniswap bears test the Triangle’s lower trendline for a downside breakout.

Charted: Why Uniswap’s UNI Could Surge Above $35 and $40

Uniswap’s UNI is showing positive signs above $32.00 against the US Dollar. The price is likely to clear the $35.00 resistance and it could even rally towards the $40.00 level.

  • UNI is very stable above the $27.50 and $30.00 support levels against the US dollar.
  • The price is trading nicely above $32.00 and the 100 simple moving average (4-hours).
  • There is a key bullish trend line forming with support near $32.50 on the 4-hours chart of the UNI/USD pair (data source from Kraken).
  • The pair is likely to continue higher if it clears the $35.00 and $35.50 resistance levels in the near term.

Uniswap’s UNI Approaching Key Breakout

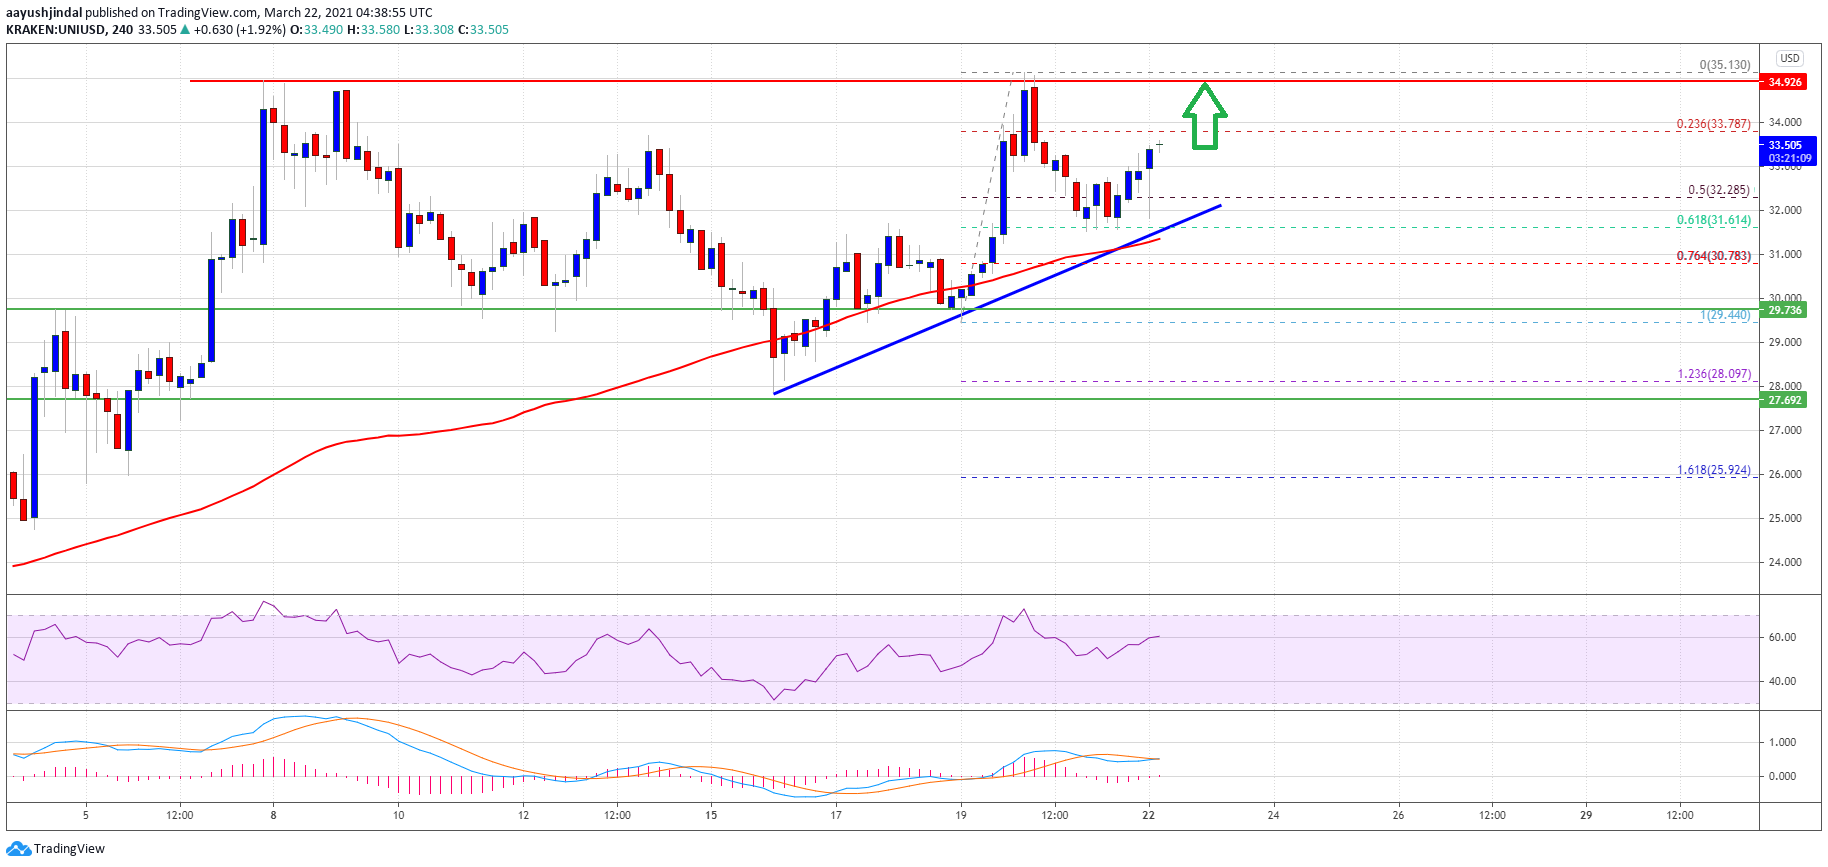
After a sharp downside correction towards the $27.50 support, UNI started a fresh increase. The last swing low was near $29.44 before the bulls pushed the price above the $30.00 resistance.

It broke the $31.00 and $32.00 resistance levels. There was a fresh test of the main $35.00 resistance. A high was formed near $35.13 before there was a minor decline. UNI dipped below the $33.50 level. There was a break below the 50% Fib retracement level of the upward move from the $29.44 low to $35.13 high.

Uniswap’s UNI

Source: UNIUSD on TradingView.com

It is now trading nicely above $32.00 and the 100 simple moving average (4-hours). The price is also stable above the 61.8% Fib retracement level of the upward move from the $29.44 low to $35.13 high.

Moreover, there is a key bullish trend line forming with support near $32.50 on the 4-hours chart of the UNI/USD pair. On the upside, the price is facing hurdles near $34.00. The main resistance is still near $35.00. A close above the $35.00 level could open the doors for a strong increase towards the $40.00 resistance zone.

Dips Supported?

If UNI price fails to climb above $34.00 or $35.00, it could correct lower. The first major support is near the $32.80 and $32.50 levels.

The main support is now forming near the $32.00 zone and the trend line. A downside break below the $32.00 support might open the doors for a push towards the $27.50 support. Any more losses may possibly lead the price towards the $27.50 zone.

Technical Indicators

4-Hours MACD – The MACD for UNI/USD is gaining momentum in the bullish zone.

4-Hours RSI (Relative Strength Index) – The RSI for UNI/USD is well above the 50 level.

Major Support Levels – $32.50, $32.00 and $30.00.

Major Resistance Levels – $34.00, $35.00 and $40.00.