$1.3+ Trillion: Bitcoin Market Cap Sets New Record All-Time High

Considering the seemingly unstoppable momentum in Bitcoin price action, a new all-time high on the BTCUSD trading pair is less than 2% away. Meanwhile, due to the supply of new BTC unlocked since 2021, the BTC market cap chart has reached a new all-time high above $1.3 trillion.

BTC Market Cap Sets New Record ATH

Crypto bulls have something to celebrate today, even if BTCUSD doesn’t make a new all-time high just yet. That’s because the market cap chart has, and the total value of the Bitcoin network is currently around $1.33 trillion.

The previous peak was squarely set at $1.3 trillion back in December 2021, just prior to the top cryptocurrency falling into the troughs of a bear market.

BTC_2024-03-04_17-02-32

Other Bitcoin Charts At New Record Highs

The BTC market cap chart as calculated by TradingView, isn’t the only non-USD chart that’s made new all-time highs. The reigning king of crypto has also broken records in over a dozen different national currencies, such as the Australian Dollar, which is trading over $100,000 per coin.

At current prices of $67,900, BTCUSD is less than 2% away from a new all-time high itself. Can the top cryptocurrency set a new record this week?

BREAKING: Bitcoin Price Smashes Above $60,000: Are New ATHs Ahead?

Bitcoin price action continues to pick up steam following unprecedented institutional demand amidst an asset supply that’s on the brink of being slashed by 50%. Today, the BTCUSD trading pair has broken cleanly above $60,000. What does this mean for the top cryptocurrency by market cap? Are new all-time highs just ahead?

Bitcoin Trades Above $60,000 For First Time Since 2021

Just one month ago, Bitcoin was still stuck below $50,000 and the launch of the first ever US spot BTC ETFs were considered a sell the news event. Now, with only a day left in February, Bitcoin price is showing serious strength with a more than 40% single month increase. Bullish momentum has pushed BTCUSD above $60,000 where it is trading currently.

BTCUSD_2024-02-28_08-35-24

The bullish price action is due to the market front-running the halving now that the the impact of the introduction of the first meaningful Bitcoin ETFs are understood. ETF providers yesterday added as much as 9,000 BTC to holdings, while miners only managed to produce 900 BTC in the same timeframe. This amount is slashed by 50% at the halving in less than two months, potentially prompting institutional FOMO (fear of missing out).

With Bitcoin now above $60,000 and around 13% away from all-time highs, new price records are within striking distance. After any cryptocurrency price takes out a current peak, price action moves into discovery due to a lack of sell orders in the order book. With no historical resistance to consider, Fibonacci ratios often help pinpoint there rallies will come to a conclusion.

According to the 1.272 Fibonacci, BTCUSD could begin finding psychological resistance around $94,000 per coin. The ultimate “top” of this rally could extend to the 1.618 Fibonacci, located at around $155,000 per BTC.
BTCUSD_2024-02-28_08-59-49

To hit $155,000 per coin, Bitcoin only needs a 161% advance from current levels. To put this into perspective, the top brass crypto asset is up more than 300% from the bottom set in 2022, and there wasn’t a bull market to speak of yet. With the bull market now undeniable, it isn’t unreasonable to assume BTCUSD could climb by 161% over the remainder of 2024.

Why “Overbought” Bitcoin Could Trigger A 107% Rally

Bitcoin price had previously been showing extreme strength leading up until the debut of the first spot ETFs. That strength has since subsided, leading to a 20% correction in BTCUSD.

A popular technical indicator that measures momentum, however, could point to powerful continuation to the upside, but only if a certain level is breached. Keep reading to learn more about the Relative Strength Index and how the top cryptocurrency behaves once the market reaches an “overbought” level.

Bitcoin Approaches “Overbought” And Why This Isn’t A Bad Thing

The Relative Strength Index is a momentum-measuring tool that signals when a market is “overbought” or “oversold”. When a financial asset reaches such conditions, it often means the trend is about to change.

In Bitcoin and other cryptocurrencies, the weekly RSI is often a signal that the asset is moving into its most powerful phase. For example, Bitcoin made it above a reading of 70 in October 2023, and only weeks later saw an over 60% rally to local 2024 highs.

Now 1W BTCUSD charts are showing an RSI reading of just below 70, pointing to a possible close back above the overbought level. If bulls can keep the top cryptocurrency by market cap above $43,650, the weekly RSI should close above the threshold.

bitcoin rsi

BTCUSD Historical 1W Relative Strength Data

Historical data could possibly shed some light on what might happen if the weekly Relative Strength Index gets the close above 70 as anticipated.

Over the last ten years, Bitcoin saw a 1W RSI close above 70 a total of 13 times. This happened 8 times in 2016 and 2017, twice in 2019, and once each in 2020 and 2021. One additional instance occurred in 2023.

Of the 13 times, the average gain after the RSI closed above 70 to the peak of the movement was 107%. The largest rally was in 2020, bringing over 400% returns. The smallest rally was in 2016 and saw only a 20% gain.

After removing the largest and smallest outliers, the average drops down to around 61%. This could mean that Bitcoin could produce on average a move between 61 and 107%.

A 61% gain takes BTCUSD back to just under $68,000 and shy of a new all-time high, while a 107% move sets a new record closer to $90,000 per coin. The cryptocurrency is also potentially working on a bull flag pattern, with a target of around $77,000.

Bitcoin bull flag rsi

Bitcoin plummets 20% post-ETF approvals: what’s behind the crash?

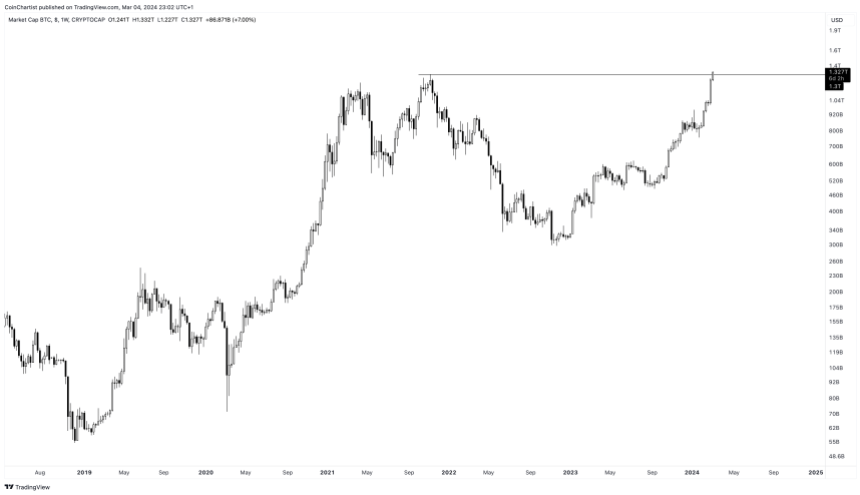
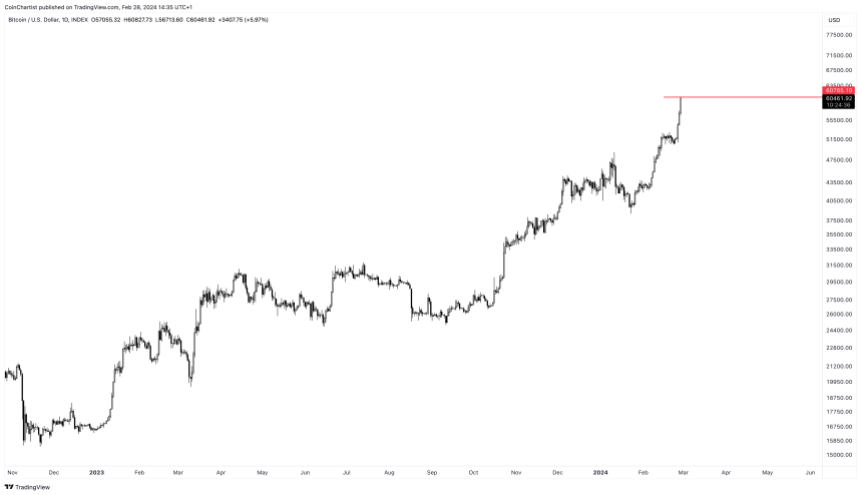
The recent approval of several spot Bitcoin exchange-traded funds (ETFs) by the SEC was expected to usher in an era of mainstream adoption and sky-high prices for the flagship Cryptocurrency. Instead, Bitcoin has crashed over 20% from its 2024 high of $49,000 to just under $39,000 at the time of writing.

Where is the bottom of this crash? Is this a buy the dip opportunity? And most importantly, is this sharp correction the end of the bull market in Crypto? We explore the factors behind the selloff, and why this could ultimately lead to more bullish price action in the top Cryptocurrency by market cap.

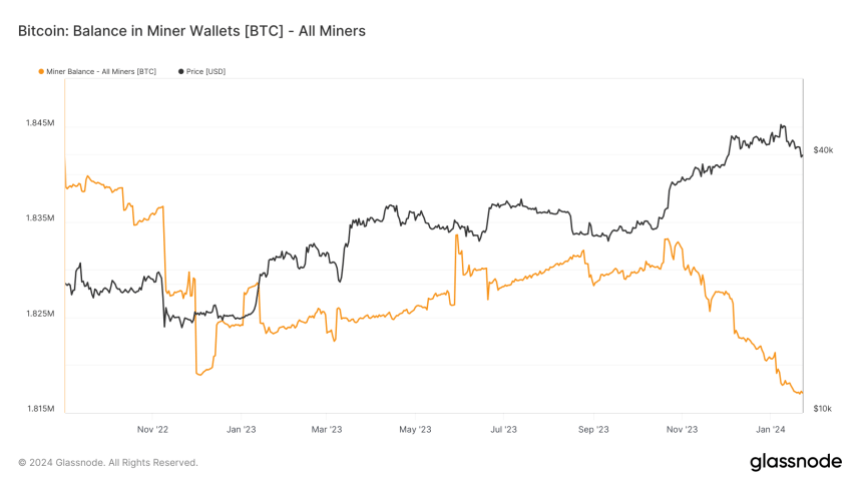
Miners selling Bitcoin at the same time

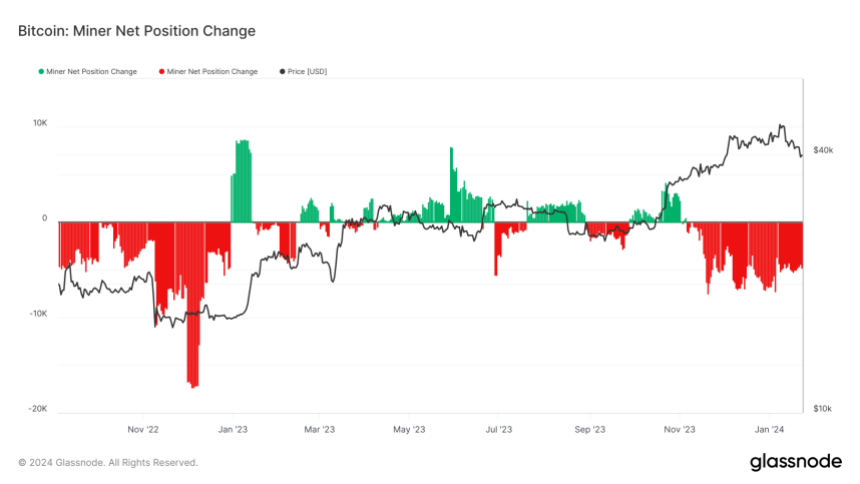
One major factor driving the decline is miners offloading their Bitcoin onto exchanges at a pace not seen since the FTX collapse in November 2022. The amount of BTC held by miners has plunged, indicating they are selling their newly minted coins instead of the typical strategy of accumulating them as a long-term investment. This surge of sell pressure from miners has overwhelmed buying demand, even as major ETF providers snap up Bitcoin to back their newly launched funds.

btc miners

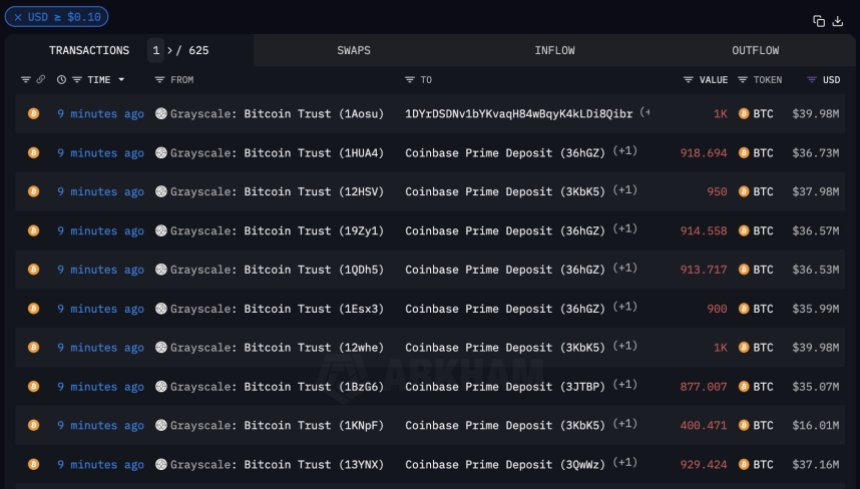
Grayscale outflows adding fuel to the fire

Grayscale Bitcoin Trust has been sending billions in BTC to Coinbase. Grayscale is one of the world’s largest holders of BTC, causing the substantial outflows to have a notable impact on price action. GBTC outflows are being driven by particularly high 1.5% expense fees compared to other spot ETF alternatives in the US. The situation was made worse when FTX’s estate redeemed nearly $1 billion in GBTC. When GTBC holders cash out their shares, a corresponding BTC sale is made.

grayscale

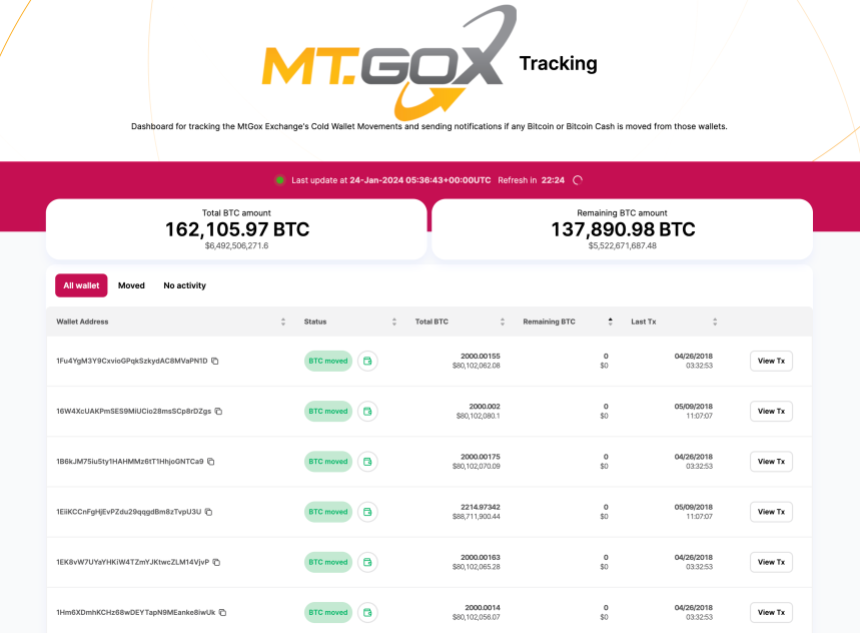
Looming Mt. Gox payouts spooking investors

Also contributing to the skittish sentiment is the long-running Mt. Gox repayment plan nearing its conclusion. The defunct exchange is preparing to distribute 137,000 BTC to holders as restitution for funds lost in its infamous 2014 hack. Many recipients are expected to cash out immediately and could flood the market with sell orders. This impending overhang has investors worrying about whether Bitcoin has enough demand to absorb the extra supply.

mt gox

Ongoing macroeconomic headwinds

Bitcoin’s ties to risky asset classes mean it has suffered collateral damage from the Federal Reserve’s relentless interest rate hikes and the strong US dollar squeezing alternative assets. Until inflation shows clear signs of slowing down, investors are unlikely to find refuge in Crypto. The Fed’s actions have dashed hopes that loosening monetary policy could stoke Bitcoin’s next bull run.

There may be light at the end of the tunnel

But there are reasons to be optimistic about Bitcoin’s future. For one, miner balances have fallen so dramatically that they are now lower than during last November’s FTX-induced meltdown. This signals that much of the excess selling pressure has already been expended.

glassnode-studio_bitcoin-balance-in-miner-wallets-btc-all-miners

As for the Mt. Gox payouts, creditors have held Bitcoin for nearly a decade and may opt to continue holding now that the Crypto winter seems to be thawing, rather than cash out at depressed prices below $40k.

ETFs now account for 0.5% of BTC supply

Most importantly, each newly approved ETF has greedily snapped up the Bitcoin sold into the market over the past weeks, evidenced by their substantial and rapidly growing holdings.

BlackRock’s spot Bitcoin ETF took in a staggering 44,000 BTC worth $1.75 billion within two weeks of launch. At Fidelity’s current pace, its ETF holds 30,000 BTC. With another over 30,000 BTC already under management across the remaining SEC-approved ETFs, these funds combined now hold over 100,000 BTC and counting.

Considering Bitcoin’s max supply is only 21 million, over 0.5% of all Bitcoin in existence is now locked up in just a handful of investment vehicles catering to institutional investors. And the appetite for Bitcoin exposure is only set to grow as more mega-asset managers file for spot ETFs to meet rising demand.

The looming Bitcoin halving could upend the status quo

With miners offloading coins ahead of the Bitcoin halving, and validation rewards about to be cut 50% from 6.25 Bitcoin per block to 3.125 Bitcoin per block this April, Bitcoin’s already decreasing issuance rate is set to drop drastically lower. This quadrennial event has historically choked the influx of new Bitcoins, as only half the number of coins enter circulation post-halving.

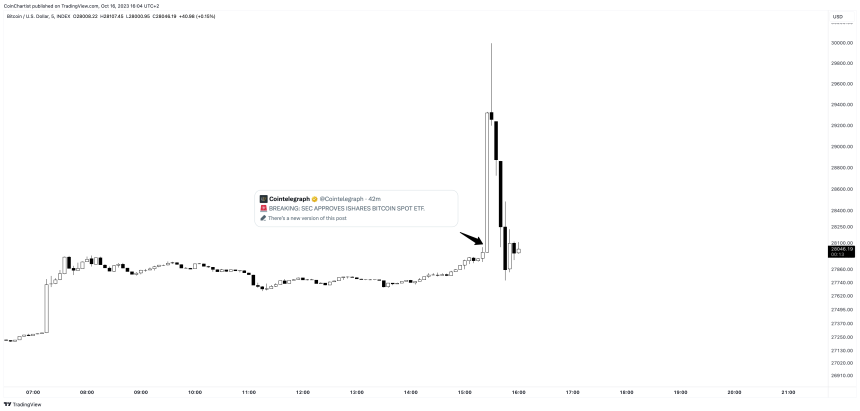
Yet despite the turmoil in Crypto markets presently, institutional intrigue in Bitcoin is continuing to scale up. Major asset managers have finally secured SEC approval for spot Bitcoin ETFs to meet surging demand from institutional investors seeking Crypto exposure.

Retail interest also remains resilient. The stage is being set for a serious supply-demand imbalance to play out over 2024. This, in turn, could act as rocket fuel to propel prices higher, as liquid coins become increasingly scarce relative to the swell of new institutional and retail entrants.

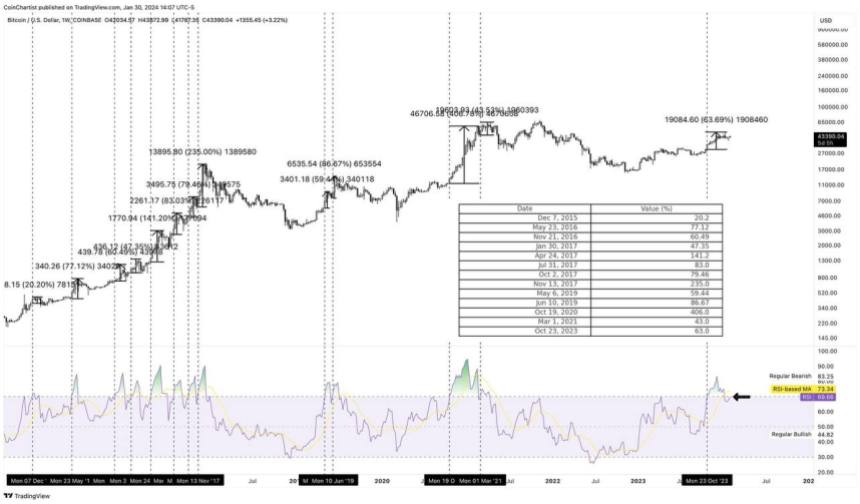
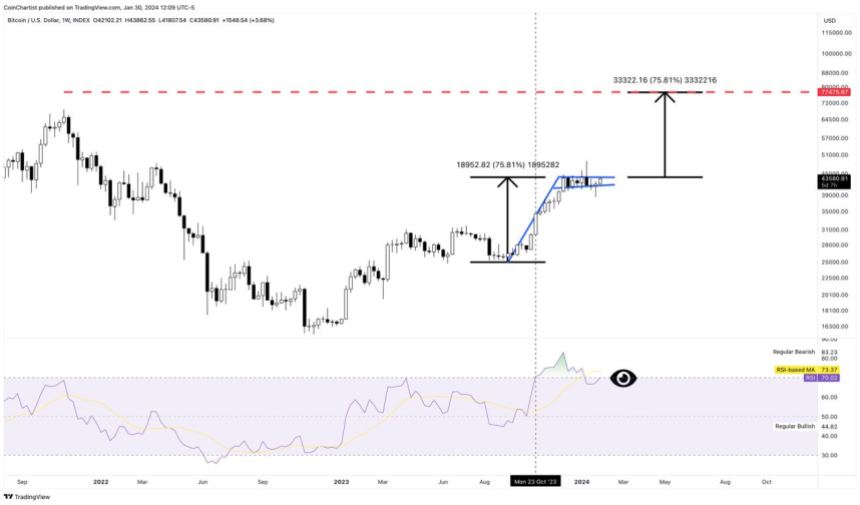
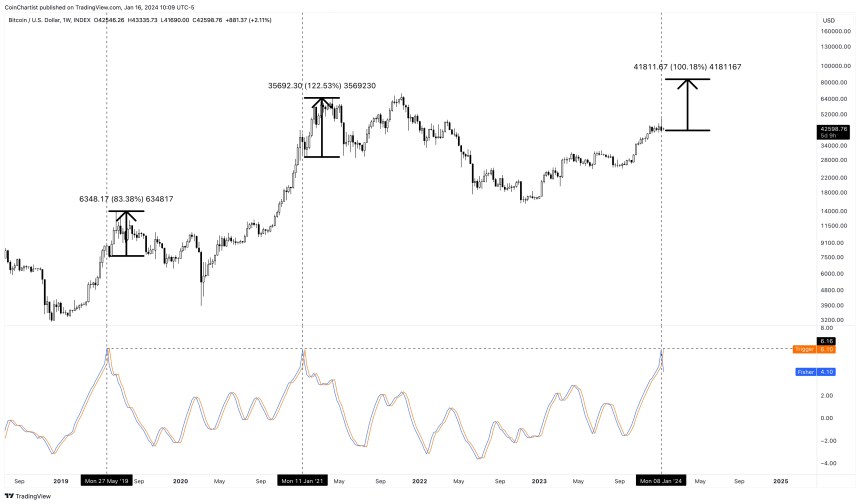
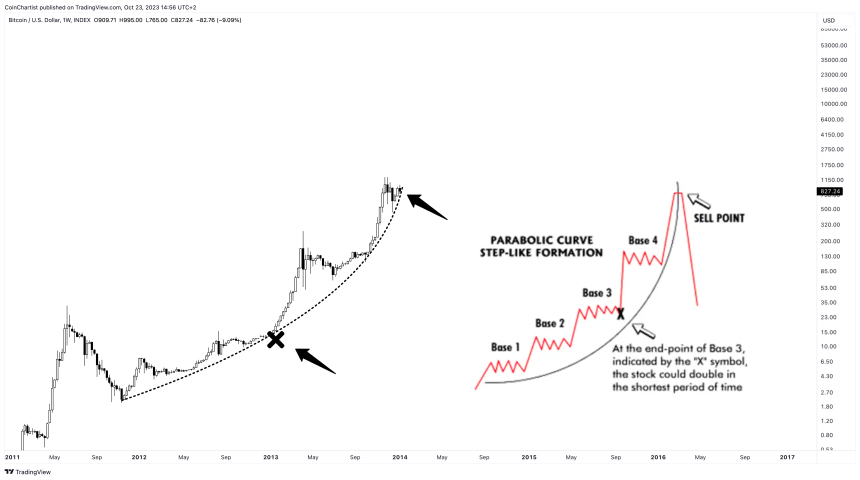
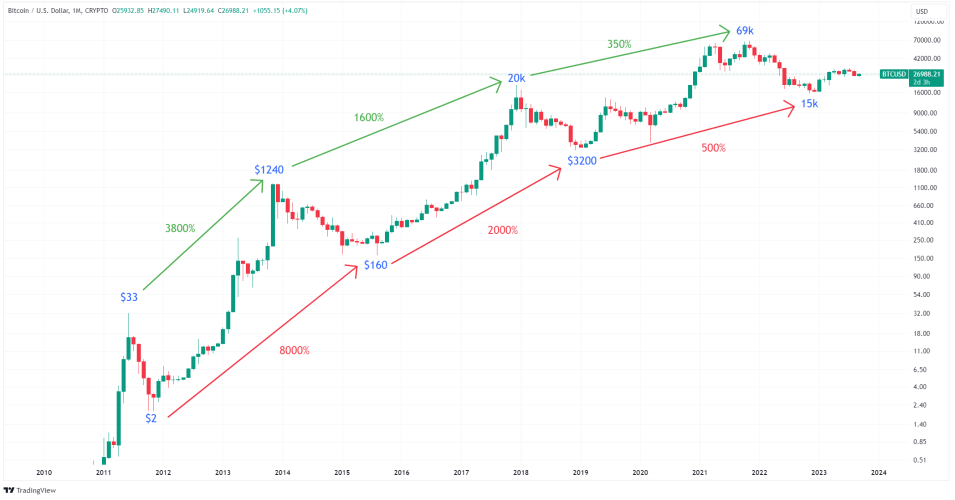
If history is any indicator, Bitcoin’s previous halving events triggered spectacular bull runs that saw prices appreciate multiples higher over the following 12-18 months. Investor euphoria reached a fever pitch as mainstream media coverage pulled in waves of new buyers happy to purchase Bitcoin at ever-loftier prices.

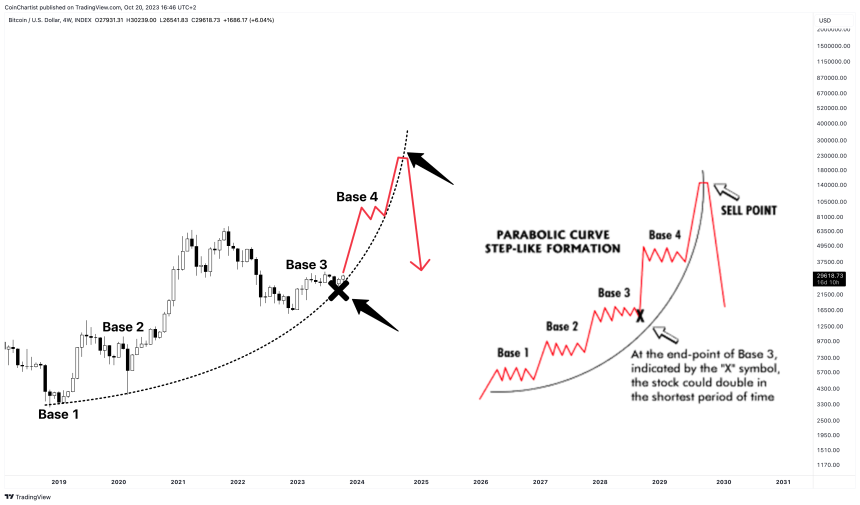
The run-up to April’s halving could see a similar pattern emerge. The type of supply shock that may unfold as Bitcoin’s issuance falls off a cliff this spring, while interest continues rising unabated, has the potential to ignite the asset’s next parabolic ascent to new all-time highs.

Turbulence creates opportunity for bold traders

Riding out this period of volatility will require nerves of steel, but for seasoned traders, the swirling uncertainty presents an opportunity. Platforms like PrimeXBT allow traders to benefit from Bitcoin’s wild price swings in either direction through instruments like Crypto Futures contracts and adjustable leverage. Advanced risk management tools are also at traders’ disposal to customise exposure based on personal risk tolerance.

As Bitcoin emerges from its post-halving cocoon over the mid-2020s, this period may be looked back upon as a final cleansing plunge before ascending to new heights on the back of hyper-scarcity and institutional adoption. Those bold enough to take calculated risks could reap outsized returns if faith in Bitcoin’s enduring value proposition holds firm.

Bearish Sell Signal Triggers As Bitcoin Falls Below $39,000

Bitcoin price is struggling to stay above $39,000 per coin and as it sinks lower, an ominous bearish technical signal is triggering.

Bitcoin Selloff Prompts Possible Change In Momentum

Selling pressure driven by FTX’s estate dumping nearly $1 billion in Grayscale GBTC shares caused Bitcoin price to lose the $39,000 level today, currently trading around $38,900 at the time of this writing.

The selloff hasn’t fallen deep enough for a convincing breakdown of the key psychological level, however, a bearish crossover of a momentum technical tool could trigger additional downward price action.

The recent drop has caused the weekly LMACD to cross bearish. A bearish crossover is a sell signal that warns of a change in medium-term momentum.

BTCUSD_2024-01-23_11-32-27

Will The LMACD Confirm The Bearish Crossover?

The bearish crossover on the weekly LMACD isn’t confirmed until the weekly candlestick closes. The LMACD is the logarithmic version of the MACD indicator – which stands for Moving Average Convergence Divergence.

When the tool’s lines converge and cross, it produces a signal to take action. However, if the crossover doesn’t confirm and the two lines diverge instead, it tells a trader to stay in a position. In this case, Bitcoin would stay in the buy position until a bearish crossover appears later down the line.

Such bearish crossovers have the potential to stop a bull rally in its tracks. The LMACD crossed bearish around the 2018 peak, the 2019 rally, and at both 2021 double tops. It is worth noting, however, that BTCUSD crossed bearish in 2023, and in late 2020, but ultimately crossed back bullish and resumed a bull run. Another such scenario is possible, so even if the technical indicator crosses bearish, it doesn’t necessarily mean the end of upside for Bitcoin.

Bitcoin Gives Early Top Warning Signal, But Price Could Double First

Bitcoin price reached highs of close to $50,000 a coin this year until an abrupt, 15% selloff stopped the climb and put the overheated crypto market on ice. The pullback has caused an early “top” warning signal to fire in BTCUSD, but data suggests that the top cryptocurrency could double before the actual top is in.

Fishing For A Top Signal With the Fisher Transform

Spot BTC ETF hype helped drive the price of Bitcoin from lows around $15,000 to over $45,000 per coin – a 300% increase. Peak post-ETF approval price action reached as high as $49,000 before a sharp rejection send BTC plummeting back to $42,000 where it trades currently.

The 15% correction after a significant climb isn’t too out of the ordinary, however, the 1W Fisher Transform indicator might have just given an early “top” signal. The tool, which smooths out price action to better visualize price extremes, reached a +6 standard deviation. This is among the most extreme readings the tool has even given on the timeframe.

More importantly, however, is how the technical indicator has behaved over the last several years. Specifically, the Fisher Transform on the weekly timeframe has accurately called the 2019 top, and the 2021 top several weeks in advance after reaching a +6 standard deviation.

Fisher Transform Bitcoin

Why This Warning Signal Could Mean A New ATH, 100% Rally

This signal was an early top warning, not the actual top, to be precise. In 2019, after the Fisher Transform crossed bearish, BTCUSD rallied another 83% before the actual peak occurred. In 2021, there was another 122% more ROI to go before the peak was in.

This could mean that although Bitcoin price could be looking at a peak soon enough, another 100% could be added to the cost per coin. At $42,000 per coin, that could take BTC above $84,000 and to new all-time highs.

It is worth noting that 2021 exceeded the ROI of 2019, which could hint at increasing returns as more participants become aware of Bitcoin. With institutions now getting involved, spot ETFs actively trading, and more, anything is possible.

This chart was originally featured in issue #32 of CoinChartist VIP: This Time It’s Different.

Parabolic Bitcoin Indicator Points To Continued Bull Run Despite 15% Crash

Recently, Bitcoin experienced a significant drop, crashing 15% from its 2024 highs around $49,000. This decline followed closely on the heels of the approval of 11 spot Bitcoin Exchange-Traded Funds (ETFs), a move that was initially met with optimism in the crypto community. The sudden downturn has left investors and traders analyzing the charts for clues about Bitcoin’s next move.

Is The Bullish Bitcoin Trend Over?

In the wake of this decline, technical analysis offers a beacon of insight. Notably, the correction was marked by a bearish engulfing candle on the daily chart, signaling a potential reversal in Bitcoin’s upward trend.

Accompanying this was a nasty wick – a long upper shadow on the candlestick chart, indicating a significant sell-off after prices peaked.

Further complicating the landscape was the opening of the CME BTC Futures with a sizeable gap down. Such gaps are often viewed as potential resistance levels, reinforcing the bearish sentiment.

BTC1!_2024-01-17_12-55-31

Stop And Reverse: A Ray Of Hope

However, amidst these seemingly negative signals, a ray of hope shines through from a “parabolic” technical indicator – the Parabolic SAR (Stop and Reverse).

Despite the tumultuous market conditions, the weekly BTCUSD Parabolic SAR indicator remains untagged, suggesting that the long-term uptrend is still intact.

This indicator, known for its effectiveness in identifying potential reversals in the market’s direction, paints a different picture from the immediate bearish signals and sentiment.

What Is The Parabolic SAR?

To fully grasp the significance of the Parabolic SAR in this context, it’s essential to understand what it is and how it functions. The Parabolic SAR is a popular technical analysis tool used primarily to determine the direction of an asset’s momentum and to provide entry and exit points.

The ‘SAR’ in Parabolic SAR stands for ‘Stop and Reverse.’ This indicator is represented on charts as a series of dots placed either above or below the price bars. A dot placed below the price is viewed as a bullish signal, while a dot above is bearish.

The unique aspect of the Parabolic SAR is its ability to act as a trailing stop loss. As the price of an asset moves, the Parabolic SAR adjusts, moving closer to the price line. This adjustment provides a dynamic method for traders to manage their positions, securing profits while limiting potential losses.

In the context of Bitcoin’s current situation, the Parabolic SAR’s position – still below the price bars on the weekly chart – suggests that the long-term bullish trend is not yet disrupted.

Bitcoin Enters Uncharted Territory with First Ever Golden Cross

As we step into 2024, Bitcoin opens the year with a remarkable price of $47,000, signaling a potential shift in the market dynamics. 

This new year brings with it a historic moment for Bitcoin – its first-ever ‘Golden Cross’ involving the 50-week and 200-week moving averages (MAs). This rare occurrence is not just a technical anomaly but potentially a harbinger of a significant market movement.

What Is A Golden Cross In Crypto?

To understand the implications of this event, we must first delve into what a Golden Cross is in the context of cryptocurrencies. In technical analysis, a Golden Cross occurs when a shorter-term moving average crosses above a longer-term moving average from below.

In Bitcoin’s case, the 50-week MA has risen above the 200-week MA for the first time in its history. This event is traditionally viewed as a bullish signal in various markets, including stocks and commodities, and is now making its mark in the crypto domain.

The Golden Cross is significant because it potentially reflects a shift in market sentiment from bearish to bullish over a substantial period. It’s not just a fleeting moment of upward price movement but instead points to a sustained trend that has been building over weeks and months.

This historic crossover indicates a strong, long-term upward trend, shaking off the shackles of previous bearish periods.

BTCUSD_2024-01-08_07-47-46

Will The Buy Signal Push Bitcoin Higher?

The emergence of this Golden Cross in Bitcoin’s chart is bound to catch the eyes of trend-following traders and investors. Trend-following trading systems are programmed to identify such signals and take positions accordingly.

These systems, often automated and based on algorithmic strategies, play a significant role in today’s trading landscape. They analyze historical data and current market trends to make predictions and execute trades.

With Bitcoin’s first Golden Cross, we are likely to see a surge in interest from these systems. The signal could trigger a wave of buying activity as trend-followers jump in, anticipating a continued upward movement. This influx of buying could, in turn, push Bitcoin’s price even higher, creating a self-fulfilling prophecy of sorts.

However, it’s crucial to approach this with a balanced perspective. While the Golden Cross is a strong bullish signal, it’s not infallible. Daily Golden Crossed have been known to uncross daily’s later, only to Death Cross in the weeks ahead. A Death Cross is the opposite signal, when a shorter-term MA crosses a longer-term MA from above. 

In conclusion, Bitcoin’s first-ever Golden Cross between its 50-week and 200-week MAs is a momentous event in its history. It’s a signal that could potentially lead to significant market movements, particularly if trend-following systems take action based on this development.

Crypto Market Reacts: Binance CEO Changpeng Zhao Steps Down

In a shocking turn of events, Binance CEO Changpeng Zhao has agreed to step down from the crypto exchange and has plead guilty to “violating US anti-money laundering requirements.”

The news is currently being priced into the crypto market, leading to extreme volatility in Bitcoin and altcoins, plus a lot of chatter on social media. Let’s take a closer look at how the market and speculators are reacting so far.

CZ To Step Down, Pleads Guilty, Company Charged $4B In Fines

Earlier today, the US Department of Justice revealed it would be announcing action against a cryptocurrency company. The most dominant cryptocurrency exchange, Binance, was the target of the enforcement action, and was ordered to pay $4.3 billion in fines.

Binance CEO Changpeng “CZ” Zhao stepped down as a result, and plead guilt to US anti-money laundering charges. The crypto market sank in the earlier hours today in anticipation of the news.

However, as soon as the Wall Street Journal revealed the information publicly, Bitcoin price bounced back and so did the altcoin market. Moments later, most of the upside price action was wiped out. Price as traded within roughly a 4% range today, but has traded across that several times since the news broke, highlighting powerful intraday volatility.

Binance BTCUSDT

The Crypto Market Reacts To The Binance News

While the market tries to price in what just occurred, volatility will continue to ensue in the near term. On X (formerly Twitter), notable figures are speaking out in regards to CZ’s departure from Binance.

On-chain analyst and market commentator Will Clemente points out it is “just a matter of weeks until Bitcoin ETF approval now” with Binance out of the way. The company has long been cited as a key reason for the SEC remaining hesitant to pull the trigger on a spot BTC ETF application approval.

Messari Crypto CEO Ryan Selkis calls it one of the “biggest catalysts we could have in crypto” between ETFs, crypto-friendly legislation, and this $4 billion settlement helping crypto be viewed as a “real industry.”

Economist Alex Kruger reveals that the settlement is ranked the 7th in financial compliance history, next to names like JP Morgan, Bank of America, Goldman Sachs, Wells Fargo, and several others.

Clear Skies: Why Bitcoin Overhead Resistance Is Weak

Bitcoin price is only at $37,500 — a far cry from former all-time highs around $68,000.

However, one visual technical analysis tool could show that overhead resistance is weak, and that the top cryptocurrency could rip right through what’s left. Could BTCUSD be back at all-time highs faster than most are ready for?

Bitcoin Price Breaks Above The Monthly Ichimoku Cloud

Technical analysts rely on a variety of tools to help provide signals to visually inspect and either manually or automatically take positions based on the results.

One such tool, created by a Japanese journalist Goichu Hosoda, is called the Ichimoku. Hosoda was nicknamed “Ichimoku Sanjin” which loosely translates to “what the man in the mountain sees.” The idea behind the Ichimoku is that it provides an “at a glance” view of all market conditions.

For example, the cloud plots where future support and resistance may lie. Meanwhile, the Tenkan-sen and Kijun-sen act as trend-following tools that cross bearish and bullish depending on price action. These spans can also act as support and resistance.

With all that out of the way, all it takes is “one glance” at the chart below and we can see there is very little 1M BTCUSD resistance left.

bitcoin btcusd

Clear Skies Above Major Resistance, But Minor Pullbacks A Plenty

Also at just a glance, it is possible to see how each time Bitcoin price passed through these spans and the Ichimoku cloud, an extended bull market formed.

It is important to note, however, that the Tenkan-sen (blue) and Kijun-sen (maroon) are still crossed bearish. But this also happened prior to each bull run.

Additionally, the lagging span has been omit from this chart. Called the Chikou span in Japanese, the lagging span shows where former support and resistance used to be, which means Bitcoin does have some less significant resistance levels to contend with at around $43,000 and again around $60,000.

Beyond $60,000, the Ichimoku shows nothing but air. Could this really mean clear skies for Bitcoin once the Ichimoku cloud is officially left behind?

This chart appeared initially in Issue #27 of CoinChartist VIP. Click here to read the rest of the issue.

Failed Bearish Signal Could Send Bitcoin To $85K Next Month

Bitcoin recently gave a bearish signal, which ultimately failed to produce a meaningful pullback.

Due to the technical failure, historical data suggests that in only a matter of a month BTCUSD could set a new all-time high and reach a target of $85K per coin. Here’s why.

Why Failed Bearish Technicals Produce Bullish Breakouts

In technical analysis, certain patterns are considered characteristically bearish or bullish. For example, the ascending triangle is a typically bullish-leaning pattern, but only breaks upward 63% of the time. The other 37%, the pattern breaks down bearish.

Because of the nature of how orders and stop losses are stacked on either side of a pattern’s trend lines, a failed bullish pattern can be extremely bearish and vice-versa. Dissecting further, since the pattern was visibly bullish, it could have attracted more long-side positioning that is forced to unwind lower.

Recently, Bitcoin price gave a bearish TD9 sell setup on the weekly TD Sequential. However, no major correction followed. When this occurs, it often results in a sizable move in the opposite direction of the signal.

More simply put, the failed TD9 sell setup could mean a massive move higher. And how high price could go and how fast might shock you.

Bitcoin failed bearish signal $85K

Market Timing Tool Hints At Bitcoin Rally To $85K

The TD Sequential is a market timing indicator developed by Thomas Demark. A TD9 setup or TD13 countdown is a specific sequence of candles that signal trend exhaustion.

Back in 2020 when this same signal failed, Bitcoin blasted off to new all-time highs above $20,000 and then some. It rallied 143% in the four weeks following the signal and over 300% more in total when it was all said and done.

If the same magnitude move followed this recently failed TD9 sell setup, Bitcoin price would reach $85,000 by the end of December. Another 300% beyond the current all-time high in BTCUSD would take the top cryptocurrency to over $200,000 per coin in total.

In terms of lower prices, the indicator also provides TDST support and resistance levels. These levels rise and fall with each completed TD setup. This latest setup caused TDST floor price support to raise from $10,000 to $25,000, reducing the chances that BTCUSD ever trades below that price again.

Bitcoin Bulls Are Back! Latest Signal Confirms Bullish Trend is Brewing

Those burned by the last big Bitcoin bull run are rightfully skeptical that another one is here so soon. However, a trend strength indicator is now confirming the existence of a new bullish trend emerging.

Are bulls finally back in control over crypto? Sidelined investors and traders will want to pay attention.

How Technicals Could Confirm A New Bullish Trend In Bitcoin

Bitcoin price is pulling back after a few failed attempts to make it though $38,000 resistance. This sudden weakness after a major breakout is both reassuring for bears and confusing for bulls. Those on the sidelines still aren’t certain what to do.

But that’s what technical indicators were designed for – to eliminate noise and emotions, allowing the tools to make the decisions for you.

According to a trend strength measuring tool called the Average Directional Index, the bullish Bitcoin trend just became official as the indicator reaches above a reading of 20. The last time that BTCUSD reached above 20 while bulls were in control was back in August 2020, prior to a 450%+ rally.

For comparison sake, another 450% rally would put the price per coin around $200,000. However, each individual trend behaves differently and tops out at different ADX reading. This means anything is possible, but for now, the rise above 20 on the ADX is notable.

bitcoin adx

How To Tell Bulls Are In Control Of Crypto With The ADX

The Average Directional Index, as mentioned, is a trend strength measuring tool. It was created by J. Welles Wilder, Jr., known as the father of several technical analysis indicators. Wilder also developed the Relative Strength Index, Average True Range, and Parabolic SAR.

The ADX confirms a trend is active above a reading of 20, while anything below 20 suggests a weak trend and potential sideways price action. The tool often includes two additional indicators, the DI+ and DI-, which show which side of the market is in control of price action.

If the DI+ is above the DI- bulls are in control. Bears are in control if DI- is above DI+. The premise is simple and provides an easy way to visually see which side of the market is dominating.

Not only are bulls in control, but the DI+ is at 36, while the highest reading back in August 2020 was 32. This means that bulls are stronger now than they were back then, and look what happened.

The above chart was originally featured in Issue #27 of CoinChartist VIP: The Ethereum Issue. Check out the latest issue for free.

This Chart Makes It Clear: Bitcoin Is Bullish

When Bitcoin price action is sideways and directionless for the better part of a year, bulls and bears argue over which direction will be ultimately chosen.

However, considering macro conditions like rising interest rates, a sinking stock market, and mounting ting debt, bears aren’t ready to throw in the towel. But they might want to after seeing this chart.

Bitcoin Price Chooses A Direction: Up And Away

Bitcoin and other cryptocurrencies are normally notoriously volatile. But volatility has dwindled to next to nothing since the FTX collapse struck.

Few have been willing to take the risk on BTC and altcoins while macro conditions are this on the edge of collapse. It resulted in a big move off the bottom, but also more than six months of consolidation and confusion.

But after several months of sideways price action, Bitcoin appears to have chosen a direction and broke out to form a new trend. Bears, however, remain stubbornly short per market sentiment.

Bearish traders might want to reconsider their positioning after taking a look at the Directional Movement Index.

bitcoin btcusd btc BTCUSD_2023-10-30_11-17-05

Bullish Directional Movement Is Anything But Average

The Directional Movement Index is typically found bundled with the Average Directional Index, and consists of a negative and a positive directional indicator. The tool’s premise is simple: when DI+ (green) is above DI- (red) the asset is bullish and DI- is above DI+ when bearish.

This technical analysis indicator is currently showing the DI+ soaring, while the DI- is falling and below the 20 line. The 20 line is notable more for the ADX, which isn’t pictured. When the ADX rises above 20, the tool suggests a trend is active and strengthening.

Bitcoin isn’t above 20 on the weekly yet, but has begun to do so on lower timeframes. With how strong the recent move was, the ADX could confirm above 20 over the next week or two. At that point, bears might finally be forced to concede that a new bull trend has blossomed.

November Outlook For Bitcoin Price: Another Pump Or Retrace?

November has often been a standout month for Bitcoin, with historical data indicating an impressive average price jump of 43%. This would propel Bitcoin to around $48,000. But with October already showing a significant price increase, the question arises: Will Bitcoin continue its bullish trend, or is a retrace on the horizon?

November Monthly Returns

November has been particularly bullish for Bitcoin over time, with an average of 43% of price increases over the years. If this trend holds true for this year, we might see Bitcoin touching $48,000.

Related Reading: Bitcoin Price To Reach $170,000 in 2025 – Mathematical Model Predicts

However, it’s worth noting that this very high average is significantly influenced by the extreme 453% surge in 2013. If we exclude this outlier, the average settles around 11.54% This leads to a more conservative forecast, pointing to a potential rise to around $38,000.

Diving deeper into historical data, 8 of the past 13 years have shown price increases in November, making another increase this month seem plausible. Yet, a closer look reveals that 4 of the last 5 times in November there was a price dip.

In 2022, the FTX collapse played a pivotal role and 2021 marked the peak for Bitcoin, suggesting that these decreases might be outliers rather than indicative of a changing trend.

For a closer comparison, 2019 stands out as it too was a pre-halving year, just like 2023. That year, after a promising October, Bitcoin saw a 17% dip in November, which would equate to a value of $28,000 if repeated this year.

Bitcoin Price Action In 2023

Through 2023, Bitcoin has demonstrated a recurring behavior following significant price increases of more than 20%. Typically, these surges have been followed by consolidation periods, and subsequently, a retrace to at least half of the initial increase.

Related Reading: Bitcoin Season: Leading The Charge In The Crypto Market

Take January, for instance. Bitcoin’s price increased from $16,500 to $24,000, only to decline to $20,000 by March – a retrace of 60% from the initial increase.

One particularly extreme example was in August when Bitcoin retraced the entirety of a prior 20% rise.

It’s noteworthy that these retraces haven’t always been immediate. After the rise in March, it wasn’t until June – a span of three months – that the price saw a 50% retrace. On average, this year’s price retraces have taken between 1 to 3 months to manifest post-rise.

Furthermore, before any retrace occurs, there’s still room for additional upside. To illustrate, after the aforementioned March rise, Bitcoin experienced an additional 10% increase before eventually retracing the initial surge.

Potential Scenarios For November
Using the above, potential scenarios for November are listed below:

  • Very bullish scenario: Bitcoin rises by 10-20%, potentially reaching up to $42,000.
  • Bullish scenario: Bitcoin rises by 1-10%, potentially reaching up to $38,000.
  • Bearish scenario: Bitcoin decreases by 10%, dropping to around $31,000. This would mean a 50% retrace of the surge in October.
  • Very bearish scenario: Bitcoin decreases by 20%, dropping to around $28,000. This would mean a 100% retrace of the surge in October.

In conclusion, given past trends and current market behavior, November promises to be a pivotal month for Bitcoin.

Predycto is the author of a cryptocurrency newsletter. Sign up for free. Follow @Predycto on Twitter.

Why Bitcoin Price Could Double To $60K In A Flash

Bitcoin price action has been known to go “parabolic” when speculation in the crypto market is in full gear. Prices begin to rise rapidly with very few pullbacks in between.

According to evidence, a parabolic structure is possibly building that could cause BTCUSD to “double” in a short amount of time. And with the first ever digital asset now above $30K per coin, it means a potential monstrous move to $60K could be on the horizon.

Why BTC Could Teleport To $60K

In technical analysis, an asset is said to have gone “parabolic” when an increasingly steep upward curve supports a series of higher highs and higher lows.

Parabola typically forms in a sideways, horizontal range. After each higher low, price accelerates further, causing the angle of the slope to nearly go vertical.

Bitcoin has done this several times throughout its short history. And after the longest bear market on record, the cryptocurrency could be ready for another parabolic rally.

BTCUSD_2023-10-20_10-47-24

Bases Loaded, Bitcoin Number Up

A comparison with the iconic parabolic curve example, possibly puts Bitcoin price at what would be the third touch and third base of a four-base pattern. A rounded parabolic curve is supporting a series of high timeframe higher lows.

Base three is significant because it is said to produce a move where the asset “doubles in the shortest period of time.” With Bitcoin near $30K, $60K could be right around the corner if this is an accurate patter.

Above base three is base four, meaning there is yet another zone of consolidation somewhere above that will touch down on the curved parabolic trend line a final time. From there, the next time it touches the curved line will be after a peak of the parabolic rally.

BTCUSD_2023-10-23_08-56-18

Will Crypto Parabola Begin Again?

Don’t believe this structure is possible in Bitcoin? Simply take a look at past cycles for an example. In the above chart, Bitcoin formed several bases in a row. After touching the X, price didn’t just “double,” it did 1,700% ROI. Even then, BTCUSD wasn’t done climbing, rallying another 700% from base four.

These figures aren’t probable again, but it speaks to the fact that something big very well could be coming soon.

Bitcoin Price Surges 7% In 10 Minutes On Fake iShares ETF News

Bitcoin price just made one of its most volatile moves in some time on the back of what has amounted to be fake news regarding the approval of the BlackRock iShares spot BTC ETF.

Within seconds of a fake X post, BTCUSD surged by over 7% in ten minutes – only to retrace the entire rally and then some.

Bitcoin Price Rejected As iShares ETF News Revealed To Be False

No, BlackRock’s iShares spot Bitcoin ETF has not been approved. But that’s what was just making waves around social media, especially Elon Musk’s X platform.

Within the ten minutes following the phony report from CoinTelegraph, BTCUSD soared by more than 7%  and almost $2,000. The top cryptocurrency by market cap, however, was stopped at $30,000 and rejected all the way back down to below $28,000 in the following fifteen minutes once the news was disproven.

Fox Business journalist Eleanor Terrett claims to have spoken to a representative for BlackRock directly, who confirmed that the iShares application is still under review with the United States SEC. CoinTelegraph has since deleted the tweet (pictured below).

BTCUSD_2023-10-16_10-04-47

The situation shows that the market has serious pent up energy that is ready to release the moment a spot ETF is approved. But it also could demonstrate to the SEC exactly why a spot ETF shouldn’t be approved when crypto prices are subject to such blatant manipulation through the media.

While a spot ETF is inevitable at this point, today’s news has now repeatedly been confirmed to be false.

Bitcoin Doom Signal Warns Of 50% Crypto Collapse

Bitcoin price lost support yesterday at around $27,000 and is now below a critical level that the last two times it was lost, resulted in a 50% or more decline. 

Will this signal returning once again forecast sudden doom and cause crypto prices to rain down another 50% lower?

Bitcoin Forecast Is Suddenly Cloudy

The last several weeks of resilience in Bitcoin price action have been seemingly erased this week, as price fell below support at $27,000. 

While the rounded psychological number is important by itself, BTCUSD has now pushed below the bottom of the Ichimoku cloud on the weekly timeframe. 

According to historical performance after falling out of the cloud, the top cryptocurrency by market cap continued to tumbled significantly lower to the tune of 50%. 

BTCUSD_2023-10-12_08-14-43

Will Crypto Crash Another 50%?

The Ichimoku cloud acts as dynamic support and resistance, and expands and contracts with volatility. Losing this support level in the past has had dangerous consequences. 

In March of 2020, falling out of the cloud on the same weekly timeframe resulted in a 50% flash crash over the next two weeks during the onset of COVID in the US. 

Later in May 2022, the LUNA collapse caused Bitcoin to lose the weekly Ichimoku cloud. It took over 20 weeks later to reach a bottom and a full 55% lower. 

BTCUSD_2023-10-11_08-27-40

$12,000 Or $42,000: BTCUSD Levels To Watch

Another 55% crash in BTCUSD would take the price per coin to around $12,000. More importantly, it would be disastrous for altcoins that remain down by 90% or more from all-time highs. 

The major difference between now and the last two times the cloud was lost, and that’s the Tenkan-sen and Kijun-sen in blue and maroon respectively (pictured below). Unlike the two past instances, these spans are crossed bullish whereas previously they were during a bearish crossover. 

If for some reason Bitcoin manages to hold inside the bottom of the cloud, it could next target the top of the cloud at around $42,000 per coin. If it doesn’t, “look out below.”

Charts initially appeared in Issue #23 of CoinChartist VIP. Subscribe for free to learn more about the Ichimoku cloud and what might happen next in Bitcoin.

BTCUSD_2023-10-11_08-36-29

Bitcoin Price Action in October: A Probabilistic Overview

October has traditionally been a pivotal moment for Bitcoin’s price action. Historical data shows an enticing average price increase of 17% for the month (excluding the early, volatile years of Bitcoin). In pre-halving years, this average price fluctuation is slightly higher, around 21%.

If the same price change occurs in 2023, Bitcoin could reach somewhere between $32,000 and $33,000 in October. But will this month follow the historical trend, or is a bearish turn still possible?

October Over Time

October has been particularly bullish for Bitcoin, with an average of 17% of price increases over the years. Since 2023 is a pre-halving year, comparisons with other pre-halving years are particularly insightful.  In the pre-halving years of 2019 and 2015, the average price increase was 20%.

In 13 years of Bitcoin price action, 9 have seen increases during October. This makes another bullish October seem quite likely.

Interestingly, September, known for its bearish tendencies, has broken its pattern this year, with Bitcoin’s price seeing a 5% increase. This is the first instance of such a deviation in over 7 years. This anomaly prompts the question: could October’s price action also diverge from the historical pattern?

Bitcoin Price Action In Pre-halving Years

Another important caveat to consider is that during pre-halving years, Bitcoin’s price tends to exhibit a predictable pattern where there are 5-6 months when the price decreases. However, 2023 has been an outlier so far, with only three red months observed currently:

This unexpected deviation could prompt a re-evaluation of what the remaining months of 2023 may hold for Bitcoin. To see the usual six months of price decreases, every month remaining in the calendar year would need to show a reduction.

Bitcoin In 2019:

Examining Bitcoin’s price movements in Q4 of 2019 can offer a comparative perspective.


Q4 2019 showed significant retracements in Bitcoin’s price, as it decreased by 20% from the beginning of October until the end of the year. If we witness similar price movements this year, it will lead to Bitcoin reaching below $22,000, presenting potential opportunities and risks for investors.

A Broader Impact

Bitcoin’s price movements serve as an indicator of the broader cryptocurrency market. A bearish trend in Bitcoin could potentially lead to a market-wide downturn, causing an even bigger downturn for Altcoins and coins with low market capitalization.

Conclusion

While October is usually bullish, the anomalies witnessed in 2023 should lead to a more cautious approach to expectations during October. The absence of a bearish September provokes questions about the likelihood of experiencing a bullish October. While history provides guidance, it’s essential to remember it doesn’t dictate the future, and varying factors can alter market behaviors significantly.

Predycto is the author of a cryptocurrency newsletter. Sign up for free. Follow @Predycto on Twitter.

Bitcoin Price To Reach $170,000 in 2025 – Mathematical Model Predicts

The Bitcoin price is trading at $27,100 at the time of writing, marking a 60% decline from its all-time high of $69,000 in 2021. As the anticipation for the next bull market builds, questions arise regarding Bitcoin’s potential future prices.

While most predictions are speculative, one analyst has devised a model leveraging historical data to forecast potential tops and bottoms in Bitcoin’s price over time.

Bitcoin Price In Previous Cycles

Since its inception, Bitcoin has demonstrated remarkable growth, rewarding early long-term investors substantially. This price growth is observable in measuring Bitcoin’s prices from the lows to the highs and between the highs of successive bull markets.

In 2011, the peak was $33, followed by a peak of $1240 in 2013, reflecting a 3800% increase between peaks. The subsequent peaks in 2017 and 2021 were $20,000 and $69,000, representing increases of 1,600% and 350%, respectively. Comparable levels of increase are also observed when examining the lows of different cycles.

Notably, the relative growth between cycles has diminished, possibly due to the increase in Bitcoin’s market capitalization, requiring more substantial capital to influence its price. This diminishing growth aligns with a mathematical pattern known as logarithmic regression.

Logarithmic Regression

An analyst has devised various logarithmic curves on the Bitcoin chart to forecast Bitcoin’s potential tops and bottoms, utilizing time as the only input. Such models can help investors by offering a straightforward way to see potential market trends and make proactive plans in the unpredictable world of cryptocurrency.

Bitcoin’s tops and bottoms typically manifest every four years, enabling the prediction of potential Bitcoin prices in upcoming cycles based on the logarithmic regression model.

Bitcoin Price Projections

  • 2025-2026: Bitcoin price may peak in the third or fourth quarter of 2025 between $190,000-$200,000, before bottoming out around $70,000 the following year.
  • 2029-2030: Bitcoin price may reach a top of $420,000 to $440,000 and bottom out the following year at around $230,000.
  • 2033-2034: Bitcoin price may peak between $750,000-$800,000 and bottom out around $700,000 the following year.

By the late 2030s, the model begins to break down as predicted tops start falling below the predicted bottoms, potentially indicating a stabilization in Bitcoin’s price post its peak of $750,000-$800,000

Final thoughts

While models like this offer insightful projections of Bitcoin’s potential future prices, it’s important to acknowledge their limitations and the need for periodic updates with fresh data points. Numerous external factors, including but not limited to regulatory changes, technological advancements, and macroeconomic conditions, could significantly impact the model’s accuracy.

Moreover, the unprecedented nature of Bitcoin’s trajectory, having never endured a recessionary environment, implies a potential susceptibility to more substantial crashes than models might predict. Predictions should be cautiously considered with broader market analyses and trends as with any financial model.

Predycto is the author of a cryptocurrency newsletter. Sign up for free. Follow @Predycto on Twitter.

Bitcoin Bulls Could Buck Downtrend With Move To $42,000

Bitcoin price is back above $27,000 per coin after holding firm at $25,000 for a second time.

If price fails to move below support and makes another run for resistance, bulls might finally buck the downtrend with a powerful, measured move to $42,000.

Recapping 2023 Using Classical Technical Analysis Methods

2023 thus far has been the year that Bitcoin went mostly sideways. The year began with a strong surge from bear market lows, but failed to instill enough confidence for instant continuation. Even an inverse head and shoulders pattern has yet to produce the expected upside target.

Instead, BTCUSD has spent months and months going sideways, unable to break above $31,000 or below $25,000 per coin. With the top cryptocurrency finding support at $25,000 a second time, bulls might finally be emboldened.

Using classical charting methods such as a the inverse head and shoulders neckline support and a simple downtrend line, we can begin to understand the technical explanation for the pause around this zone.

bitcoin target

The Tale Of Two Retest And The $42,000 Target

It is common of an inverse head and shoulders pattern for price to throw back to former neckline resistance and retest it as support. This allows buyers to get in at lower levels, while those who bought earlier take profit.

After a retest, Bitcoin made a substantial move up breaking through a downtrend line drawn from all-time highs. However, the confidence was still not enough for proper follow through, so Bitcoin fell back to $25,000 to test the downtrend line it broke out from.

With the level tested now twice and proving to be seemingly unbreakable, bulls might finally have the confidence to meet the target of the inverse head and shoulders pattern. This target is located at $42,000 per BTC.

This chart originally appeared in Issue #21 of CoinChartist (VIP), where several other Bitcoin price charts demonstrate confluence with the target. Subscribe for free to view the rest of the Bitcoin charts.