XRP And XLM Blast: Analyst’s 20X Rally Projection To ‘Melt Faces’

In the ever-evolving world of cryptocurrency investments, technical analysis continues to play a significant role in shaping investor sentiment and market trends. Amidst the volatile landscape, one analyst, known as Charting Guy, has garnered attention for his bold predictions regarding the future of two prominent digital assets: XRP and Stellar (XLM).

Will XRP Rally “Melt” Faces?

Charting Guy’s recent tweet has made waves, declaring that investors in XRP and XLM will soon witness “melting faces” as he identifies a potential $13 movement. This provocative statement underscores his confidence in the impending bullish surge he foresees for these cryptocurrencies.

His analysis suggests a bullish trajectory for both XRP and XLM, despite prevailing market skepticism and prolonged periods of consolidation. While some market participants have labeled these assets as “dead coins” due to their lackluster performance in recent years, Charting Guy remains undeterred by sentiment-driven narratives, instead focusing on technical indicators and chart patterns.

Potential Breakout In The Offing?

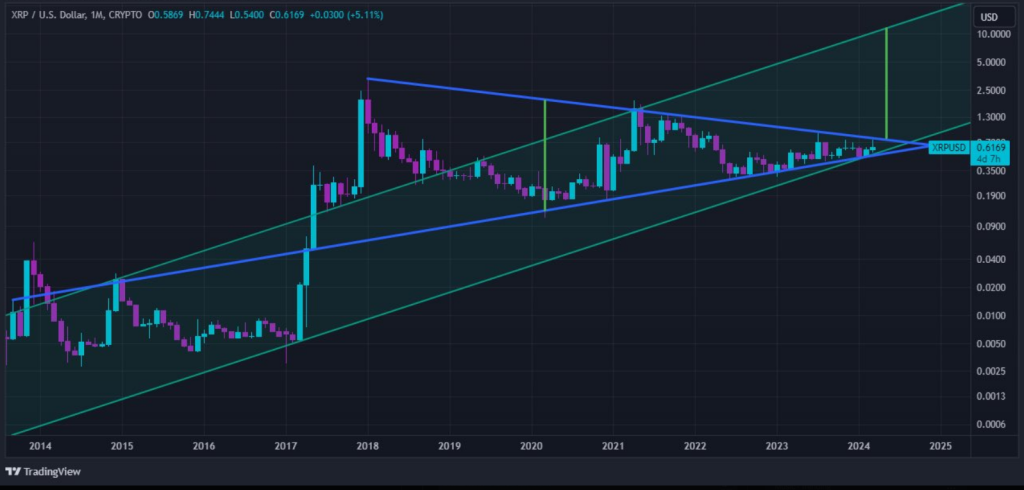
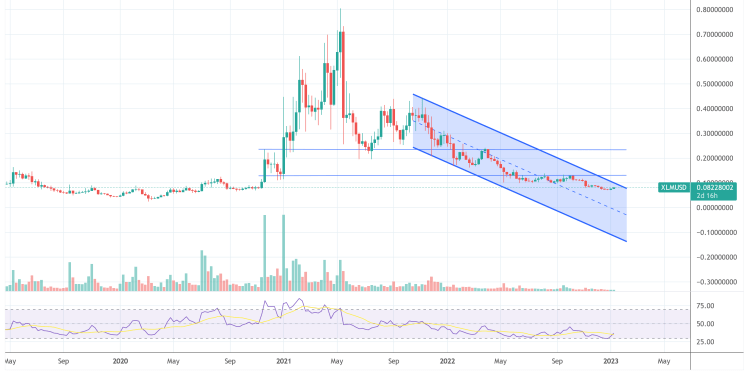
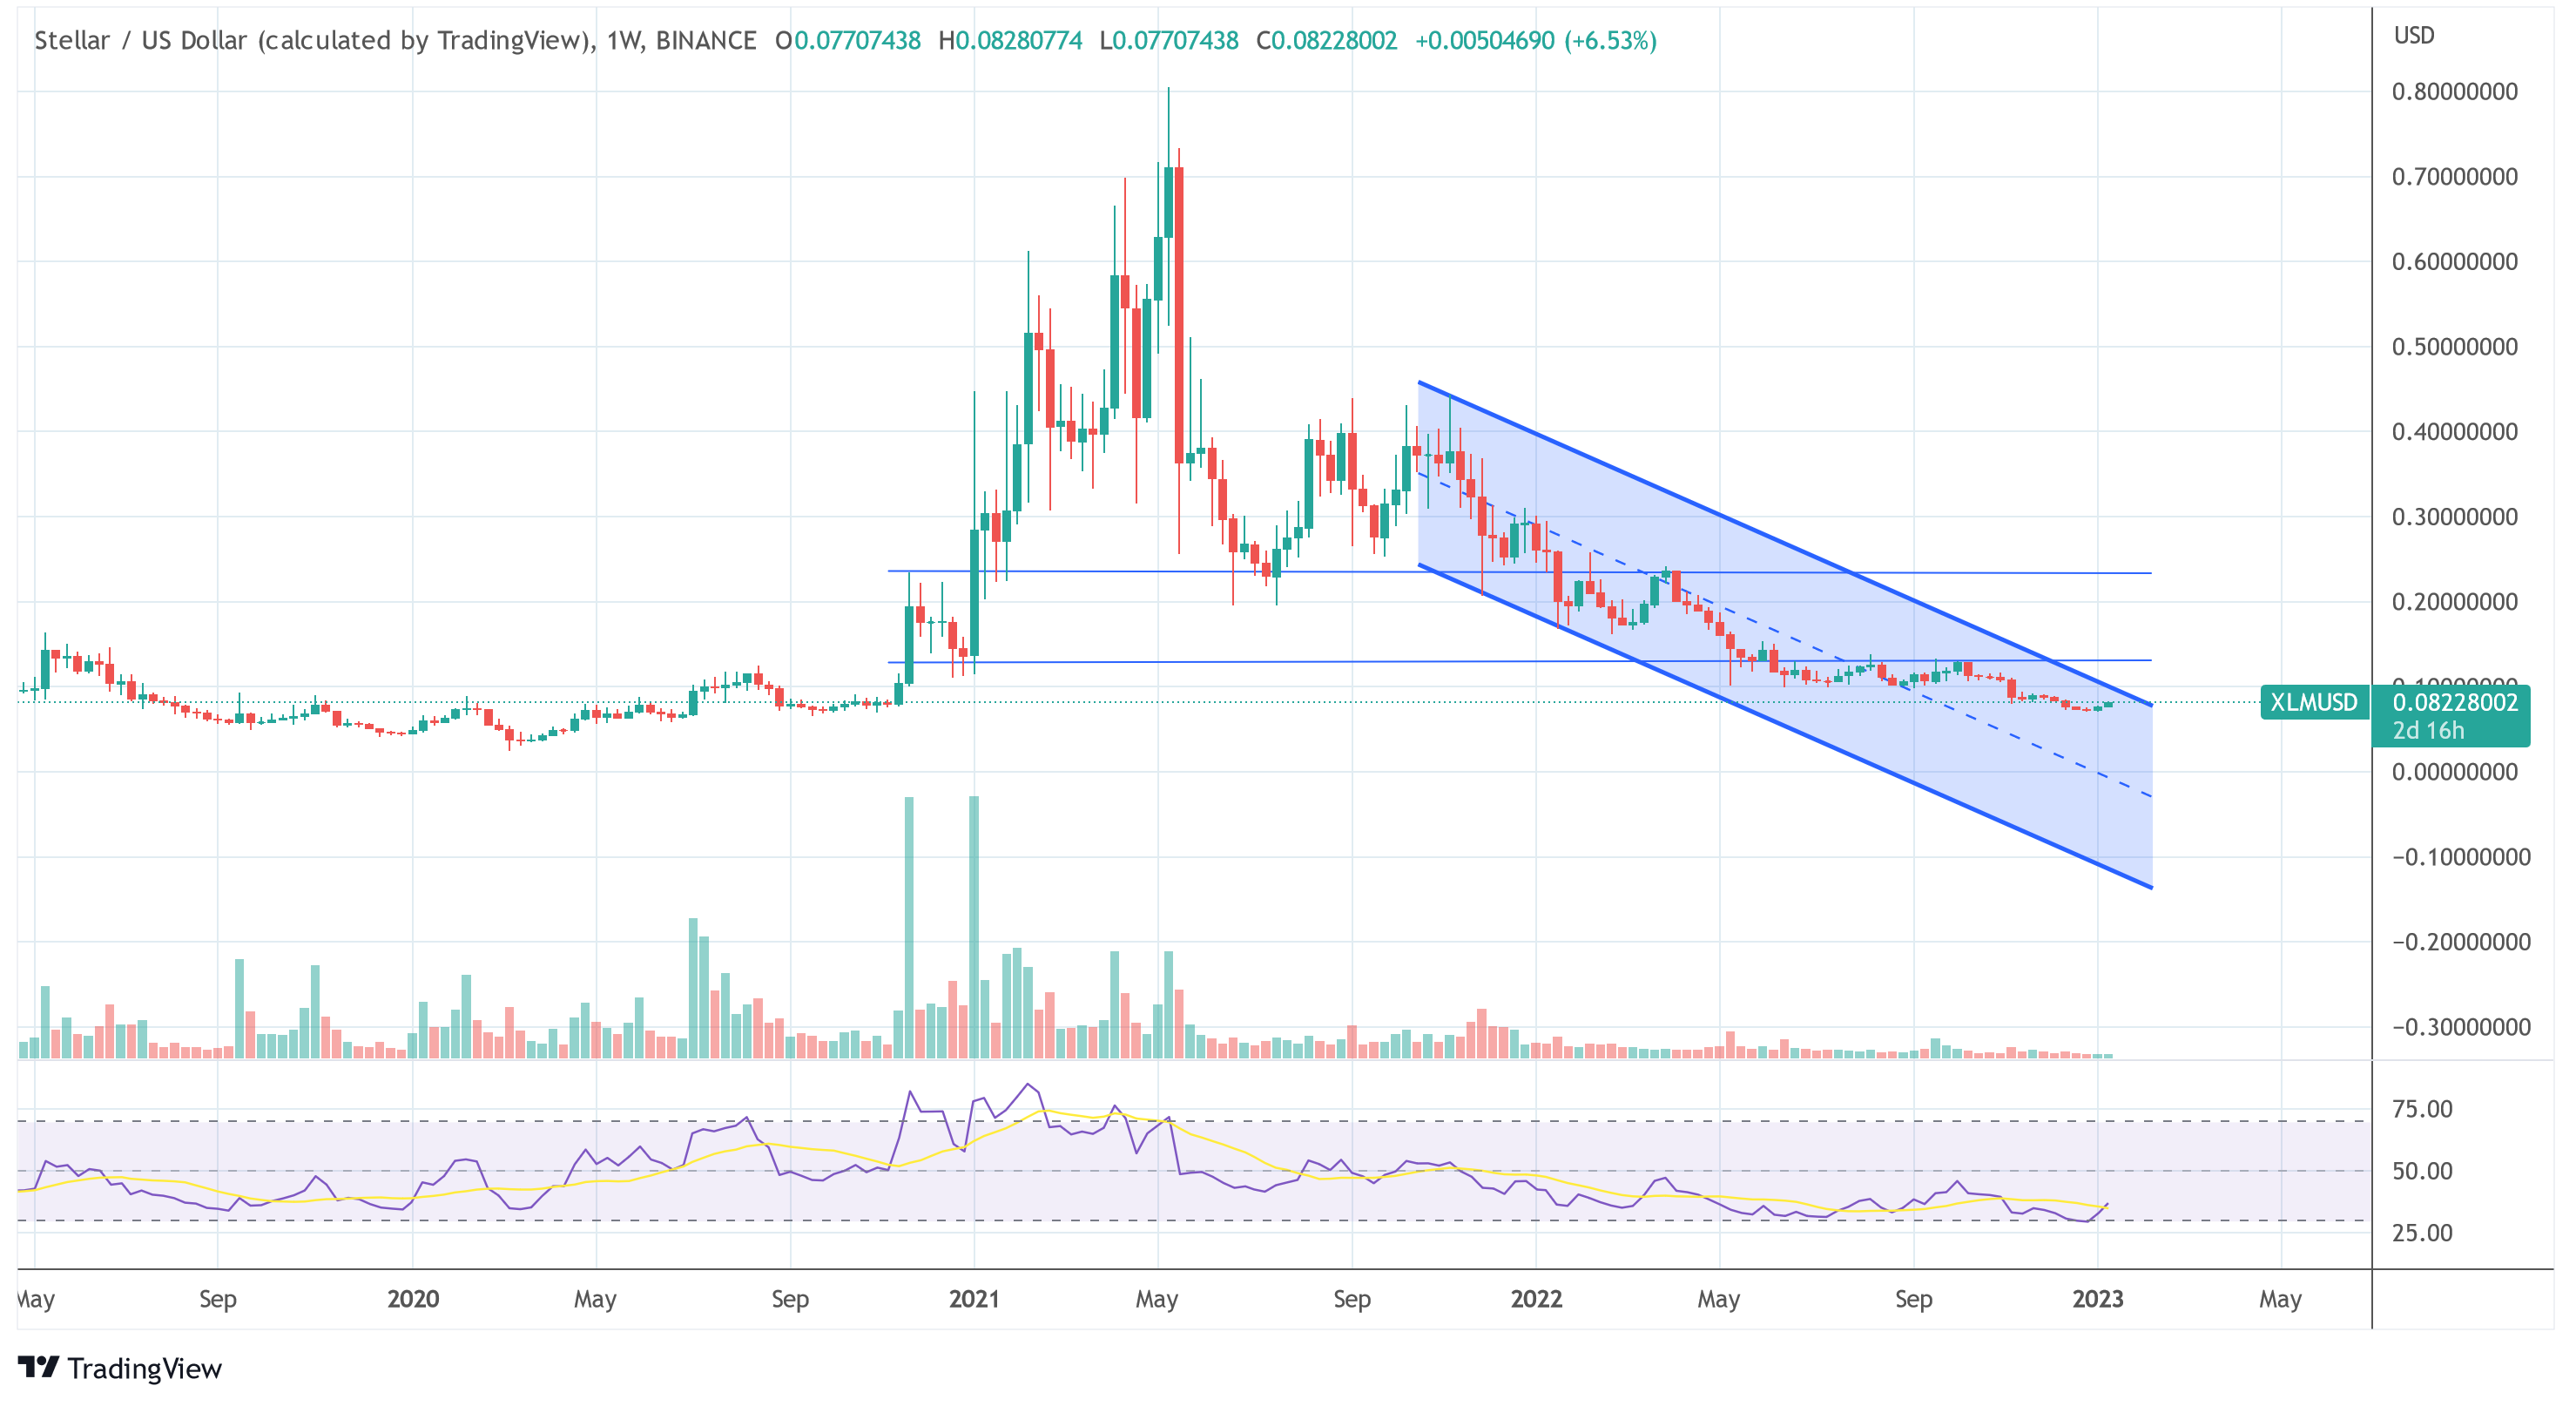
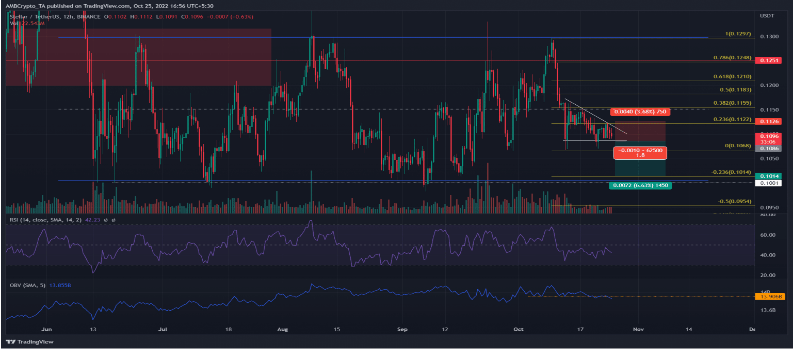
According to the analyst’s examination, XRP and XLM have exhibited symmetrical triangle patterns, signaling potential breakout opportunities. These patterns, which have been forming over the course of six years, are among the largest formations Charting Guy has encountered, indicating significant potential for price movement.

His projections indicate a breakout target for XRP within the range of $10 to $13, implying a substantial gain of up to 2,000%. Similarly, Charting Guy believes that XLM could follow a similar trajectory, reaching a target of $13.

Optimistic Long-Term Prospects For XRP And XLM

While these short-term targets are ambitious, Charting Guy’s outlook extends beyond the current market cycle. He suggests the possibility of XRP reaching $38 in the future, although he acknowledges that this may not materialize within the next few years.

Related Reading: Shiba Inu (SHIB) Slumps As Whale Sell-Off Dampens Momentum – Details

Nonetheless, he remains optimistic about the long-term prospects of both XRP and XLM, foreseeing a three-digit value for both assets within the next decade.

His bullish outlook is not solely based on technical analysis but also takes into account the potential role of XRP and XLM in the emerging financial landscape. With the increasing adoption of central bank digital currencies (CBDCs) and the potential for disruption in traditional financial systems, Charting Guy believes that XRP and XLM are well-positioned to play a significant role in the future of finance.

Featured image from Andrea Piacquadio/Pexels, chart from TradingView

XRP And XLM Price Correlation Persists, Ripple CTO Explains Why

XRP and Stellar (XLM) are two cryptocurrencies that have been constantly compared in terms of price growth and development. Both digital assets are dedicated to facilitating cross-border transactions

Given their considerable similarities, the Chief Technology Officer (CTO) of Ripple, David Schwartz has attempted to uncover the factors contributing to the persistent price correlations between the cryptocurrencies. 

Ripple CTO Explores XRP And XLM Price Trends

Schwartz has recently taken to X (formerly Twitter) to share a chart illustrating a strong correlation in the price movements and patterns between XRP and XLM tokens. In response to an X user who expressed curiosity regarding the similar price trends between the two cryptocurrencies, Schwartz explained the distinct reasons behind XRP and XLM’s unique price movements. 

The Ripple CTO acknowledged that he lacked an accurate explanation for the price correlations between XRP and XLM. However, he provided two major factors that could be influencing the price trends. 

Schwartz revealed that comparable market forces that regulate various cryptocurrencies also control XRP and XLM. He further stated that most investors and crypto enthusiasts often place XRP and XLM within the same category due to the cryptocurrencies’ historical connection.

 As a result, a significant number of people simultaneously engage in buying and selling XRP and XLM causing the cryptocurrencies to have similar price movements. 

Concluding his analysis, Schwartz stated that he believed there were no market manipulations or external “evil forces” making these cryptocurrencies display similar price trends. 

XRP price chart from Tradingview.com (XLM Ripple CTO)

Latest Developments For Both Assets

XRP and XLM are one of the major cryptocurrencies that have gained significant attention, often seen as the leading contenders for cross-border payments and mainstream adoption. 

While these two cryptocurrencies tend to display similar price tracks, they have been experiencing vastly different developments in their respective markets and ecosystems. 

XRP recently gained regulatory clarity after successfully gaining a victory in its ongoing legal battle with the United States Securities and Exchange Commission (SEC). Despite speculations suggesting that XLM might be the SEC’s next target due to its striking similarities with XRP, the cryptocurrency has not encountered similar legal issues in the US as Ripple. 

Following XRP’s partial legal success, the price of XRP surged considerably. While XLM followed behind increasing by almost 90% but retraced some of the accumulated gains later. 

In terms of expansion, XRP has achieved multiple milestones and has gained approvals in several regions including Dubai. The cryptocurrency is positioned to gain from Ripple’s potential integration into trillion-dollar markets and industries.

On the other hand, Stellar (XLM) is improving its ecosystem by integrating a new testnet upgrade, Protocol 20. The cryptocurrency is also actively seeking new partnerships with banks to expand its reach and utility.

XRP And XLM In Lockstep? Expert Sheds Light On Their Surprising Price Synchronization

Recently, a notable observation has been the significant correlation between XRP and XLM’s price action. This phenomenon has caught the attention of industry experts and investors alike, leading to a deeper examination of the factors driving this trend.

Ripple’s Chief Technology Officer (CTO), David Schwartz, has weighed in on this topic, addressing the liquidity aspects of XRP and XLM. However, despite the visible correlation, Schwartz argues that more liquidity is needed in the XRP/XLM market to cause a notable price correlation.

This statement is based on data from CoinmarketCap, which illustrates the parallel price movements of these two cryptocurrencies over the past year. Schwartz’s insights provoke a deeper analysis of the potential reasons behind the alignment in their price behaviors.

Unraveling The Factors Behind XRP And XLM’s Correlated Price Movements

David Schwartz has identified three key factors influencing the XRP-XLM price correlation. Firstly, he posits that the entire digital asset market is significantly interconnected.

The market is still determining cryptocurrencies’ long-term viability, so industry news tends to affect all tokens, not just specific ones. This broader market sentiment could drive the correlation observed in XRP and XLM.

Secondly, Schwartz suggests that the dominance of Bitcoin in the cryptocurrency market could play a role. Given Bitcoin’s substantial market share and its influence on liquidity within the crypto space, movements in Bitcoin’s price often result in ripple effects across other crypto, including XRP and XLM.

The third factor revolves around the crypto community’s perception that XRP and XLM require similar market conditions to thrive. However, Schwartz noted that he is “not sure if he believes this.”

Developments within the broader crypto industry could prompt parallel reactions from users of both tokens, leading to correlated price patterns.

Diverse Perspectives: From Short-Term Volatility To Long-Term Convictions

On the other hand, Bill Morgan, a lawyer and digital asset enthusiast, brings a different viewpoint, mainly focusing on XRPL token. Addressing recent market volatility, Morgan emphasizes the importance of a long-term perspective when analyzing XRP’s price action.

Responding to crypto community concerns about XRP’s performance, especially during heightened market movements, Morgan argues that convictions about the token should go “beyond short-term price fluctuations.”

Morgan’s stance is echoed by Matt, the Moon Lambo YouTube channel host, who points out that XRP’s price drop was not as severe as some in the crypto community perceived. Matt’s analysis places XRP at a moderate position among the top 50 coins by market cap in terms of gains and losses.

However, Morgan notes that the token’s performance over the past month has been lackluster, falling by over 2% despite a market-wide rally. This observation suggests that XRP’s decline was more pronounced than that of some of its peers, warranting a closer examination of its market dynamics.

XRP price chart on TradingView

Featured image from Unsplash, Chart from TradingView

Stunning Correlation Emerges Between XRP And XLM, What’s Going On?

On Monday, news quickly spread after a BlackRock XRP ETF filing popped up on the Delaware Corp. Commission website. The filing has since been claimed to be false. But the damage was already done as the token’s price surged quickly before reversing.

One interesting development from this event though was a curious correlation that emerged between the XRP price and the XLM price at the time. While the news was localized to XRP, XLM had surged just as much, emerging with a stunning correlation between the two.

XRP And XLM Correlation Balloons

In the wake of the rumored BlackRock XRP ETF filing pumping the token’s price, one enthusiast has noticed a significant correlation between XRP and XLM. Crypto analyst and educator Blockchain Backer took to X (formerly Twitter) to reveal what he terms as one of the “most bizarre” moves.

The chart clearly shows the XLM price surging just as the BlackRock news broke with a straight green candle. Likewise, when the news was debunked and the XRP price began to fall, so did the XLM price, in an eerily similar fashion.

In another post, Blockchain Backer revealed that XLM had followed XRP’s move in the 2-second timeframe. A chart shared with this post showed XRP’s movement and XLM’s movement on the same chart and the moves happened at almost the same time, as shown below:

XRP XLM BlackRock

“The fake news was literally XRP specific, and would impact XRP only, not XLM. If anything, you’d expect XLM sell off like the rest of the market. Instead, it mirrors. Why?” the analyst wondered.

XLM price chart from Tradingview.com (XRP)

Running A Similar Race

XRP and XLM have always seemed to run in the same circles and the correlation in their price movements has been a testament to that. One X user, in response to Blockchain Backer’s post, reasoned that the correlation was because both digital assets actually “share the same holders.”

One crypto analyst who has also closely tied the performance of XLM to that of XRP is Crypto Bilbuwoo. One of their long-running analysis includes both digital assets which the analyst expects to move toward new all-time highs in the same fashion.

In an October 15 post, Crypto Bilbuwoo posited that “The chart shows that 1.618 Fibonacci ratio(XLM: 6.5$, XRP: 26~33$) will be completed at the end of December.” The last time this happened was back in 2017 and the analyst expects a repeat of that trend, saying there would be a 6,500% surge for both assets.

Despite this correlation, Blockchain Backer still finds Monday’s simultaneous pump strange as he believes “those same holders would have dumped XLM for XRP. Not fomo bought XLM on that news story.”

However, as another X user explains, “Not if they believe XLM and XRP are brother and sister. There are some influencers peddling this for years. Doesn’t make logical sense but does with that narrative. XLM would be next!”

Stellar (XLM) Holds Past Week Gains As Bear Taking Control Of The Market

All eyes are on Stellar (XLM) as it breaches the $0.12 resistance despite the massive onslaught in the crypto market. The token managed to hold its past week’s gains while Bitcoin and other top coins maintained consistent bearish momentum. 

Stellar’s current price reflects the growing demand and interest in its payment solution, which is a plausible reason behind its strength. Moreover, excitement is high among XLM investors as the Stellar network prepares for a game-chaining announcement on Tuesday. 

XLM Soars Amid Heightened Speculation In The Stellar Ecosystem

XLM has been bullish since September 2 following Stellar.org’s announcement that “something cool is coming” to the network in 10 days. Following this announcement, XLM’s price increased by 10%, climbing from $0.1135 to $0.126.

Related Reading: Solana (SOL) Price Plunges On FTX Rumors, Buy Or Sell Now?

It maintained the momentum, though with a few dips, reaching $0.134 on September 10. This price move marked a nearly 20% increase from the month low of $0.1117 recorded on August 17.

Furthermore, Stellar Network continued to tease the community with the countdown to the mysterious announcement, as a September 7 tweet also teased that change is underway as the upcoming brand will introduce Stellar to the real world.

The Stellar community is abuzz with anticipation as enthusiasts await the unraveling of the mystery. Some community members speculate that the upcoming announcement could be related to a partnership with Apple. 

In a recent report, Stellar dominated all layer-1 networks in tokenized treasuries by market cap, surpassing Ethereum and Polygon. The August 23 tweet shows that Stellar recorded a tokenized treasury market cap of $304 million. Ethereum, on the other hand, recorded a Treasury market cap of $291 million, while Polygon followed with $24 million.

This report presents Stellar as a leading real-world asset tokenization network, a plausible reason behind XLM’s price increase. 

XLMUSD price chart

Price Outlook: XLM Slips Off $0.13. Will It Rebound?

Over the past 30 days, Stellar’s XLM embodied the resilience lacking in the broader crypto market. While most coins surrendered all past gains, XLM held on, bucking negative market sentiments and soaring new highs.

However, the rally has stalled, and the token currently holds over 3% price decline in the last 24 hours. But it still retains 1.78% gains in the last seven days. 

Stellar has slipped off the newfound support at $0.134 and now trades at $0.1272. This downslide suggests two things. Firstly, the hype around the mysterious announcement must have dwindled. Secondly, XLM could have succumbed to the bearish pressure present in the broader crypto market.

Nonetheless, XLM is in a critical conjecture, as the outcome of the next 24 hours will determine its price trajectory. If the announcement is bullish enough, XLM could witness a positive momentum shift with a massive upswing above the $1.3 price.

Stellar (XLM) Soars By 17% In A Single Week – Can Bulls Maintain Push To $1?

As the general crypto market experiences a slight gain in total market cap, Stellar (XLM) stands out with a substantial amount of price increase over the last week. According to data from CoinMarketCap, the XRP competitor is up by 17.61%, outperforming every other top 100 cryptocurrency in the past seven days. 

XLM To Reach $1?

With XLM currently hovering around the $0.13 price zone, there are speculations on the next movement. Interestingly, a crypto analyst with the name EGRAG CRYPTO on X (formerly Twitter) predicts that XLM could rise to $1 if certain conditions are met. 

According to the analyst’s post on September 8, this bullish prediction is formed on a potential crossover between two technical indicators, namely the 200-day Moving  Average (MA)and the 21-day Exponential Moving Average (EMA).

To explain, the MA indicator reflects the average price data over a specific period of time, e.g., 200 days. It is constantly updated and can be used to identify trade areas and recognize market trends.

On the other hand, The EMA performs a similar function but with a focus on more recent price points. Due to its method of calculation, the EMA reacts to price changes faster than the MA. 

Based on EGRAG CRYPTO’s prediction, if there is an upward crossover of the 21 EMA and 200 MA on XLM’s weekly chart, there is a possibility the token could experience a 500% price surge in the coming months, surpassing the dollar mark to trade at $1.10. 

This prediction is mainly based on historical price data, as XLM witnessed a similar massive price gain when this crossover occurred between 2020 and 2021. 

However, it is worth stating that all predictions are speculations without guarantees and should not be relied on as investment advice. 

Another Partnership For Stellar?

In other news, the Stellar community appears to be expecting a massive positive update in the next few days. On September 2, Stellar Development Foundation shared with its crypto community that “Something cool is dropping in 10 days”. 

This announcement was well received, with the XLM token rising by 10% in the next 24 hours. Interestingly, some enthusiasts predict Stellar could announce a new partnership in the coming week.

The blockchain network has already collaborated with companies such as American remittance firm MoneyGram and Circle, the company behind the USDC stablecoin. In fact, Stellar announced a minority investment in MoneyGram earlier in August. 

For now, it remains unknown what this new development could be. However, there is the possibility it could elicit some effect on XLM’s price trajectory.

At the time of writing, XLM is trading at $0.132, having gone up by $0.132 in the last day. In tandem, the token’s daily trading volume has gained by 21.33% and is valued at $119.14 million.

Stellar

Stellar Breaks Free: Unleashes New Open-Source Disbursement Platform

Blockchain-based payment network Stellar has introduced the open-source “Stellar Disbursement Platform,” aimed at facilitating faster, cost-effective, and transparent digital disbursements worldwide. 

Developed by the Stellar Development Foundation (SDF) over the past year, the platform enables individuals and organizations to execute bulk disbursements using digital assets for various purposes, including gig worker payments and digital aid delivery. 

Initially deployed for digital aid disbursements in Ukraine, the turnkey payment solution is now open-source and available for use and further development by anyone.

Revolutionizing Global Payments?

According to the announcement made on Wednesday, the Stellar Disbursement Platform allows users to send funds to thousands of recipients swiftly within seconds. 

It offers numerous applications, including supplier payments, payroll management, and contractor payments, catering to diverse payment needs. 

Furthermore, the platform’s seamless integration with Stellar’s global network of on and off-ramps, covering over 180 countries, provides recipients with the convenience of converting digital currency to cash “easily.”

Denelle Dixon, CEO of the Stellar Foundation, expressed enthusiasm for the open-source release of the Stellar Disbursement Platform. She highlighted its success in facilitating digital aid disbursements in Ukraine and its subsequent evolution into a comprehensive payment solution. 

Dixon emphasized the platform’s potential to empower gig workers, global payroll systems, and creators, fostering a more inclusive and accessible financial future.

Jeremy Allaire, CEO of Circle, also acknowledged the impact of the Stellar Disbursement Platform on humanitarian aid disbursements. He praised the platform’s effectiveness in utilizing the USD Coin (USDC) and highlighted its potential to advance global disbursement practices. 

The open-source nature of the Stellar Disbursement Platform reflects a commitment to collaboration within the blockchain community. By sharing this tool with the world, Stellar aims to create a more accessible and transparent financial future, benefiting gig workers, global payroll systems, and creators.

Overall, Stellar’s launch of the open-source Stellar Disbursement Platform marks a significant step towards enabling faster, cost-effective, and transparent digital disbursements worldwide. The platform enables individuals and organizations to streamline their payment processes with its wide range of applications and integration with Stellar’s network. 

Stellar Secures Minority Stake In MoneyGram

On Tuesday, the Stellar Development Foundation announced its recent participation in the go-private transaction with Madison Dearborn Partners (MDP), solidifying its position as a minority investor in MoneyGram, providing cross-border P2P (person-to-person) payments and money transfer services.

As part of this investment, SDF has secured a seat on MoneyGram’s Board of Directors, granting the foundation an opportunity to contribute to MoneyGram’s future and digital strategy actively.

Per the announcement, joining a group of leaders from the payments, financial services, and technology sectors, SDF’s presence on the board will leverage its collective expertise to fortify and guide MoneyGram’s digital transformation.

Furthermore, the investment positions SDF to play a vital role in various aspects of MoneyGram’s journey, including the expansion of its digital business, exploration of blockchain technology, and support for the company’s overarching mission of facilitating secure and efficient global money movement for individuals and businesses across multiple countries.

SDF CEO Denelle Dixon expressed confidence in the growth and opportunities arising from this partnership. By fostering solid collaborations with organizations in the payments sector, SDF moves closer to its mission of creating “equitable” access to financial services.

This announcement signifies a mutually beneficial arrangement where SDF’s involvement will contribute to MoneyGram’s digital advancement while aligning with SDF’s vision of facilitating inclusive financial access.

Stellar

Despite recent protocol announcements and developments, the native token of the Stellar protocol, XLM, has consistently declined over the past two weeks. Currently, the coin is trading at $0.1262, reflecting a 2.4% decrease in value over the past 24 hours and a 13.8% decline within the fourteen-day timeframe.

Featured image from iStock, chart from TradingView.com

Stellar (XLM) Poised To Rally? Ukrainian Bank Reveals Successful E-Money Pilot

The Stellar (XLM) price remains in a long-term downtrend. After seeing an all-time high of nearly $0.81 on May 10, 2021, XLM’s price has fallen massively. Currently, XLM is 90.6% down from its ATH. Since October 2021, Stellar has also been in a descending trend channel.

At press time, XLM was trading at $0.0822. Thus, the price is showing initial signs of strength and could make a first attempt to break through the upper line of the trend channel at $0.10. What would probably be needed is a clear move that catapults the XLM price toward the next important resistance level at around $0.13.

Should this succeed, the XLM bulls could target the next resistance zone around $0.23.

Stellar XLM USD

Bullish News Pushing Stellar Out Of The Bearish Trend?

A potential catalyst for a breakout out of the bearish trend was provided yesterday by the Stellar Foundation. It shared in a tweet that TASCOMBANK, one of Ukraine’s oldest commercial banks, published the results of its e-money pilot project on the Stellar network.

Remarkably, TASCOMBANK is one of the leading Ukrainian commercial banks, which is regarded as a system bank. It operates in many areas of banking, including consumer and corporate lending, factoring, e-commerce, and trade finance.

The report on the project, which was launched in December 2021, informs the National Bank of Ukraine and the Ministry of Digital Transformation about the benefits of issuing e-money on the Stellar blockchain, highlighting the advantages.

As stated in a Stellar Foundation blog post, TASCOMBANK praises the blockchain’s transparency, security, and confidentiality of customer data, low transaction costs, instant payment functionality, and high throughput “at each stage of development, from conducting operations to testing”

The goal of the project was to test the issuance of e-money, focusing on peer-to-peer and merchant payments, as well as payroll. Sergii Kholod, First Deputy Chairman of the Board of TASCOMBANK, commented:

As part of a pilot project we explored a new way of issuing and managing electronic money which could be a new generation means of payment for the citizens and organizations of Ukraine, their employees and clients, government institutions, and international organizations.

Speaking about the pilot project, Oleksii Shaban, Deputy Governor of the National Bank of Ukraine, said that there are “still many hypotheses” that need to be investigated in the pilot project. However, he expressed that the pilot results are an important basis for use at commercial and central banks.

Oleksandr Bornyakov, the Deputy Minister of Digital Transformation of Ukraine, also revealed that his ministry and TASCOMBANK are currently examining “the approaches to further rollout of blockchain-based payment instruments.”

Stellar (XLM) Could Grow Dim This Week, But Buyers Don’t Need To Back Down

Stellar (XLM), the 27th ranked cryptocurrency in terms of market capitalization, managed to pump its spot trading price by 2.1% over the last 24 hours.

At press time, according to tracking from Coingecko, the asset is changing hands at $0.112 and has been down by 3.3% and 4.4% on is biweekly and monthly charts, respectively.

Here’s a quick look at XLM’s performance:

  • Stellar has once again fallen into a bearish price pattern
  • XLM needs to sustain and surpass its current trading price of $0.112 to break from its downward trend
  • Stellar forecasted to drop to $0.085 over the next 30 days

The altcoin suffered when it failed to move past the $0.13 resistance marker and fell into a pattern that indicates further downward trend.

XLM’s technical indicators and analysis hint at a continued exposure to negative factors that will prevent it from climbing to higher levels over the next few days.

Repetitive Rejection On Crucial Levels Cripples Stellar

Since the middle part of June, the altcoin was trading at a narrow range of $0.10 and $0.13. XLM tried to test and surpass the aforementioned resistance level but was unsuccessful.

Source: TradingView

Not only that, it also failed to sustain the crucial support marker of $0.125. As a result, in just two days, the asset declined by 12%. That, however, was erased by its recent price pump.

Stellar’s Relative Strength Index (RSI) is below the 50-neutral zone but it hasn’t reached the point of being overbrought or oversold.

While buyers might seem to be discouraged by these bearish signals, there is a possibility that the downtrend thesis will be invalidated.

This will happen if XLM manages to surpass the $0.112 range. Failure to do so, however, might result to a steep fall all the way down to $0.101.

XLM Price Forecast

According to Coincodex, Stellar has 17 technical indicators that are sending bearish signals while 15 were leaning towards bullish signs.

With this, the crypto is forecasted to slightly increase its trading price to $0.113 over the next five days. The next 30 days, however, will be painful for holders as the altcoin is seen to plummet all the way down to $0.085.

There is also significant level of fear towards the asset as it scored 33 on the Fear and Greed Index. XLM is also facing a high yearly inflation rate of 5.44%.

It has been trading below the 200-day simple moving average and has not shown any signs of performing better anytime soon.

Still, just like with any other cryptocurrency, it is not immune to the volatility of the crypto space so its price can also go high as fast as it goes down, and vice versa.

XLM total market cap at $2.8 billion on the daily chart | Featured image from National Review, Chart: TradingView.com

Disclaimer: The analysis is based on the author’s personal knowledge and should not be construed as investment advice.

Stellar (XLM) Buyers Must Check Out These Data Before Going Long

Stellar is one of the cryptocurrencies that had an interesting and fruitful 2021, perhaps why the altcoin is making positive noise these days for being a viable asset for long trading.

  • Stellar could enter a dull phase on the coming sessions
  • XLM is -10.1% over the past week
  • Stellar is on an extended bearish momentum

In crypto space, long trading involves buying an asset and making profit as its price increase. On the other hand, short trading happens when one sells a borrowed security and buys it back at a lower price, making income from the decreased value.

Stellar is hot in the eyes of investors looking to earn from long trading as the digital currency’s current price is significantly lower than its 2021 levels.

Given the virtual coin’s ability to increase its price tremendously, its easy to understand why investors might pick Stellar for their long trading scheme.

But, as with other ventures, it would be wise to pay close attention to XLM’s price movement first, before putting sizable investment on it and deciding to play the long game.

Stellar Price Analysis and Trajectory

After a spectacular showing in May 2021 when it attained multiple yearly highs, Stellar has fallen into a gradual bearish rally and is positioned in trendline resistance for over 17 months now.

Source: TradingView

At press time, data from Coingecko shows the crypto is trading at $0.113 and is down by 10.1% over the past week. On a year-to-date comparison, Stellar is – 68.8%.

The bearish momentum of the crypto market hit XLM very hard as its price fluctuates between $0.09 and $0.1 which has been its support range for the past 22 months.

As different metrics such as 20 and 50 EMA and Relative Strength Index indicating the asset could be looking at a dull phase in the coming sessions, investors looking for long trading might have problem gaining the kind of profit they expect.

Stellar’s Superb 2021 Showing

As mentioned earlier, XLM had an impressive run in 2021, ending up as one of the most watched out digital assets of the year.

After starting 2021 with a price of $0.133, the crypto wasted no time as it increased its value by 224% during the first week of January to trade at $0.432.

The following month, Stellar successfully completed a bullish rally as it hit $0.6. But the asset wasn’t immune to the volatility of its space, as it experienced price dump before bouncing back on April 14 when it changed hands at $0.689.

The month of May proved to be even better for the crypto, as it notched a higher trading price of $0.791 on the 17th.

But Stellar suddenly appeared to have used up all its momentum as its price declined over the months that followed.

XLM total market cap at $2.9 billion on the daily chart | Featured image from CoinLive, Chart: TradingView.com

Disclaimer: The analysis represents the author’s personal views and should not be construed as investment advice.

Stellar Soars 6% In Last 30 Days – Can XLM Keep On Shining This Week?

Since the beginning of this month, Stellar (XLM) has increased by 6%, continuing its remarkable monthly performance. Coingecko reports a 4-day performance for XLM of 5.3%, while charts show an impressive 31.50% rise over the previous 30 days.

This price change is even more unexpected when considered in light of this. Santiment recently took to Twitter to reveal a rather unsettling image for the cryptocurrency community.

“There has been quite a lot of #bloodinthestreets. Unless your portfolio mainly consists of $BNB, $XLM, $QNT, $MKR, $HT, or other scarce positive #altcoins the past 30 days, you’re down. This reflects in the shrinking group of individuals still interested in #cryptocurrency,” Santiment tweeted.

The question of whether or not XLM can sustain its recent gains is intriguing. In spite of this, a rise of this magnitude is usually followed by a severe reversal as investors’ fears replace their excitement.

Stellar: What The Indicators Suggest

There are a number of signs to keep an eye on. And by “indicators,” it means the CMF, momentum, and bull-bear power. These metrics reveal the direction of the market, and the recent price surge has not yet altered investor opinion about the token.

Chart: TradingView

The money flow index of Chaikin is still heavily bearish, although bulls are testing a breach towards the positive top half. According to the bull-bear power indicator, bears have lost considerable impetus. This is related to the price increase during the past month.

The momentum indicator revealed a modest increase in bullish momentum followed by a slight decline. We may infer that buying enthusiasm for the cryptocurrency is currently high, but purchasers should be warned that a drop may occur in the coming days or weeks.

Slowing Down The Decline

The current rise is supported by the $0.0996 support line, which has halted the crypto market decline from May to June. This has served as the base from which the bulls have leveraged the current rally. Currently, the market is still being supported by the bulls.

As evidenced by the persisting pullbacks in XLM’s price, the current price action indicates that the correction phase is still in its infancy and that bulls continue to rule the market.

As of the time of writing, the token is trading in the green and may rise again following earlier pullbacks and a minor price decline.

XLM market cap at $2.9 billion on the daily chart | Featured image from Steemit, Source: TradingView.com

Stellar (XLM) Still Contemplating To Join The Green Part, Will Price Give In?

  • XLM price shows could be ready for a major boost as the price remains bullish with good volume and strength.
  • XLM trades above support as the price aims to continue its trend movement as the price keeps holding above 8 and 20-day EMA.
  • The price of XLM eyes a rally to $0.14 as the price breaks out of an ascending triangle with more buy orders. 

The price of Stellar (XLM) has continued to show its strength as price trends with a key breakout from a range-bound movement against tether (USDT). With the crypto market cap bouncing from its weekly low as the market continued to look promising, the price of Stellar (XLM) was not left out as the price broke out of its long-range, with price trending to a higher height with eyes set for a possible $0.14 target. (Data from Binance)

Stellar (XLM) Price Analysis On The Weekly Chart

The crypto market received the relief, as most crypto altcoins expected. However, despite the recent price surge in most crypto assets, some altcoins have remained range-bound.

One project that has shown great signs of a recovery bounce but keeps stalling in price is XLM as the price continues to range as it aims a rally to a height of $0.14.

The price of XLM saw its price rejected to a weekly low of $0.1, with XLM showing so much strength holding off price sell-off as the price bounced to a region of $0.13.  

Weekly resistance for the price of XLM – $0.14.

Weekly support for the price of XLM – $0.1.

Price Analysis Of XLM On The Daily (1D) Chart
Daily XLM Price Chart | Source: XLMUSDT On Tradingview.com

On the daily timeframe, the price of XLM continues to show strength as it pulls some gains despite the market appearing to have stalled in price movement; after hitting a daily low of $0.1, the price of XLM rallied to a high of $0.13 before being rejected into an ascending triangle as it struggled to break out with price breaking out and looking more bullish for a rally.

The price of XLM breaking out signals more bullish trends to a high of $0.14 and a possible rally to $0.16. The price of XLM holding 8 and 20-day Exponential Moving Average (EMA) is a good sign for price growth. 

The prices at $0.12 and $0.11 correspond to the 8 and 20-day EMA values. 

XLM’s price has a support level at 8, and 20 EMA, a break below this level would mean a retest of $1 or even lower.

The Relative Strength Index (RSI) for XLM shows increasing buy orders as the value is above the 50 mark area daily.

Daily resistance for the XLM price – $0.14.

Daily support for the XLM price – $0.1.

Featured Image From Cryptoholics, Charts From Tradingview

Stellar (XLM) Shows Strong Recovery From Recent Slide

Stellar (XLM) has seen a stunning turnaround after the recent market downturn. However, following the announcement of the CPI report and corresponding fears of an interest rate hike, a sell-off ensued.

The Donchian channel indicates that the average price of XLM is $0.1076 as of this writing. After a drop, the Awesome Indicator also gives off very strong bullish signs.

This could signal a rebound. The XLM market has showed a spectacular recovery from the September 13 catastrophe, with prices climbing back above the $0.1004 support line that sustained the downturn from August 14 to September 6.

At the 4-hour time mark, the coin is following an uptrend. Looking at the wider picture, however, we see that the upturn may be short-lived.

Stellar Rally Gives Investors Some Confidence

The XLM token closely tracks Bitcoin’s price movements because the whole cryptocurrency market is modeled after it. The downward pressure of the triangle indicates that the coin’s motion is heading in a downward direction.

Price levels of support and resistance were calculated using the Fibonacci retracement tool. The bulls are attempting to leverage two supports located at $0.1023 and $0.1058.

These two factors have bolstered traders’ and investors’ optimism, which has contributed to the price increase.

The range of $0.1153 represents the resistance level. If price momentum overcomes this resistance, the price might rise to the $0.1234 region. This can be a strong purchase signal for investors and traders.

Indicator of momentum also demonstrates bullishness. In addition to purchase signals, moving averages are currently sending buy signals. For the market to rebound, however, bulls must have sustained momentum in order to surpass the $0.1194 and $0.1234 resistance levels.

Looming Interest Rate Hike To Determine XLM Price

Even for the broader cryptocurrency market, this can be a challenging issue. As previously indicated, XLM and other cryptocurrencies on the market share a strong correlation with Bitcoin which, in contrast, tracks the S&P 500 Index.

In light of this, XLM’s mini-rally could be imperiled if larger financial markets continue to fear an impending interest rate hike. The XLM price is already struggling to surpass the $0.1153 barrier level.

From the 10th until the 13th of September, the coin has already tested the specified resistance level. The coin is trading close to the resistance level of $0.1153 at the time of writing.

The presence of long candles on the charts may signal another attempt to break out of a trading range. If the price falls again, it should not breach the $0.1023 support level, since doing so could spark a bigger sell-off.

XLM total market cap at $2.8 billion on the daily chart | Source: TradingView.com

Featured image from Zipmex, Chart: TradingView.com

(The analysis represents the author’s personal views and should not be construed as investment advice).

XLM Depicts Buying Resurgence, Where’s It Headed Next?

XLM price picked up momentum after the coin retraced on its chart over the past week. Over the last 24 hours however, XLM appreciated by 3.6% and was successful in toppling over its immediate resistance mark. The bulls were back in charge and the technical outlook of XLM also portrayed the same sentiment.

Currently, XLM price has become steady on the $0.121 level. Over the past few days, XLM has consistently formed higher highs and higher lows which is a sign of bullishness in the market. If the altcoin is able to hold onto its price momentum, then the coin could eye the $0.130 price ceiling over the upcoming trading sessions. Buying strength for Stellar remains crucial for the coin.

XLM price last hovered around this price mark multiple weeks back, around the end of June. A crash from the present price level could bring XLM price to $0.114. Previously when XLM price traded at $0.124, it was met with bearish pressure resulting in Stellar falling to $0.114.

XLM Price Analysis: Four Hour Chart
Stellar was priced at $0.126 on the four hour chart | Source: XLMUSD on TradingView

The altcoin was priced at $0.126 at the time of writing. The bulls resurfaced along with buyers in the market, this made XLM flip its immediate resistance mark into its support line. Overhead resistance for XLM now was at $0.127 and then at $0.129.

On the other hand, local support for XLM price stood at $0.119. Inability to sustain its price over the aforementioned support line, can bring the altcoin down to $0.114.

Stellar has made considerable recovery given the altcoin had touched a 20-month low price level in the middle of July, this year.

Trading volume of Stellar dipped on the four hour chart, this is an indication of falling selling strength in the market.

Technical Analysis
Stellar was overbought on the four-hour chart | Source: XLMUSD on TradingView

Technical outlook has painted an extreme bullish picture for XLM price on the four-hour chart. There has been a sharp spike in the number of buyers on XLM’s chart.

The Relative Strength Index was parked into the overbought zone which meant that the asset was overvalued.

Buying strength had overpowered selling strength heavily at press time. XLM price was way above the 20-SMA line.

This reading points towards the buyers driving the price momentum in the market. The price of the altcoin was also above the 50-SMA and 200-SMA which signified that demand for the altcoin had substantially increased.

Stellar depicted buy signal on the four-hour chart | Source: XLMUSD on TradingView

Stellar captured buy signal on its chart in accordance with the other indicators on the chart. The Moving Average Convergence Divergence depicts the price momentum and reversal in same. MACD had pictured green signal bars over the half-line after it experienced a bullish crossover.

The green signal bars were tied to buy signal for XLM. Directional Movement Index is responsible for portraying the current price trend and the strength of the trend in the market. DMI was positive because the +DI line was above the -DI line.

Average Directional Index (Red) was seen moving towards the 40-mark, this signified strength in the present price direction indicating that XLM price will continue to register an upward movement over the upcoming trading sessions.

Related Reading: Market Sentiment Holds Steady As Bitcoin Aims For $24,000


Featured image from StormGain, Charts from TradingView.com