XRP To Hit Zero Against BTC? Veteran Trader Cites ‘Pure Classical Charting’

In a recent analysis shared via X, Peter Brandt, regarded as one of the leading experts globally in applying classical charting techniques to trading futures, foreign exchange, and crypto markets, suggested that the XRP to Bitcoin (XRP/BTC) exchange rate could potentially hit zero. Brandt’s analysis applies traditional techniques inspired by pioneers such as Schabacker, Edwards, and Magee to forecast this drastic trend.

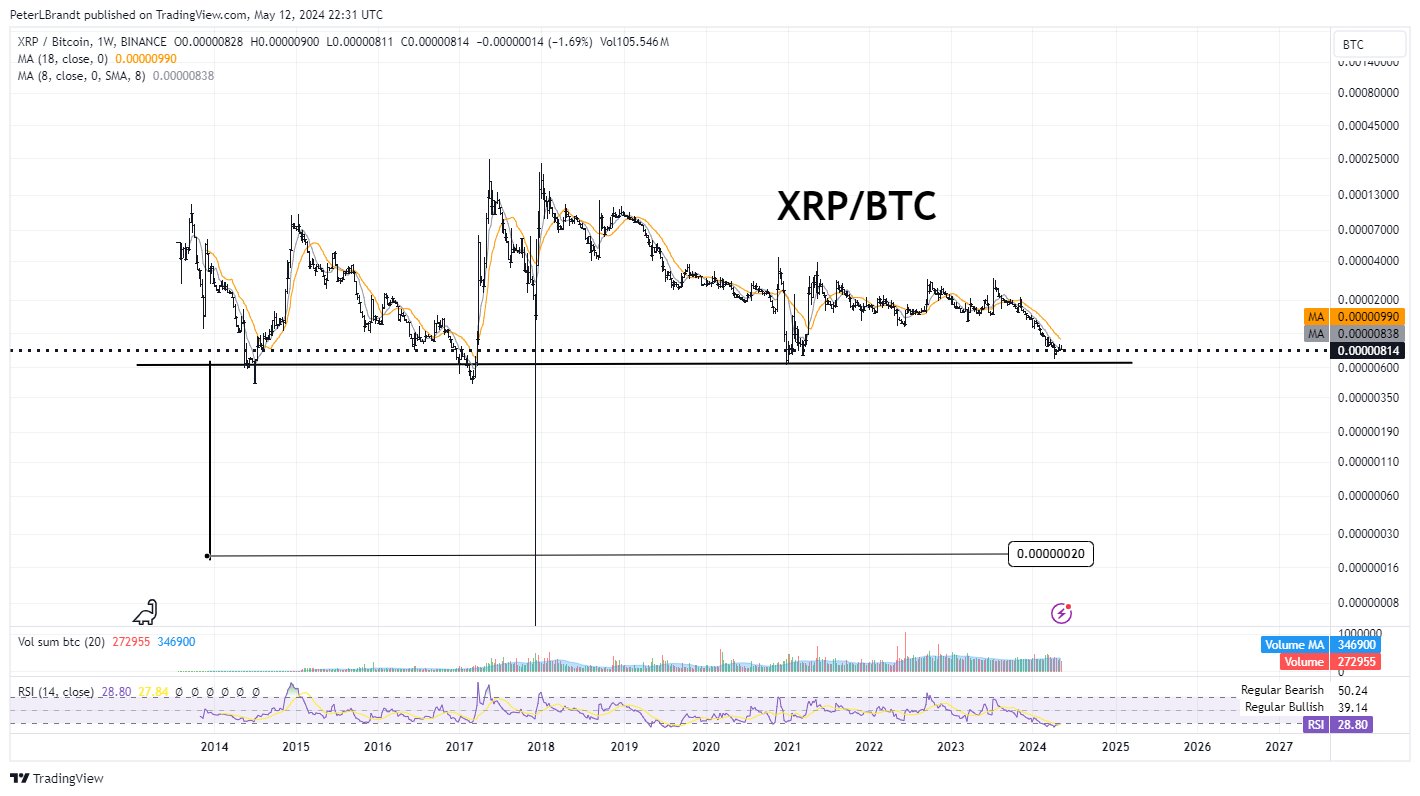
Brandt stated, “From a pure classical charting point of view (that is, Schabacker, Edwards, Magee) this chart looks like it is headed toward Zero. XRPBTC”

XRPBTC analysis

Why Brandt Thinks XRP Is Going To Zero Vs. BTC

The chart indicates a troubling trajectory for XRP when priced in Bitcoin, with key support levels being consistently tested over time. The weekly chart showcases a series of peaks and troughs with notable highs in 2017 and a sharp decline from 2018 onwards.

Recently, the XRP/BTC ratio has been hovering around a crucial support line, illustrated by a dashed horizontal line on the chart. Notably, the chart shows XRP/BTC experiencing significant volatility over the years. After reaching highs in 2017 at 0.00025 BTC, it has been on a general downtrend, especially notable after September 2018. “XRPPBTC has lost 70% of its value since the Nov 2017 post,” Brandt commented.

A critical historical support level for the digital asset is highlighted by Brandt at around 0.000007 BTC (black line), which the market is currently testing. The continuation of the bearish trend might break this support.

Moreover, two moving averages are depicted on the chart. The 8-week SMA (Simple Moving Average) is currently at 0.00000838 BTC, while the 18-week SMA stands at 0.00000990 BTC, indicating bearish momentum as the price is below both averages.

The Relative Strength Index (RSI) on the chart, with a 14-week period, is at 28.80, which is near the oversold territory. This might usually suggest a potential for price recovery, yet the persistent bearish sentiment depicted suggests caution.

Peter Brandt’s assertion that the XRP/BTC ratio could be “headed toward Zero” comes from observing the continued failure of the price to rebound from key support levels and the downtrend remaining intact without signs of reversal. His commentary reflects a stark outlook for XRP when compared against Bitcoin, emphasizing the importance of these technical levels in predicting future movements.

In a follow-up post on X, Brandt doubled down on this claim, stating, “It is actually fun poking a stick at XRP_aholics. My comparison is to BTC, not USD, so here is what I don’t understand. How can XRP bulls be so insistent in that XRP is near ATLs vs BTC, and, in fact, has only closed higher than present levels in 6 of the last 126 months?”

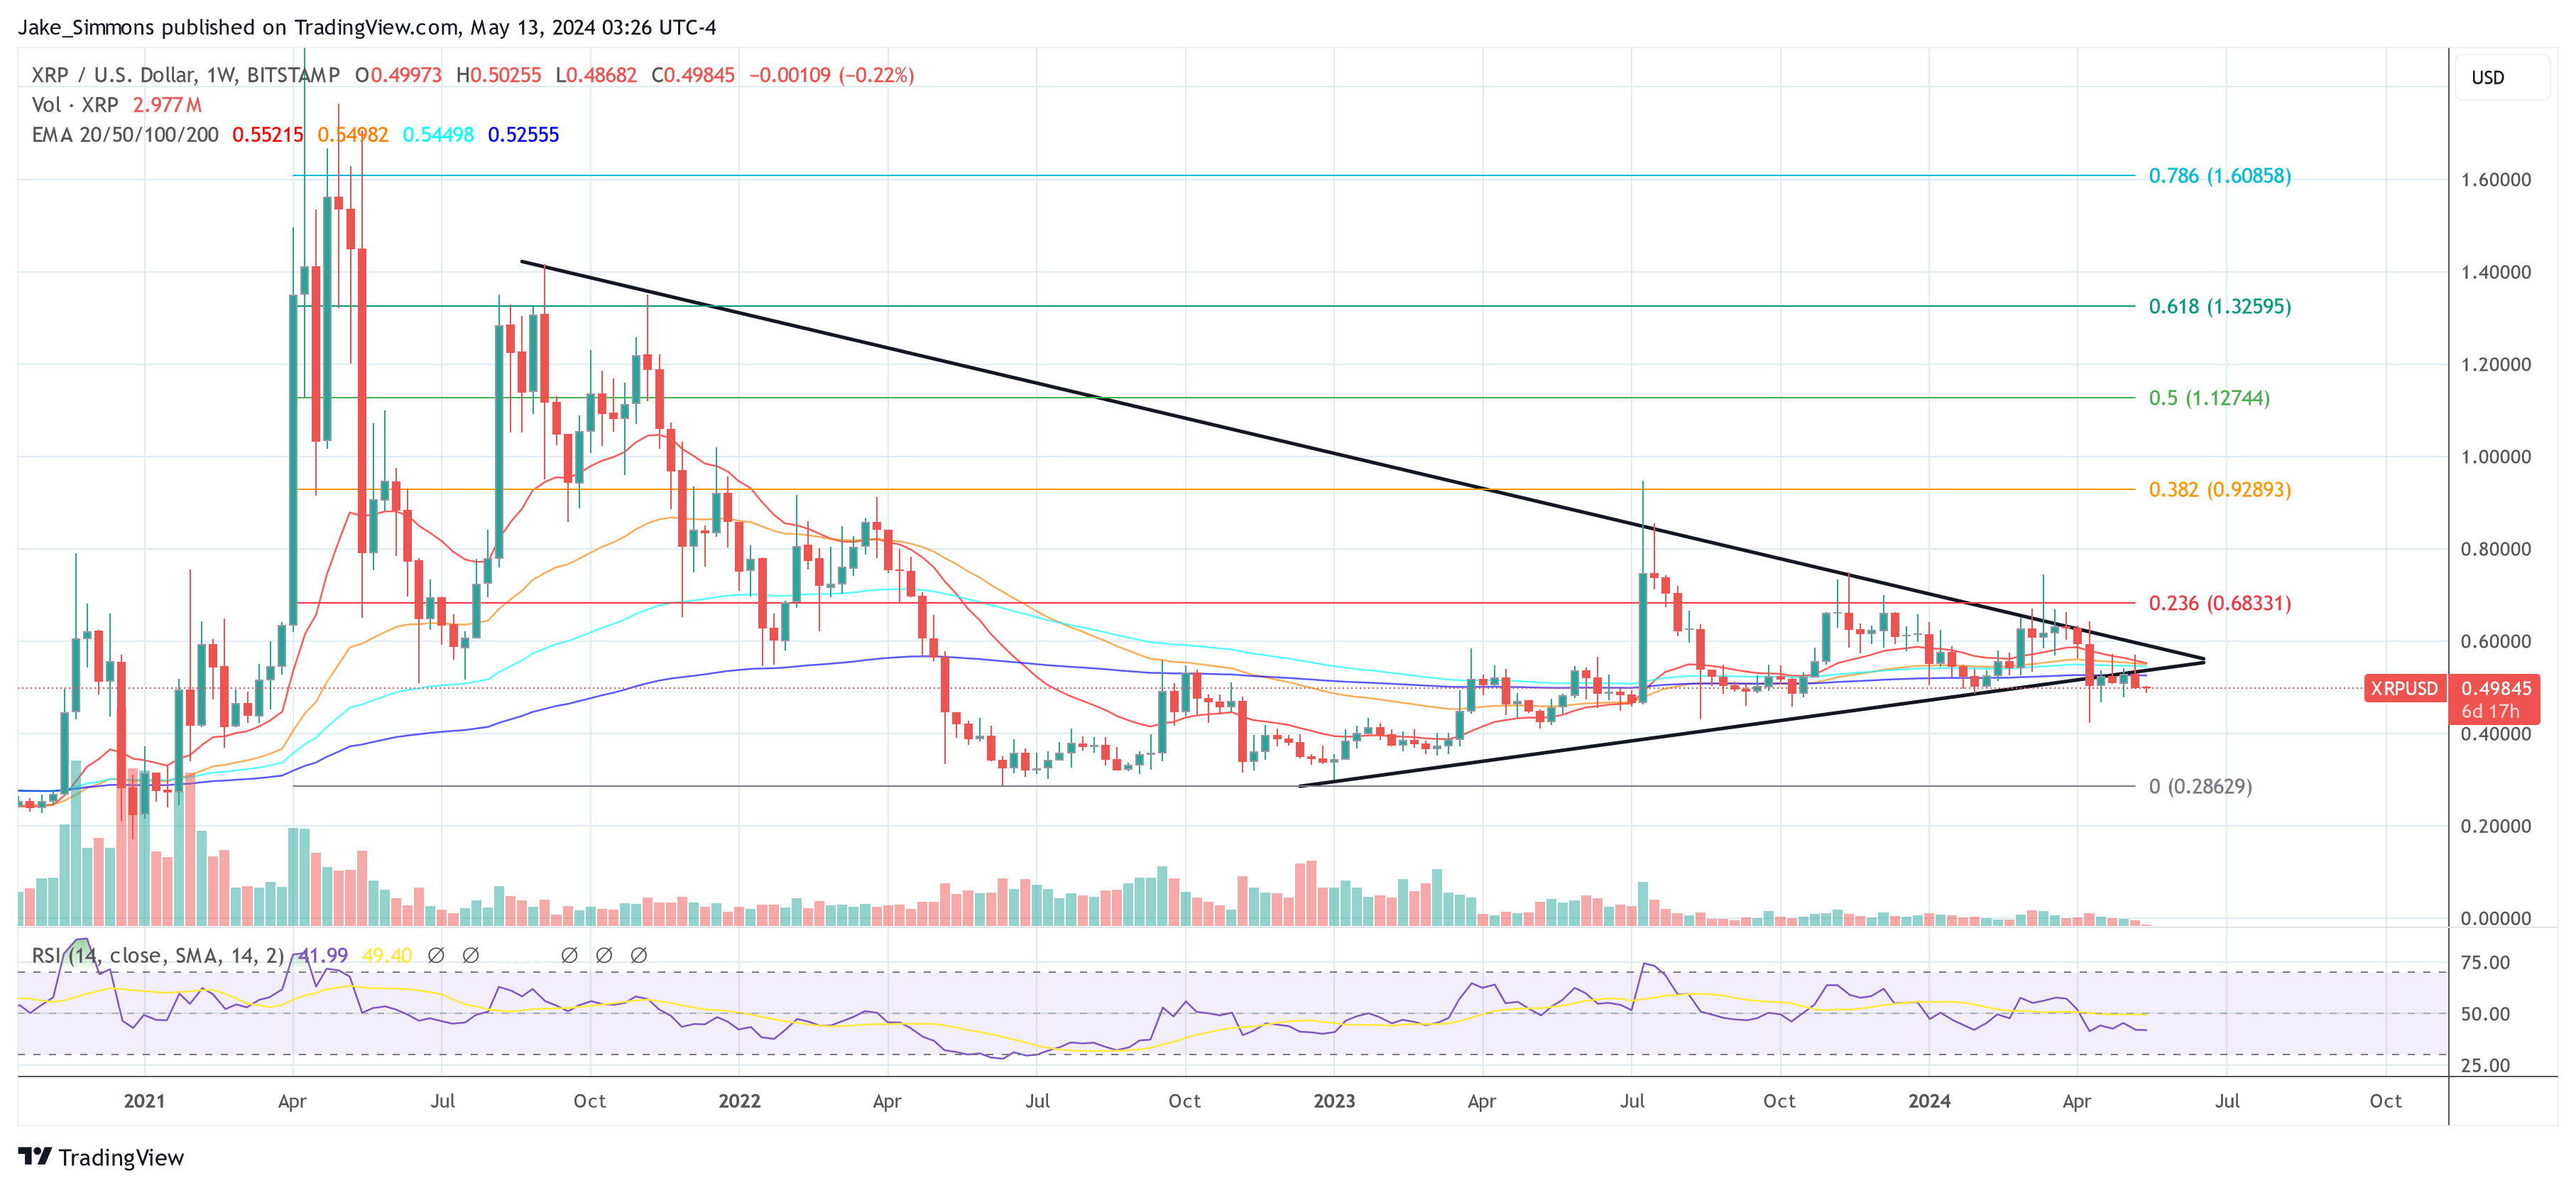
At press time, XRP traded at $0.49845.

XRP price

XRP Bears Keeps Pushing, Indicators Suggest A Strengthening Case of More Losses

XRP price started a fresh decline from the $0.5050 resistance zone. The price could decline further if there is a close below the $0.4865 support.

  • XRP extended losses and traded below the $0.500 support.
  • The price is now trading below $0.4950 and the 100-hourly Simple Moving Average.
  • There is a key bearish trend line forming with resistance at $0.4980 on the hourly chart of the XRP/USD pair (data source from Kraken).
  • The pair could slide further toward the $0.4550 support in the near term.

XRP Price Dives Below $0.50

Recently, XRP price attempted a recovery wave above the $0.5050 level. However, the bears were active and the price started a fresh decline below the $0.500 support, like Ethereum and Bitcoin.

There was a move below the $0.4920 and $0.4880 levels. A low was formed at $0.4867 and the price is now consolidating losses. It is trading near the 23.6% Fib retracement level of the downward move from the $0.5085 swing high to the $0.4867 low.

The price is now trading below $0.4950 and the 100-hourly Simple Moving Average. Immediate resistance is near the $0.4980 level. There is also a key bearish trend line forming with resistance at $0.4980 on the hourly chart of the XRP/USD pair. It is close to the 50% Fib retracement level of the downward move from the $0.5085 swing high to the $0.4867 low.

XRP Price

Source: XRPUSD on TradingView.com

The first key resistance is near $0.500. A close above the $0.500 resistance zone could spark a strong increase. The next key resistance is near $0.5085 and the 100-hourly Simple Moving Average. If the bulls remain in action above the $0.5085 resistance level, there could be a rally toward the $0.5250 resistance. Any more gains might send the price toward the $0.550 resistance.

More Losses?

If XRP fails to clear the $0.50 resistance zone, it could start another decline. Initial support on the downside is near the $0.4865 level.

The next major support is at $0.4780. If there is a downside break and a close below the $0.4780 level, the price might accelerate lower. In the stated case, the price could retest the $0.450 support zone.

Technical Indicators

Hourly MACD – The MACD for XRP/USD is now gaining pace in the bearish zone.

Hourly RSI (Relative Strength Index) – The RSI for XRP/USD is now below the 50 level.

Major Support Levels – $0.4865 and $0.4780.

Major Resistance Levels – $0.500 and $0.5085.

XRP Price Prediction – Can 100 SMA Trigger Another Steady Increase

XRP price is correcting gains from the $0.570 resistance. The price is stable above the $0.5240 support and might aim for a fresh increase in the near term.

  • XRP started a decent increase and climbed above the $0.550 resistance.
  • The price is now trading above $0.5250 and the 100 simple moving average (4 hours).
  • There is a key bullish trend line forming with support at $0.5320 on the 4-hour chart of the XRP/USD pair (data source from Kraken).
  • The pair could start another increase if the bulls defend the $0.5240 support.

XRP Price Holds Support

Recently, XRP price started a decent increase above the $0.5250 resistance zone. The bulls even pushed the price above the $0.550 resistance zone before the bears appeared.

A high was formed at $0.5699 before there was a pullback like Bitcoin and Ethereum. The price dipped below the $0.550 support zone. The price declined below the 23.6% Fib retracement level of the upward move from the $0.4787 swing low to the $0.5699 high.

However, the price is now stable above $0.5250 and the 100 simple moving average (4 hours). There is also a key bullish trend line forming with support at $0.5320 on the 4-hour chart of the XRP/USD pair.

XRP Price Prediction

Source: XRPUSD on TradingView.com

Immediate resistance is near the $0.5480 level. The first key resistance is near $0.570. A close above the $0.570 resistance zone could spark a strong increase. The next key resistance is near $0.5850. If the bulls remain in action above the $0.5850 resistance level, there could be a rally toward the $0.620 resistance. Any more gains might send the price toward the $0.680 resistance.

More Losses?

If XRP fails to clear the $0.5480 resistance zone, it could start another decline. Initial support on the downside is near the $0.5320 level and the trend line.

The next major support is at $0.5240 and the 100 simple moving average (4 hours). If there is a downside break and a close below the $0.5240 level, the price might accelerate lower. In the stated case, the price could retest the $0.50 support zone.

Technical Indicators

4-Hours MACD – The MACD for XRP/USD is now losing pace in the bullish zone.

4-Hours RSI (Relative Strength Index) – The RSI for XRP/USD is now above the 50 level.

Major Support Levels – $0.5320, $0.5240, and $0.500.

Major Resistance Levels – $0.5480, $0.570, and $0.600.

XRP Price Prediction – Will Bearish Trend Push Prices Under $0.50?

XRP price is struggling to recover above the $0.520 resistance. The price could gain bearish momentum if it breaks the $0.50 support.

  • XRP is attempting a fresh increase and facing hurdles near $0.520.
  • The price is now trading near $0.5150 and the 100 simple moving average (4 hours).
  • There is a major bearish trend line forming with resistance at $0.520 on the 4-hour chart of the XRP/USD pair (data source from Kraken).
  • The pair could gain bullish momentum if there is a close above the $0.520 resistance.

XRP Price Aims Upside Break

Recently, XRP price climbed above the $0.550 resistance and tested $0.570. A high was formed at $0.5705 before there was a pullback like Bitcoin and Ethereum. The price dipped below the $0.5250 support zone.

It even spiked below $0.500 and tested $0.4980. A low was formed at $0.4990 and the price is now consolidating near the 23.6% Fib retracement level of the downward move from the $0.5705 swing high to the $0.4990 low. It also trades near $0.5150 and the 100 simple moving average (4 hours).

Immediate resistance is near the $0.520 level. There is also a major bearish trend line forming with resistance at $0.520 on the 4-hour chart of the XRP/USD pair.

XRP Price Prediction

Source: XRPUSD on TradingView.com

The next key resistance is near $0.5350 or the 50% Fib retracement level of the downward move from the $0.5705 swing high to the $0.4990 low. A close above the $0.5350 resistance zone could spark a strong increase. The next key resistance is near $0.570. If the bulls remain in action above the $0.570 resistance level, there could be a rally toward the $0.620 resistance. Any more gains might send the price toward the $0.680 resistance.

More Losses?

If XRP fails to clear the $0.520 resistance zone, it could start another decline. Initial support on the downside is near the $0.500 level.

The next major support is at $0.490. If there is a downside break and a close below the $0.490 level, the price might accelerate lower. In the stated case, the price could retest the $0.460 support zone.

Technical Indicators

4-Hours MACD – The MACD for XRP/USD is now gaining pace in the bullish zone.

4-Hours RSI (Relative Strength Index) – The RSI for XRP/USD is now near the 50 level.

Major Support Levels – $0.500, $0.4990, and $0.460.

Major Resistance Levels – $0.520, $0.5350, and $0.570.

XRP Price Reclaims $0.50 and Indicators Suggest Fresh Surge To $0.70

XRP price is recovering higher above the $0.500 resistance. The price is signaling a positive bias and might rally above the $0.580 and $0.600 levels.

  • XRP is attempting a recovery wave above the $0.50 zone.
  • The price is now trading above $0.5150 and the 100 simple moving average (4 hours).
  • There was a break above a key bearish trend line with resistance at $0.5220 on the 4-hour chart of the XRP/USD pair (data source from Kraken).
  • The pair could gain bullish momentum if there is a close above the $0.580 resistance.

XRP Price Aims Higher

After a sharp decline, XRP price found support near the $0.3880 zone. It formed a base and started a fresh increase above the $0.450 resistance, like Bitcoin and Ethereum. The bulls were able to push the price above the $0.50 resistance.

The price climbed above the 50% Fib retracement level of the downward move from the $0.6420 swing high to the $0.3875 low. Besides, there was a break above a key bearish trend line with resistance at $0.5220 on the 4-hour chart of the XRP/USD pair.

The price is now trading above $0.5150 and the 100 simple moving average (4 hours). Immediate resistance is near the $0.5650 level. The next key resistance is near $0.5820 or the 76.4% Fib retracement level of the downward move from the $0.6420 swing high to the $0.3875 low.

XRP Price

Source: XRPUSD on TradingView.com

A close above the $0.5820 resistance zone could spark a strong increase. The next key resistance is near $0.620. If the bulls remain in action above the $0.620 resistance level, there could be a rally toward the $0.680 resistance. Any more gains might send the price toward the $0.700 resistance.

Another Drop?

If XRP fails to clear the $0.5820 resistance zone, it could start another decline. Initial support on the downside is near the $0.540 level.

The next major support is at $0.5150. If there is a downside break and a close below the $0.5150 level, the price might accelerate lower. In the stated case, the price could retest the $0.4650 support zone.

Technical Indicators

4-Hours MACD – The MACD for XRP/USD is now gaining pace in the bullish zone.

4-Hours RSI (Relative Strength Index) – The RSI for XRP/USD is now above the 50 level.

Major Support Levels – $0.540, $0.5150, and $0.4650.

Major Resistance Levels – $0.5650, $0.5820, and $0.6200.

XRP Price Recovery Could Soon Fade, These Are Key Levels To Watch

XRP price is struggling to recover above the $0.5140 resistance. The price must stay above the $0.4550 support to attempt a fresh increase in the near term.

  • XRP is attempting a recovery wave above the $0.450 zone.
  • The price is now trading below $0.550 and the 100 simple moving average (4 hours).
  • There is a key bearish trend line forming with resistance at $0.5440 on the 4-hour chart of the XRP/USD pair (data source from Kraken).
  • The pair could gain bearish momentum if there is a close below the $0.4550 support.

XRP Price Turns Red

After a steady increase, XRP price struggled to clear the $0.6420 resistance. It started a fresh decline below the $0.600 support, like Bitcoin and Ethereum. There was a sharp move below the $0.500 support.

Finally, the price tested the $0.3880 zone. A low was formed at $0.3875 and the price started a recovery wave. There was a move above the $0.40 and $0.450 levels. The price climbed above the 23.6% Fib retracement level of the downward move from the $0.6420 swing high to the $0.3875 low.

The price is now trading below $0.550 and the 100 simple moving average (4 hours). Immediate resistance is near the $0.5140 level and the 50% Fib retracement level of the downward move from the $0.6420 swing high to the $0.3875 low.

The next key resistance is near $0.540. There is also a key bearish trend line forming with resistance at $0.5440 on the 4-hour chart of the XRP/USD pair. A close above the $0.540 resistance zone could spark a strong increase. The next key resistance is near $0.600.

XRP Price

Source: XRPUSD on TradingView.com

If the bulls remain in action above the $0.600 resistance level, there could be a rally toward the $0.6240 resistance. Any more gains might send the price toward the $0.700 resistance.

Another Decline?

If XRP fails to clear the $0.5440 resistance zone, it could start another decline. Initial support on the downside is near the $0.480 level.

The next major support is at $0.4550. If there is a downside break and a close below the $0.4550 level, the price might accelerate lower. In the stated case, the price could retest the $0.420 support zone.

Technical Indicators

4-Hours MACD – The MACD for XRP/USD is now losing pace in the bearish zone.

4-Hours RSI (Relative Strength Index) – The RSI for XRP/USD is now below the 50 level.

Major Support Levels – $0.480, $0.4550, and $0.420.

Major Resistance Levels – $0.5140, $0.5440, and $0.600.

XRP Price Still Have A Chance For A Bullish Streak: Here’s How

XRP price is struggling to clear the $0.6420 resistance. The price must stay above the $0.600 support to attempt a fresh increase in the near term.

  • XRP is slowly moving lower from the $0.6420 resistance zone.
  • The price is now trading below $0.6120 and the 100 simple moving average (4 hours).
  • There is a key bullish trend line forming with support at $0.6020 on the 4-hour chart of the XRP/USD pair (data source from Kraken).
  • The pair could gain bearish momentum if there is a close below the $0.600 support.

XRP Price Revisits Support

After a steady increase, XRP price struggled to clear the $0.6420 resistance. It started a fresh decline below the $0.6250 support, like Bitcoin and Ethereum.

There was a move below the $0.6200 support. The price traded below the 23.6% Fib retracement level of the upward move from the $0.5622 swing low to the $0.6420 high. The price is now trading below $0.6120 and the 100 simple moving average (4 hours).

It is testing the $0.6020 support and the 50% Fib retracement level of the upward move from the $0.5622 swing low to the $0.6420 high. There is also a key bullish trend line forming with support at $0.6020 on the 4-hour chart of the XRP/USD pair.

Immediate resistance is near the $0.610 level and the 100 simple moving average (4 hours). The next key resistance is near $0.6220. low. A close above the $0.6220 resistance zone could spark a strong increase. The next key resistance is near $0.6420.

XRP Price

Source: XRPUSD on TradingView.com

If the bulls remain in action above the $0.6420 resistance level, there could be a rally toward the $0.6620 resistance. Any more gains might send the price toward the $0.700 resistance.

More Losses?

If XRP fails to clear the $0.6220 resistance zone, it could start another decline. Initial support on the downside is near the $0.6020 zone and the trend line.

The next major support is at $0.580. If there is a downside break and a close below the $0.580 level, the price might accelerate lower. In the stated case, the price could retest the $0.5450 support zone.

Technical Indicators

4-Hours MACD – The MACD for XRP/USD is now gaining pace in the bearish zone.

4-Hours RSI (Relative Strength Index) – The RSI for XRP/USD is now below the 50 level.

Major Support Levels – $0.6020, $0.580, and $0.5450.

Major Resistance Levels – $0.610, $0.6220, and $0.6420.

XRP Price Near Crucial Juncture, Can Bulls Take A Stand?

XRP price is struggling below $0.620. The price must stay above the $0.5680 support to attempt a fresh increase in the near term.

  • XRP is slowly moving lower from the $0.6620 resistance zone.
  • The price is now trading below $0.620 and the 100 simple moving average (4 hours).
  • There is a major bearish trend line forming with resistance near $0.600 on the 4-hour chart of the XRP/USD pair (data source from Kraken).
  • The pair could gain bearish momentum if there is a close below the $0.5680 support.

XRP Price Faces Many Hurdles

In the past few sessions, XRP price saw a steady decline from well above the $0.650 level. There was a drop below the $0.620 and $0.605 support levels, like Bitcoin and Ethereum.

The price tested the $0.580 support. A low was formed near $0.5805 and the price is now consolidating losses. There is also a major bearish trend line forming with resistance near $0.600 on the 4-hour chart of the XRP/USD pair.

Ripple’s token price is now trading below $0.620 and the 100 simple moving average (4 hours). On the upside, immediate resistance is near the $0.600 zone and the trend line. It is close to the 23.6% Fib retracement level of the downward wave from the $0.6625 swing high to the $0.5805 low.

The next key resistance is near $0.620. It is close to the 50% Fib retracement level of the downward wave from the $0.6625 swing high to the $0.5805 low. A close above the $0.6250 resistance zone could spark a strong increase. The next key resistance is near $0.6620.

XRP Price

Source: XRPUSD on TradingView.com

If the bulls remain in action above the $0.6620 resistance level, there could be a rally toward the $0.680 resistance. Any more gains might send the price toward the $0.700 resistance.

More Losses?

If XRP fails to clear the $0.600 resistance zone, it could start another decline. Initial support on the downside is near the $0.580 zone.

The next major support is at $0.5680. If there is a downside break and a close below the $0.5680 level, the price might accelerate lower. In the stated case, the price could retest the $0.5250 support zone.

Technical Indicators

4-Hours MACD – The MACD for XRP/USD is now gaining pace in the bearish zone.

4-Hours RSI (Relative Strength Index) – The RSI for XRP/USD is now below the 50 level.

Major Support Levels – $0.580, $0.5680, and $0.5250.

Major Resistance Levels – $0.600, $0.6250, and $0.6620.

XRP Price Holds Support – Indicators Show Risk of Downside Break

XRP price is holding gains above the $0.60 zone. The price could gain bearish momentum if there is a close below the $0.570 support zone.

  • XRP is facing a major hurdle near the $0.6580 zone.
  • The price is now trading below $0.640 and the 100 simple moving average (4 hours).
  • There is a key bearish trend line forming with resistance near $0.640 on the 4-hour chart of the XRP/USD pair (data source from Kraken).
  • The pair could gain bearish momentum if there is a close below the $0.5720 support.

XRP Price Faces Uphill Task

After a steady decline, XRP price found support near the $0.5720 level. A low was formed at $0.5714 and the price started a fresh increase, like Bitcoin and Ethereum.

There was a move above the $0.5880 and $0.600 resistance levels. The price cleared the 23.6% Fib retracement level of the downward wave from the $0.7442 swing high to the $0.5714 low. The bulls pushed the price above the $0.620 resistance zone, but the bears are active near $0.640.

Ripple’s token price is now trading above $0.6320 and the 100 simple moving average (4 hours). On the upside, immediate resistance is near the $0.640 zone. There is also a key bearish trend line forming with resistance near $0.640 on the 4-hour chart of the XRP/USD pair.

XRP Price

The next key resistance is near $0.6580. It is close to the 50% Fib retracement level of the downward wave from the $0.7442 swing high to the $0.5714 low. A close above the $0.6580 resistance zone could spark a strong increase. The next key resistance is near $0.700. If the bulls remain in action above the $0.700 resistance level, there could be a rally toward the $0.7440 resistance. Any more gains might send the price toward the $0.800 resistance.

More Losses?

If XRP fails to clear the $0.640 resistance zone, it could start another decline. Initial support on the downside is near the $0.600 zone.

The next major support is at $0.5720. If there is a downside break and a close below the $0.5720 level, the price might accelerate lower. In the stated case, the price could retest the $0.5250 support zone.

Technical Indicators

4-Hours MACD – The MACD for XRP/USD is now losing pace in the bullish zone.

4-Hours RSI (Relative Strength Index) – The RSI for XRP/USD is now above the 50 level.

Major Support Levels – $0.600, $0.5720, and $0.5250.

Major Resistance Levels – $0.640, $0.6580, and $0.700.

XRP Price Prediction: Can Bulls Pump It Again To $0.75

XRP price found support at $0.5685 and started a fresh increase. The bulls could gain strength if they manage to push the price above $0.6560.

  • XRP found is attempting a fresh increase from the $0.5680 support zone.
  • The price is now trading above $0.630 and the 100 simple moving average (4 hours).
  • There is a key bullish trend line forming with support near $0.6440 on the 4-hour chart of the XRP/USD pair (data source from Kraken).
  • The pair could start a fresh rally if there is a close above the $0.6560 resistance zone.

XRP Price Eyes Fresh Surge

After a major decline, XRP price found support near the $0.5685 level. A low was formed at $0.5685 and the price started a fresh increase, like Bitcoin and Ethereum.

There was a move above the $0.5850 and $0.600 resistance levels. The price cleared the 23.6% Fib retracement level of the downward wave from the $0.7442 swing high to the $0.5686 low. The bulls pushed the price above the $0.640 resistance zone.

Ripple’s token price is now trading above $0.630 and the 100 simple moving average (4 hours). On the upside, immediate resistance is near the $0.6560 zone. It is close to the 50% Fib retracement level of the downward wave from the $0.7442 swing high to the $0.5686 low.

XRP Price Prediction

Source: XRPUSD on TradingView.com

The first key resistance is near $0.700, above which the price could rise toward the $0.7320 resistance. A close above the $0.7320 resistance zone could spark a strong increase. The next key resistance is near $0.7440. If the bulls remain in action above the $0.7440 resistance level, there could be a rally toward the $0.800 resistance. Any more gains might send the price toward the $0.820 resistance.

Another Drop?

If XRP fails to clear the $0.6560 resistance zone, it could start another decline. Initial support on the downside is near the $0.640 zone and the trend line.

The next major support is at $0.620. If there is a downside break and a close below the $0.620 level, the price might accelerate lower. In the stated case, the price could retest the $0.5685 support zone.

Technical Indicators

4-Hours MACD – The MACD for XRP/USD is now losing pace in the bullish zone.

4-Hours RSI (Relative Strength Index) – The RSI for XRP/USD is now above the 50 level.

Major Support Levels – $0.640, $0.620, and $0.5685.

Major Resistance Levels – $0.6560, $0.700, and $0.7440.

XRP Price Prediction: Bulls Aim For Fresh Surge To $0.70

XRP price found support at $0.5680 and started a fresh increase. The bulls are now aiming for a move toward the $0.700 resistance.

  • XRP found support near $0.5680 and started a recovery wave above $0.60.
  • The price is now trading above $0.620 and the 100 simple moving average (4 hours).
  • There was a break above a key bearish trend line with resistance at $0.610 on the 4-hour chart of the XRP/USD pair (data source from Kraken).
  • The pair could start a fresh rally if there is a close above the $0.6560 resistance zone.

XRP Price Regains Traction

After a major decline, XRP price found support near the $0.5680 zone. A low was formed at $0.5684 and the price started a fresh increase, like Bitcoin and Ethereum.

There was a move above the $0.580 and $0.600 resistance levels. The price cleared the 23.6% Fib retracement level of the downward move from the $0.7440 swing high to the $0.5684 low. There was also a break above a key bearish trend line with resistance at $0.610 on the 4-hour chart of the XRP/USD pair.

Ripple’s token price is now trading above $0.620 and the 100 simple moving average (4 hours). On the upside, immediate resistance is near the $0.6560 zone. It is close to the 50% Fib retracement level of the downward move from the $0.7440 swing high to the $0.5684 low.

XRP Price Prediction

Source: XRPUSD on TradingView.com

The first key resistance is near $0.700, above which the price could rise toward the $0.7440 resistance. A close above the $0.7440 resistance zone could spark a strong increase. The next key resistance is near $0.7650. If the bulls remain in action above the $0.7650 resistance level, there could be a rally toward the $0.800 resistance. Any more gains might send the price toward the $0.820 resistance.

Another Decline?

If XRP fails to clear the $0.6560 resistance zone, it could start another decline. Initial support on the downside is near the $0.630 zone.

The next major support is at $0.600. If there is a downside break and a close below the $0.600 level, the price might accelerate lower. In the stated case, the price could retest the $0.5680 support zone.

Technical Indicators

4-Hours MACD – The MACD for XRP/USD is now losing pace in the bullish zone.

4-Hours RSI (Relative Strength Index) – The RSI for XRP/USD is now above the 50 level.

Major Support Levels – $0.630, $0.600, and $0.5680.

Major Resistance Levels – $0.6560, $0.700, and $0.7440.

XRP Price Prediction: Can Bulls Defend This Key Support?

XRP price started a downside correction from the $0.7450 resistance. The bulls are now struggling to keep the price above the $0.5850 support zone.

  • XRP started a fresh decline after it failed to clear the $0.7450 resistance.
  • The price is now trading below $0.650 and the 100 simple moving average (4 hours).
  • There is a key bearish trend line forming with resistance at $0.640 on the 4-hour chart of the XRP/USD pair (data source from Kraken).
  • The pair could start a fresh rally if there is a close above the $0.6650 resistance zone.

XRP Price Trims Gains

After a steady increase, XRP price struggled to extend gains above the $0.750 resistance. The price started a downside correction from the $0.7442 high, like Ethereum and Bitcoin.

There was a steady decline below the $0.700 and $0.665 support levels. The price even declined below the $0.600 support. A low was formed near $0.5874 and the price is now consolidating losses. There was a minor increase above the $0.620 level.

The price spiked above the 23.6% Fib retracement level of the downward move from the $0.7442 swing high to the $0.5874 low. However, the bears were active near $0.650. There is also a key bearish trend line forming with resistance at $0.640 on the 4-hour chart of the XRP/USD pair.

Ripple’s token price is now trading below $0.620 and the 100 simple moving average (4 hours). On the upside, immediate resistance is near the $0.640 zone. The first key resistance is near $0.6650 or the 50% Fib retracement level of the downward move from the $0.7442 swing high to the $0.5874 low, above which the price could rise toward the $0.70 resistance.

XRP Price Prediction

Source: XRPUSD on TradingView.com

A close above the $0.70 resistance zone could spark a strong increase. The next key resistance is near $0.7450. If the bulls remain in action above the $0.7450 resistance level, there could be a rally toward the $0.800 resistance. Any more gains might send the price toward the $0.820 resistance.

More Losses?

If XRP fails to clear the $0.6650 resistance zone, it could start another decline. Initial support on the downside is near the $0.5980 zone.

The next major support is at $0.5850. If there is a downside break and a close below the $0.5850 level, the price might accelerate lower. In the stated case, the price could retest the $0.520 support zone.

Technical Indicators

4-Hours MACD – The MACD for XRP/USD is now gaining pace in the bearish zone.

4-Hours RSI (Relative Strength Index) – The RSI for XRP/USD is now below the 50 level.

Major Support Levels – $0.5980, $0.5850, and $0.5200.

Major Resistance Levels – $0.640, $0.6650, and $0.700.

XRP Price Prediction: Rally Could Soon Extend To $0.85

XRP price started a fresh rally above the $0.6400 resistance. The bulls are now active above $0.680 and might aim for a move toward $0.800 or even $0.850.

  • XRP started a fresh increase above the $0.640 resistance level.
  • The price is now trading above $0.670 and the 100 simple moving average (4 hours).
  • There is a key bullish trend line forming with support near $0.660 on the 4-hour chart of the XRP/USD pair (data source from Kraken).
  • The pair could start a fresh rally if there is a close above the $0.720 resistance zone.

XRP Price Jumps Over 15%

In the past few days, XRP price climbed higher from the $0.530 zone. There was a move above the $0.580 and $0.600 resistance levels. Yesterday, it pumped over 15%, cleared the $0.650 resistance, and outperformed both Ethereum and Bitcoin.

A high was formed at $0.7442 and the price is now consolidating gains. There was a minor decline below the $0.720 level. The price dipped below the 23.6% Fib retracement level of the upward move from the $0.530 swing low to the $0.7442 high.

Ripple’s token price is now trading above $0.660 and the 100 simple moving average (4 hours). There is also a key bullish trend line forming with support near $0.660 on the 4-hour chart of the XRP/USD pair.

On the upside, immediate resistance is near the $0.720 zone. The first key resistance is near $0.7440, above which the price could rise toward the $0.7850 resistance. A close above the $0.7850 resistance zone could spark a strong increase.

XRP Price Prediction

Source: XRPUSD on TradingView.com

The next key resistance is near $0.80. If the bulls remain in action above the $0.80 resistance level, there could be a rally toward the $0.850 resistance. Any more gains might send the price toward the $0.880 resistance.

Another Decline?

If XRP fails to clear the $0.720 resistance zone, it could start another decline. Initial support on the downside is near the $0.660 zone and the trend line.

The next major support is at $0.6350 or the 50% Fib retracement level of the upward move from the $0.530 swing low to the $0.7442 high. If there is a downside break and a close below the $0.6350 level, the price might accelerate lower. In the stated case, the price could retest the $0.600 support zone.

Technical Indicators

4-Hours MACD – The MACD for XRP/USD is now losing pace in the bullish zone.

4-Hours RSI (Relative Strength Index) – The RSI for XRP/USD is now above the 50 level.

Major Support Levels – $0.6600, $0.6350, and $0.600.

Major Resistance Levels – $0.720, $0.7440, and $0.800.

XRP Price Prediction: Dips Turn Attractive In Near Term As Bulls Lose Control

XRP price started a downside correction from the $0.6700 resistance. The bulls are now active above $0.5400 and might aim for a fresh increase.

  • XRP started a fresh increase above the $0.600 resistance level.
  • The price is now trading above $0.550 and the 100 simple moving average (4 hours).
  • There was a break below a key rising channel with support at $0.610 on the 4-hour chart of the XRP/USD pair (data source from Kraken).
  • The pair could start a fresh rally if there is a close above the $0.60 resistance zone.

XRP Price Revisits Support

In the past few days, XRP price climbed higher from the $0.550 zone. There was a move above the $0.580 and $0.600 resistance levels. However, the upside was less compared to Bitcoin and Ethereum.

The price even climbed above the $0.650 resistance before the bears appeared. A new multi-week high was formed near $0.6692 before the price dived. There was a strong bearish wave below the $0.620 support. There was a break below a key rising channel with support at $0.610 on the 4-hour chart of the XRP/USD pair.

The pair even dived below the $0.600 level. A low was formed near $0.530 and the price is now attempting a fresh increase. There was a move above the $0.560 level and the 23.6% Fib retracement level of the downward move from the $0.6692 swing high to the $0.530 low.

Ripple’s token price is now trading above $0.550 and the 100 simple moving average (4 hours). On the upside, immediate resistance is near the $0.600 zone or the 50% Fib retracement level of the downward move from the $0.6692 swing high to the $0.530 low.

The first key resistance is near $0.6240, above which the price could rise toward the $0.650 resistance. A close above the $0.650 resistance zone could spark a strong increase.

XRP Price

Source: XRPUSD on TradingView.com

The next key resistance is near $0.680. If the bulls remain in action above the $0.680 resistance level, there could be a rally toward the $0.7050 resistance. Any more gains might send the price toward the $0.7320 resistance.

Another Decline?

If XRP fails to clear the $0.60 resistance zone, it could start another decline. Initial support on the downside is near the $0.562 zone.

The next major support is at $0.540 and a connecting bullish trend line. If there is a downside break and a close below the $0.540 level, the price might accelerate lower. In the stated case, the price could retest the $0.5120 support zone.

Technical Indicators

4-Hours MACD – The MACD for XRP/USD is now losing pace in the bullish zone.

4-Hours RSI (Relative Strength Index) – The RSI for XRP/USD is now below the 50 level.

Major Support Levels – $0.5620, $0.540, and $0.5120.

Major Resistance Levels – $0.600, $0.6240, and $0.650.

XRP Price Prediction: Momentum Reignites As Bulls Aim For $0.75

XRP price is gaining pace above the $0.550 resistance. The bulls seem to be aiming for a move above the $0.60 and $0.62 resistance levels.

  • XRP started a fresh increase above the $0.550 resistance level.
  • The price is now trading above $0.575 and the 100 simple moving average (4 hours).
  • There was a break above a major contracting triangle with resistance at $0.560 on the 4-hour chart of the XRP/USD pair (data source from Kraken).
  • The pair could start a fresh rally if there is a close above the $0.60 resistance zone.

XRP Price Restarts Increase

In the past few days, XRP price recovered higher from the $0.530 zone. There was a move above the $0.545 and $0.550 resistance levels. However, the upside was less compared to Bitcoin and Ethereum.

There was a break above a major contracting triangle with resistance at $0.560 on the 4-hour chart of the XRP/USD pair. The pair traded as high as $0.5971, and it is currently consolidating gains. It tested the 23.6% Fib retracement level of the upward move from the $0.5290 swing low to the $0.5971 high.

Ripple’s token price is now trading above $0.575 and the 100 simple moving average (4 hours). On the upside, immediate resistance is near the $0.580 zone. The first key resistance is near $0.600, above which the price could rise toward the $0.620 resistance. A close above the $0.620 resistance zone could spark a strong increase.

XRP Price Prediction

Source: XRPUSD on TradingView.com

The next key resistance is near $0.650. If the bulls remain in action above the $0.650 resistance level, there could be a rally toward the $0.685 resistance. Any more gains might send the price toward the $0.70 resistance.

Another Decline?

If XRP fails to clear the $0.60 resistance zone, it could start another decline. Initial support on the downside is near the $0.575 zone.

The next major support is at $0.5630 or the 50% Fib retracement level of the upward move from the $0.5290 swing low to the $0.5971 high. If there is a downside break and a close below the $0.5630 level, the price might accelerate lower. In the stated case, the price could retest the $0.5350 support zone.

Technical Indicators

4-Hours MACD – The MACD for XRP/USD is now losing pace in the bullish zone.

4-Hours RSI (Relative Strength Index) – The RSI for XRP/USD is now above the 60 level.

Major Support Levels – $0.575, $0.563, and $0.5350.

Major Resistance Levels – $0.5950, $0.600, and $0.620.

XRP Price Prediction: Bulls Take Hit But This Level Could Trigger Another Increase

XRP price started a downside correction from the $0.580 resistance. The price could start a fresh rally unless there is a close below the $0.535 support.

  • XRP is struggling to clear the $0.5650 and $0.580 resistance levels.
  • The price is now trading above $0.535 and the 100 simple moving average (4 hours).
  • There is a key bullish trend line forming with support at $0.5350 on the 4-hour chart of the XRP/USD pair (data source from Kraken).
  • The pair could start a fresh rally unless there is a close below the $0.535 support.

XRP Price Dips To Key Support

In the past few days, XRP price recovered higher from the $0.520 zone. There was a move above the $0.535 and $0.550 resistance levels. However, the bears remained active near the $0.580 resistance and protected more upsides, like Bitcoin and Ethereum.

The recent high was formed at $0.5792 before there was a downside correction. There was a move below the $0.550 level. The price even tested the $0.535 support. A low is formed near $0.5322 and the price is now consolidating losses.

Ripple’s token price is now trading above $0.535 and the 100 simple moving average (4 hours). There is also a key bullish trend line forming with support at $0.5350 on the 4-hour chart of the XRP/USD pair. On the upside, immediate resistance is near the $0.5550 zone. It is close to the 50% Fib retracement level of the downward move from the $0.5793 swing high to the $0.5322 low.

The first key resistance is near $0.5620 or the 61.8% Fib retracement level of the downward move from the $0.5793 swing high to the $0.5322 low, above which the price could rise toward the $0.580 resistance. A close above the $0.580 resistance zone could spark a strong increase.

XRP Price Prediction

Source: XRPUSD on TradingView.com

The next key resistance is near $0.600. If the bulls remain in action above the $0.600 resistance level, there could be a rally toward the $0.620 resistance. Any more gains might send the price toward the $0.650 resistance.

Another Decline?

If XRP fails to clear the $0.5550 resistance zone, it could start another decline. Initial support on the downside is near the $0.535 zone and the trend line.

The next major support is at $0.5220. If there is a downside break and a close below the $0.5220 level, the price might accelerate lower. In the stated case, the price could retest the $0.480 support zone.

Technical Indicators

4-Hours MACD – The MACD for XRP/USD is now losing pace in the bearish zone.

4-Hours RSI (Relative Strength Index) – The RSI for XRP/USD is now below the 50 level.

Major Support Levels – $0.535, $0.522, and $0.480.

Major Resistance Levels – $0.555, $0.565, and $0.580.

XRP Price Prediction: A Fresh Rally Is Around The Corner?

XRP price is consolidating below the $0.538 resistance. The price could start a fresh rally if it clears the $0.5380 and $0.5500 resistance levels.

  • XRP is struggling to clear the $0.5350 and $0.5380 resistance levels.
  • The price is now trading above $0.520 and the 100 simple moving average (4 hours).
  • There is a key bullish trend line forming with support at $0.5170 on the 4-hour chart of the XRP/USD pair (data source from Kraken).
  • The pair could start a fresh rally if it clears the $0.5380 and $0.5500 resistance levels.

XRP Price Eyes Fresh Rally

In the past few days, XRP price recovered higher from the $0.4980 zone. There was a move above the $0.505 and $0.5120 resistance levels. However, the bears remained active near the $0.5380 resistance and protected more upsides, unlike Bitcoin and Ethereum.

The recent high was formed at $0.5375 before there was a downside correction. There was a move below the $0.5220 level. The price even spiked below the 50% Fib retracement level of the upward move from the $0.4980 swing low to the $0.5375 high.

Ripple’s token price is now trading above $0.520 and the 100 simple moving average (4 hours). There is also a key bullish trend line forming with support at $0.5170 on the 4-hour chart of the XRP/USD pair. On the upside, immediate resistance is near the $0.5300 zone.

XRP Price

Source: XRPUSD on TradingView.com

The first key resistance is near $0.5380, above which the price could rise toward the $0.550 resistance. A close above the $0.550 resistance zone could spark a strong increase. The next key resistance is near $0.5850. If the bulls remain in action above the $0.5850 resistance level, there could be a rally toward the $0.600 resistance. Any more gains might send the price toward the $0.620 resistance.

Another Decline?

If XRP fails to clear the $0.5380 resistance zone, it could start another decline. Initial support on the downside is near the $0.518 zone and the trend line.

The next major support is at $0.5120. If there is a downside break and a close below the $0.5120 level, the price might accelerate lower. In the stated case, the price could retest the $0.480 support zone.

Technical Indicators

4-Hours MACD – The MACD for XRP/USD is now losing pace in the bearish zone.

4-Hours RSI (Relative Strength Index) – The RSI for XRP/USD is now near the 50 level.

Major Support Levels – $0.517, $0.512, and $0.480.

Major Resistance Levels – $0.530, $0.538, and $0.550.

XRP Price At Make-Or-Break Moment, Key Levels To Watch

XRP price is struggling to clear the $0.520 resistance. The price could gain bearish momentum if there is a close below the $0.4850 support.

  • XRP is showing bearish signs below the $0.520 and $0.508 resistance levels.
  • The price is now trading below $0.520 and the 100 simple moving average (4 hours).
  • There is a connecting bearish trend line forming with resistance near $0.5120 on the 4-hour chart of the XRP/USD pair (data source from Kraken).
  • The pair is now at risk of more downsides below the $0.5000 support zone.

XRP Price Faces Many Hurdles

In the past few days, XRP price saw a downside reaction below the $0.550 pivot level. The bears remained active and were able to push the price below the $0.500 support zone.

Recently, there was a recovery wave above the $0.500 level. The bulls pushed the price above the 50% Fib retracement level of the downward wave from the $0.5390 swing high to the $0.4850 low. However, the bears were active near the $0.525 resistance.

Ripple’s token failed to clear the 76.4% Fib retracement level of the downward wave from the $0.5390 swing high to the $0.4850 low. XRP is now trading in a bearish zone below $0.508 and the 100 simple moving average (4 hours), unlike Bitcoin and Ethereum.

On the upside, immediate resistance is near the $0.512 zone. There is also a connecting bearish trend line forming with resistance near $0.5120 on the 4-hour chart of the XRP/USD pair. The first key resistance is near $0.520, above which the price could rise toward the $0.5320 resistance.

XRP Price

Source: XRPUSD on TradingView.com

A close above the $0.5320 resistance zone could spark a strong increase. The next key resistance is near $0.5550. If the bulls remain in action above the $0.5550 resistance level, there could be a rally toward the $0.5840 resistance. Any more gains might send the price toward the $0.6000 resistance.

More Downsides?

If XRP fails to clear the $0.5120 resistance zone, it could continue to move down. Initial support on the downside is near the $0.500 zone.

The next major support is at $0.485. If there is a downside break and a close below the $0.485 level, the price might accelerate lower. In the stated case, the price could retest the $0.450 support zone.

Technical Indicators

4-Hours MACD – The MACD for XRP/USD is now gaining pace in the bearish zone.

4-Hours RSI (Relative Strength Index) – The RSI for XRP/USD is now below the 50 level.

Major Support Levels – $0.500, $0.485, and $0.450.

Major Resistance Levels – $0.512, $0.520, and $0.532.

XRP Price Turns Red As Risk of More Downsides Escalate

XRP price is moving lower below the $0.5200 support. The price could gain bearish momentum if there is a close below the $0.50 support.

  • XRP is showing bearish signs below the $0.525 and $0.512 resistance levels.
  • The price is now trading below $0.520 and the 100 simple moving average (4 hours).
  • There was a break below a key contracting triangle with support at $0.5220 on the 4-hour chart of the XRP/USD pair (data source from Kraken).
  • The pair is now at risk of more downsides below the $0.5000 support zone.

XRP Price Takes Hit

In the past few days, XRP price heavy bearish moves below the $0.550 support. The bears remained active near the $0.5500 resistance and protected a recovery wave, unlike Bitcoin and Ethereum.

There was a fresh decline from the $0.5389 high and the bears pushed the price below $0.5200. There was a steady decline and there was a break below a key contracting triangle with support at $0.5220 on the 4-hour chart of the XRP/USD pair.

The price is now trading below $0.520 and the 100 simple moving average (4 hours). A low is formed near $0.5012, and the price is now consolidating losses. On the upside, immediate resistance is near the $0.520 zone. It is near the 50% Fib retracement level of the downward wave from the $0.5389 swing high to the $0.5012 low.

The first key resistance is near $0.530 or the 76.4% Fib retracement level of the downward wave from the $0.5389 swing high to the $0.5012 low, above which the price could rise toward the $0.5380 resistance.

XRP Price

Source: XRPUSD on TradingView.com

A close above the $0.5380 resistance zone could spark a strong increase. The next key resistance is near $0.5550. If the bulls remain in action above the $0.5550 resistance level, there could be a rally toward the $0.5800 resistance. Any more gains might send the price toward the $0.6000 resistance.

Key Downside Break?

If XRP fails to clear the $0.5200 resistance zone, it could continue to move down. Initial support on the downside is near the $0.502 zone.

The next major support is at $0.500. If there is a downside break and a close below the $0.500 level, XRP price might accelerate lower. In the stated case, the price could retest the $0.450 support zone.

Technical Indicators

4-Hours MACD – The MACD for XRP/USD is now gaining pace in the bearish zone.

4-Hours RSI (Relative Strength Index) – The RSI for XRP/USD is now below the 50 level.

Major Support Levels – $0.505, $0.500, and $0.450.

Major Resistance Levels – $0.520, $0.538, and $0.550.

XRP Price Takes Hit, Can Buyers Save The Key $0.50 Support?

XRP price is consolidating above the $0.50 support. The price could gain bearish momentum if there is a close below the $0.50 support.

  • XRP is showing bearish signs below the $0.525 and $0.550 resistance levels.
  • The price is now trading below $0.525 and the 100 simple moving average (4 hours).
  • There is a connecting bearish trend line forming with resistance near $0.520 on the 4-hour chart of the XRP/USD pair (data source from Kraken).
  • The pair start a fresh increase if it clears the $0.520 and $0.525 resistance levels.

XRP Price Revisits Key Support

In the past few days, XRP price saw a fresh decline below the $0.550 support. The bears were able to push the price into a short-term bearish zone below $0.525, like Bitcoin and Ethereum.

The price even spiked below the $0.500 support. A low was formed near $0.4961, and the price is now consolidating losses. It is back above the $0.500 level and showing signs of a minor recovery wave. It is now trading below $0.525 and the 100 simple moving average (4 hours).

On the upside, immediate resistance is near the $0.520 zone. There is also a connecting bearish trend line forming with resistance near $0.520 on the 4-hour chart of the XRP/USD pair. The trend line is close to the 23.6% Fib retracement level of the downward wave from the $0.6240 swing high to the $0.4960 low.

The first key resistance is near $0.532, above which the price could rise toward the $0.560 resistance. It is close to the 50% Fib retracement level of the downward wave from the $0.6240 swing high to the $0.4960 low.

XRP Price

Source: XRPUSD on TradingView.com

A close above the $0.560 resistance zone could spark a strong increase. The next key resistance is near $0.594. If the bulls remain in action above the $0.594 resistance level, there could be a rally toward the $0.620 resistance. Any more gains might send the price toward the $0.650 resistance.

Another Drop?

If XRP fails to clear the $0.525 resistance zone, it could start a fresh decline. Initial support on the downside is near the $0.500 zone.

The next major support is at $0.495. If there is a downside break and a close below the $0.495 level, XRP price might accelerate lower. In the stated case, the price could retest the $0.450 support zone.

Technical Indicators

4-Hours MACD – The MACD for XRP/USD is now losing pace in the bearish zone.

4-Hours RSI (Relative Strength Index) – The RSI for XRP/USD is now below the 50 level.

Major Support Levels – $0.500, $0.495, and $0.450.

Major Resistance Levels – $0.520, $0.525, and $0.560.