RSI Records Major Golden Cross: XRP Predicted To Cross The $1 Mark In 16 Days

Crypto analyst Crypto Insight recently predicted that the price of XRP could be preparing to go past the $1 mark in just 16 days as the XRP’s Relative Strength Index (RSI) and open interest continue to gain momentum indicating a bullish trend.

XRP Weekly Relative Strength Index 

On Sunday, October 29, the crypto analyst shared his predictions on X (formerly Twitter) highlighting that XRP might be prepared for a significant upward trajectory due to the strength of the XRP’s weekly RSI, as it gains traction toward entering a bullish zone.

Related Reading: XRP Price To Go Parabolic, Here’s When

This is because the momentum of an asset’s price movement is measured by the Relative Strength Index (RSI). There are two indicator feature lines in the RSI chart and these include the RSI line (purple) and the RSI-Based MA line (yellow).

In the RSI chart, an indication of rising momentum and a bullish cross is produced whenever the RSI line crosses above the RSI-based MA line; as seen in the XRP weekly chart posted by Crypto Insight on X.

XRP experienced the cross for the first time in the first week of July, and after this happened, the cryptocurrency experienced a great surge in price by July 13, which led to XRP’s yearly high of $0.93. However, during the correction that followed, the RSI line fell below the RSI-based MA line.

According to crypto insight, the line is once again attempting to traverse above the RSI-based MA line as of the time of his discovery, and the crossing has been realized. As of the time of his revelation, the RSI line was sitting at 53.91, while the RSI-based MA line was sitting at 51.01 presenting a bullish sign.

The crypto analyst further shed more light on the timing for these potential developments. Crypto Insight speculated that XRP might be touching a resistance level as of the time of his disclosure, and the resistance level could be a vital point for XRP price movement.

XRP XRPUSDT

He also added that a bullish cross for the RSI could buttress both bulls and punters to engage in the market and stake their bets. Notably, this surge in trading activity could provide XRP with the force it needs to swiftly break out into the target range.

Related Reading: XRP Price Could Blast Off In 18 Days, Here’s Why

So far, the target range that was set up by the crypto analyst in his chart was between $0.8875 to $1.3617. He believes that XRP could hit this price range in the next 16 days since the rally in July, saw the XRP price almost claiming the $1 mark, but failed due to the significant resistance it faced.

The crypto analyst also pointed out the XRP’s open interest in his projections. He highlighted that open interest has room to rise significantly, and it seems to be developing higher highs.

Open Interest is the overall number of pending futures contracts for a particular cryptocurrency. Therefore, an increase in open interest can indicate growing market participation and keenness among investors, and it can also lead to increased liquidity and potentially trigger a price rally for a cryptocurrency.
XRP Price Prediction: Rally Gathers Pace, $0.55 Target In Sight

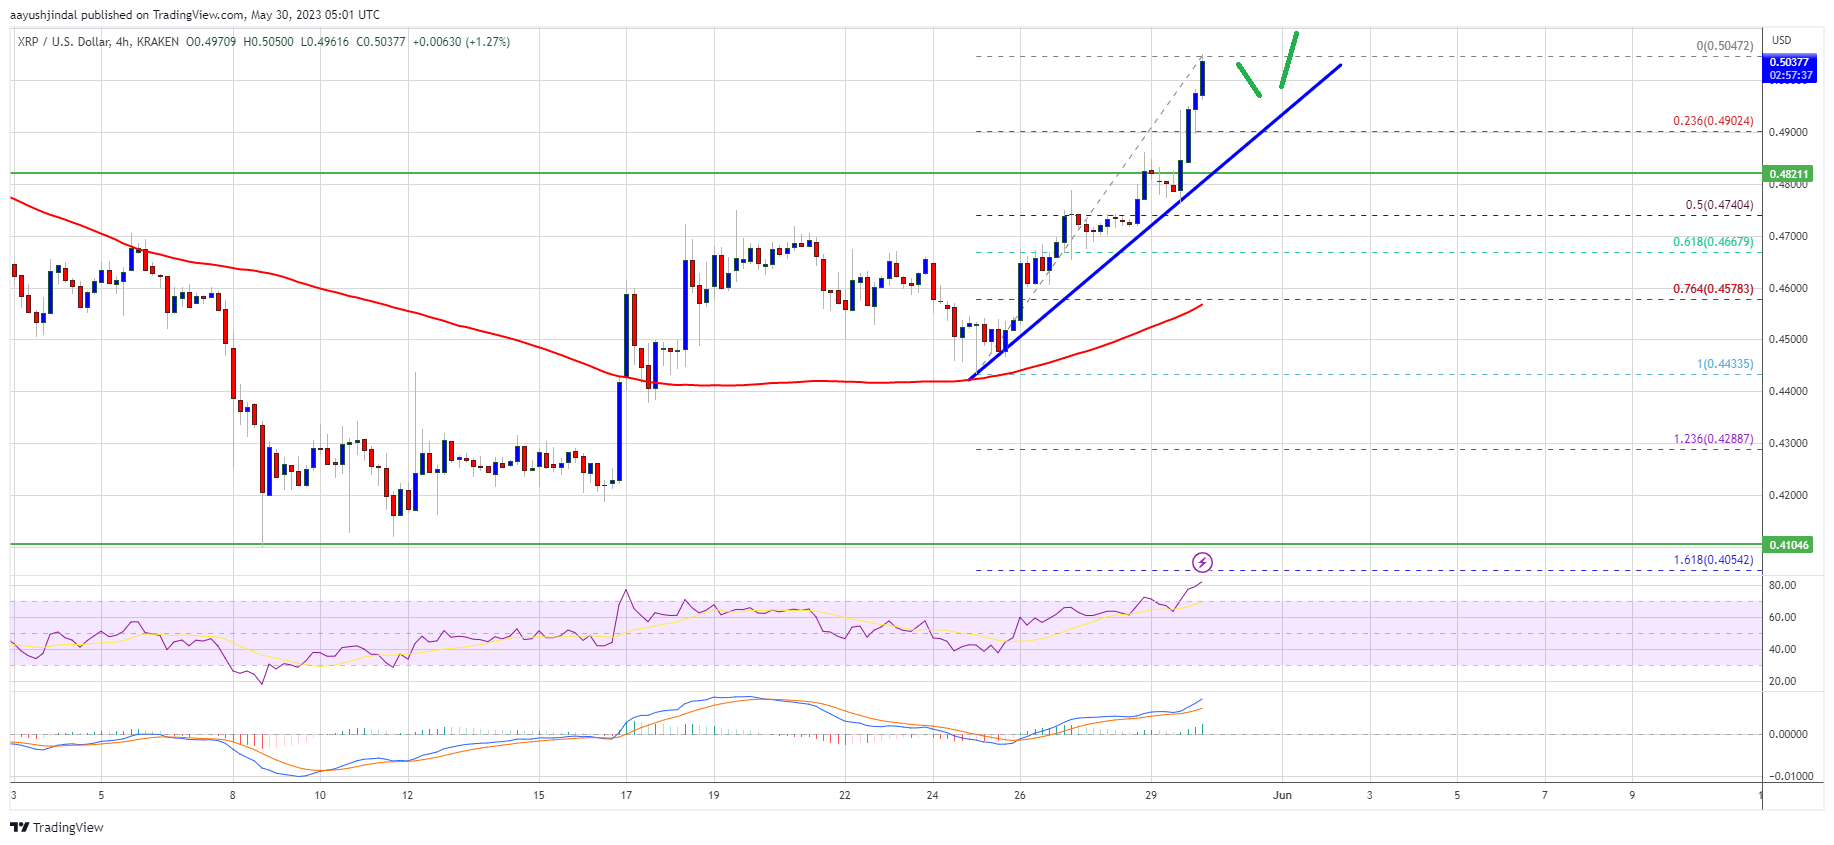
Ripple’s token price is rising above the $0.50 resistance against the US Dollar. XRP price might continue to rise toward the $0.525 and $0.550 resistance levels.

  • Ripple’s token price started a fresh increase above the $0.480 resistance against the US dollar.
  • The price is now trading above $0.50 and the 100 simple moving average (4 hours).
  • There is a key bullish trend line forming with support near $0.4910 on the 4-hour chart of the XRP/USD pair (data source from Kraken).
  • The pair might continue to rise toward the $0.525 and $0.550 resistance levels.

Ripple’s Token Price Rallies 5%

In the past few days, Ripple’s XRP saw a decent increase from the $0.420 support against the US Dollar. It outperformed Bitcoin and Ethereum to move into a bullish zone.

There was a clear move above the $0.475 and $0.480 resistance levels. It even surpassed $0.500. A high is formed near $0.5047 and the price is now consolidating gains. It is trading above the 23.6% Fib retracement level of the upward move from the $0.4433 swing low to the $0.5047 high.

XRP price is also trading above $0.50 and the 100 simple moving average (4 hours). Besides, there is a key bullish trend line forming with support near $0.4910 on the 4-hour chart of the XRP/USD pair.

XRP Price Prediction

Source: XRPUSD on TradingView.com

Initial resistance is near the $0.5050 zone. The first major resistance is near the $0.525 level. A successful break above the $0.525 resistance level might send the price toward the $0.550 resistance. Any more gains might call for a test of the $0.585 resistance.

Are Dips Limited in XRP?

If ripple fails to clear the $0.505 resistance zone, it could start a downside correction. Initial support on the downside is near the $0.491 zone and the trend line.

The next major support is near $0.474 or the 50% Fib retracement level of the upward move from the $0.4433 swing low to the $0.5047 high. If there is a downside break and a close below the $0.474 level, XRP’s price could extend losses. In the stated case, the price could test the $0.450 support zone.

Technical Indicators

4-Hours MACD – The MACD for XRP/USD is now gaining pace in the bullish zone.

4-Hours RSI (Relative Strength Index) – The RSI for XRP/USD is now in the overbought zone.

Major Support Levels – $0.491, $0.474, and $0.450.

Major Resistance Levels – $0.505, $0.525, and $0.550.

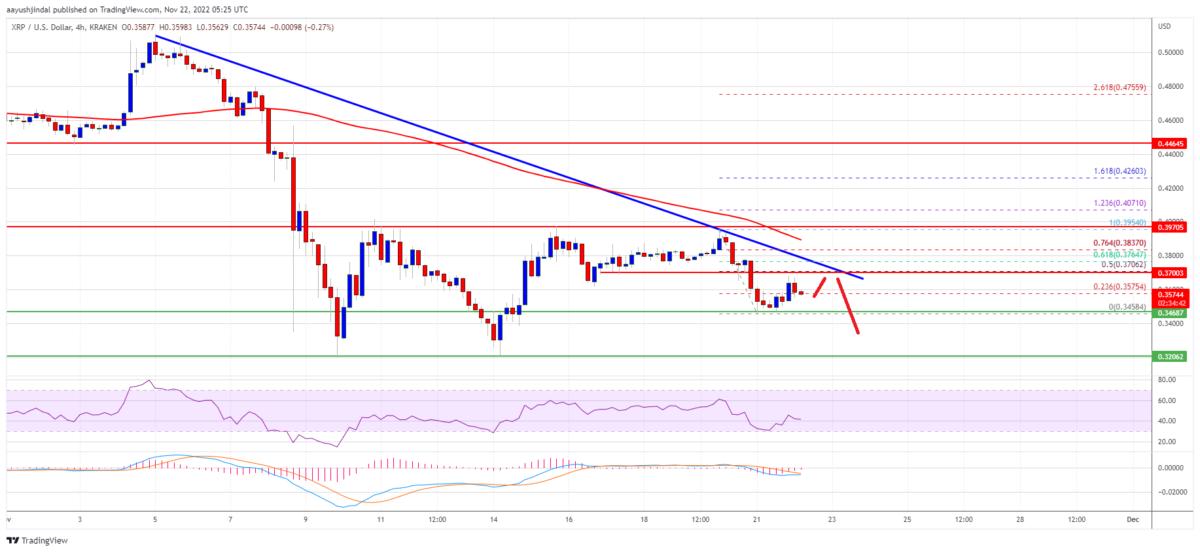
XRP Price Prediction: Ripple Plunges to $0.42: Can Bulls Save the Day?

Ripple is gaining bearish momentum below $0.45 against the US Dollar. XRP price is at risk of more losses if it breaks the $0.40 support.

  • Ripple started a fresh decline from the $0.470 zone against the US dollar.
  • The price is now trading below $0.450 and the 100 simple moving average (4 hours).
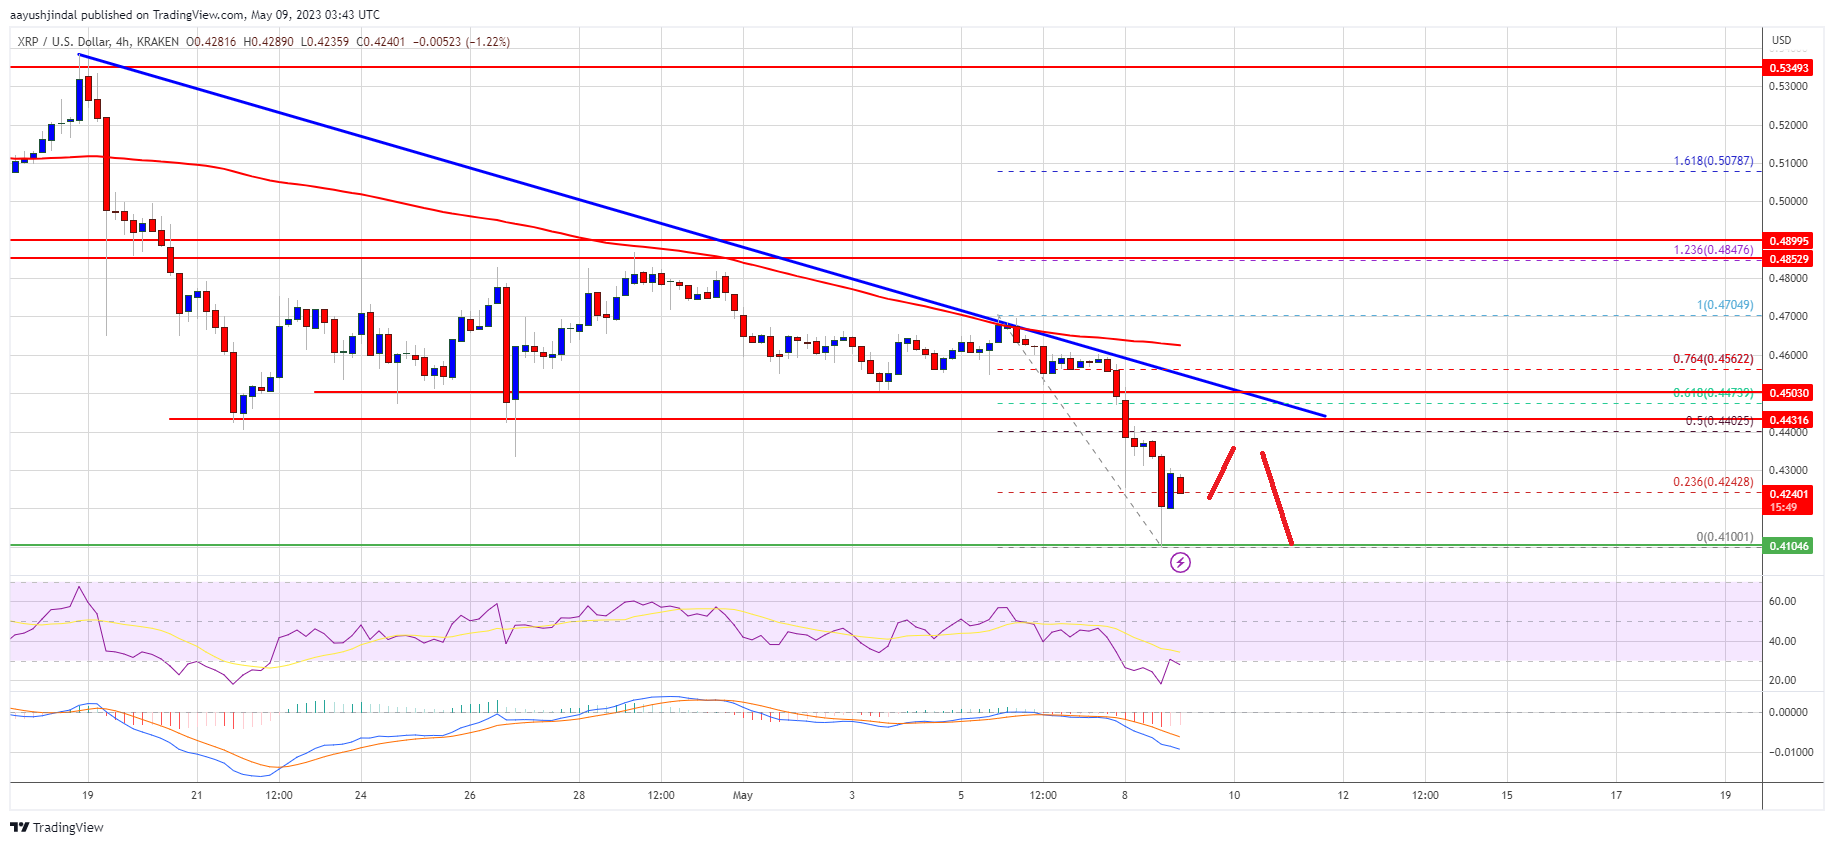
  • There is a connecting bearish trend line forming with resistance near $0.450 on the 4-hour chart of the XRP/USD pair (data source from Kraken).
  • The pair might decline further if it stays below the $0.445 and $0.450 resistance levels.

Ripple Price Breaks Support

This past week, Ripple’s XRP attempted a fresh increase above the $0.465 level against the US Dollar. However, the bears remained active near the $0.47 level. A high was formed near $0.4704 and the price declined, similar to Bitcoin and Ethereum.

There was a clear move below the $0.450 and $0.445 support levels. A low is formed near $0.4100 and the price is now consolidating losses. It is trading below $0.450 and the 100 simple moving average (4 hours). There is also a connecting bearish trend line forming with resistance near $0.450 on the 4-hour chart of the XRP/USD pair.

Initial resistance is near the $0.440 zone. It is close to the 50% Fib retracement level of the recent decline from the $0.4704 swing high to the $0.4100 low.

XRP Price Prediction

Source: XRPUSD on TradingView.com

The first major resistance is near the $0.450 level and the trend line. The 61.8% Fib retracement level of the recent decline from the $0.4704 swing high to the $0.4100 low is also near the trend line. A successful break above the $0.445 and $0.450 resistance levels might send the price toward the $0.470 resistance. Any more gains might call for a test of the $0.535 resistance.

More Losses in XRP?

If ripple fails to clear the $0.450 resistance zone, it could continue to move down. Initial support on the downside is near the $0.410 zone.

The next major support is near $0.40. If there is a downside break and a close below the $0.40 level, XRP’s price could extend losses. In the stated case, the price could test the $0.380 support zone.

Technical Indicators

4-Hours MACD – The MACD for XRP/USD is now gaining pace in the bearish zone.

4-Hours RSI (Relative Strength Index) – The RSI for XRP/USD is now below the 50 level.

Major Support Levels – $0.410, $0.400, and $0.380.

Major Resistance Levels – $0.445, $0.450, and $0.470.

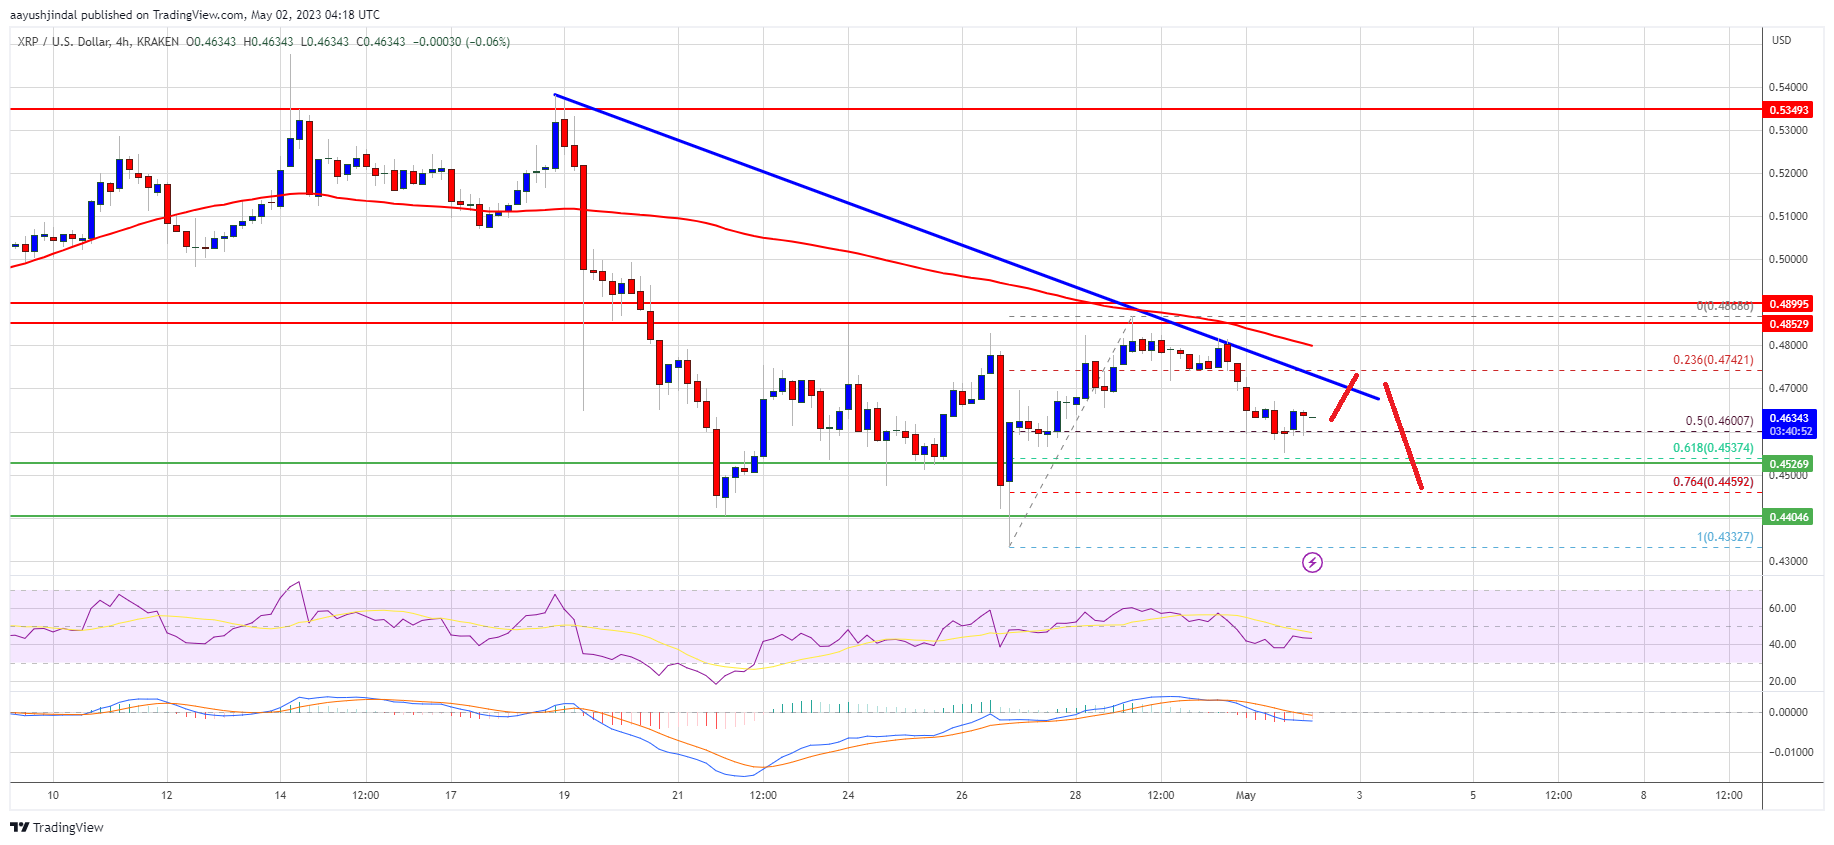
XRP Price Prediction: Ripple Bears Target Fresh Lows As Sentiment Dips

Ripple is struggling to recover above the $0.48 resistance against the US Dollar. XRP price could extend losses if there is a close below the $0.44 support.

  • Ripple started a fresh decline from the $0.500 zone against the US dollar.
  • The price is now trading below $0.488 and the 100 simple moving average (4 hours).
  • There is a key bearish trend line forming with resistance near $0.470 on the 4-hour chart of the XRP/USD pair (data source from Kraken).
  • The pair might decline further if it stays below the $0.488 and $0.500 resistance levels.

Ripple Price Faces Hurdles

After a minor upward move, Ripple’s XRP struggled to gain pace for a move above the $0.50 resistance against the US Dollar. A high is formed near $0.4868 and the price is moving lower, similar to Bitcoin and Ethereum.

There was a clear move below the $0.475 and $0.470 support levels. The price is now trading near the 50% Fib retracement level of the upward move from the $0.4332 swing low to the $0.4868 high. It is now trading below $0.488 and the 100 simple moving average (4 hours).

Initial resistance is near the $0.470 zone. There is also a key bearish trend line forming with resistance near $0.470 on the 4-hour chart of the XRP/USD pair.

XRP Price Prediction

Source: XRPUSD on TradingView.com

The first major resistance is near the $0.480 level or the 100 simple moving average (4 hours). The main resistance is near the $0.488 level. A successful break above the $0.480 and $0.488 resistance levels might send the price toward the $0.520 resistance. Any more gains might send the price toward the $0.535 resistance.

More Losses in XRP?

If ripple fails to clear the $0.480 resistance zone, it could continue to move down. Initial support on the downside is near the $0.454 zone or the 61.8% Fib retracement level of the upward move from the $0.4332 swing low to the $0.4868 high.

The next major support is near $0.440. If there is a downside break and a close below the $0.440 level, XRP’s price could extend losses. In the stated case, the price could test the $0.400 support zone.

Technical Indicators

4-Hours MACD – The MACD for XRP/USD is now gaining pace in the bearish zone.

4-Hours RSI (Relative Strength Index) – The RSI for XRP/USD is now below the 50 level.

Major Support Levels – $0.454, $0.440, and $0.400.

Major Resistance Levels – $0.480, $0.488, and $0.500.

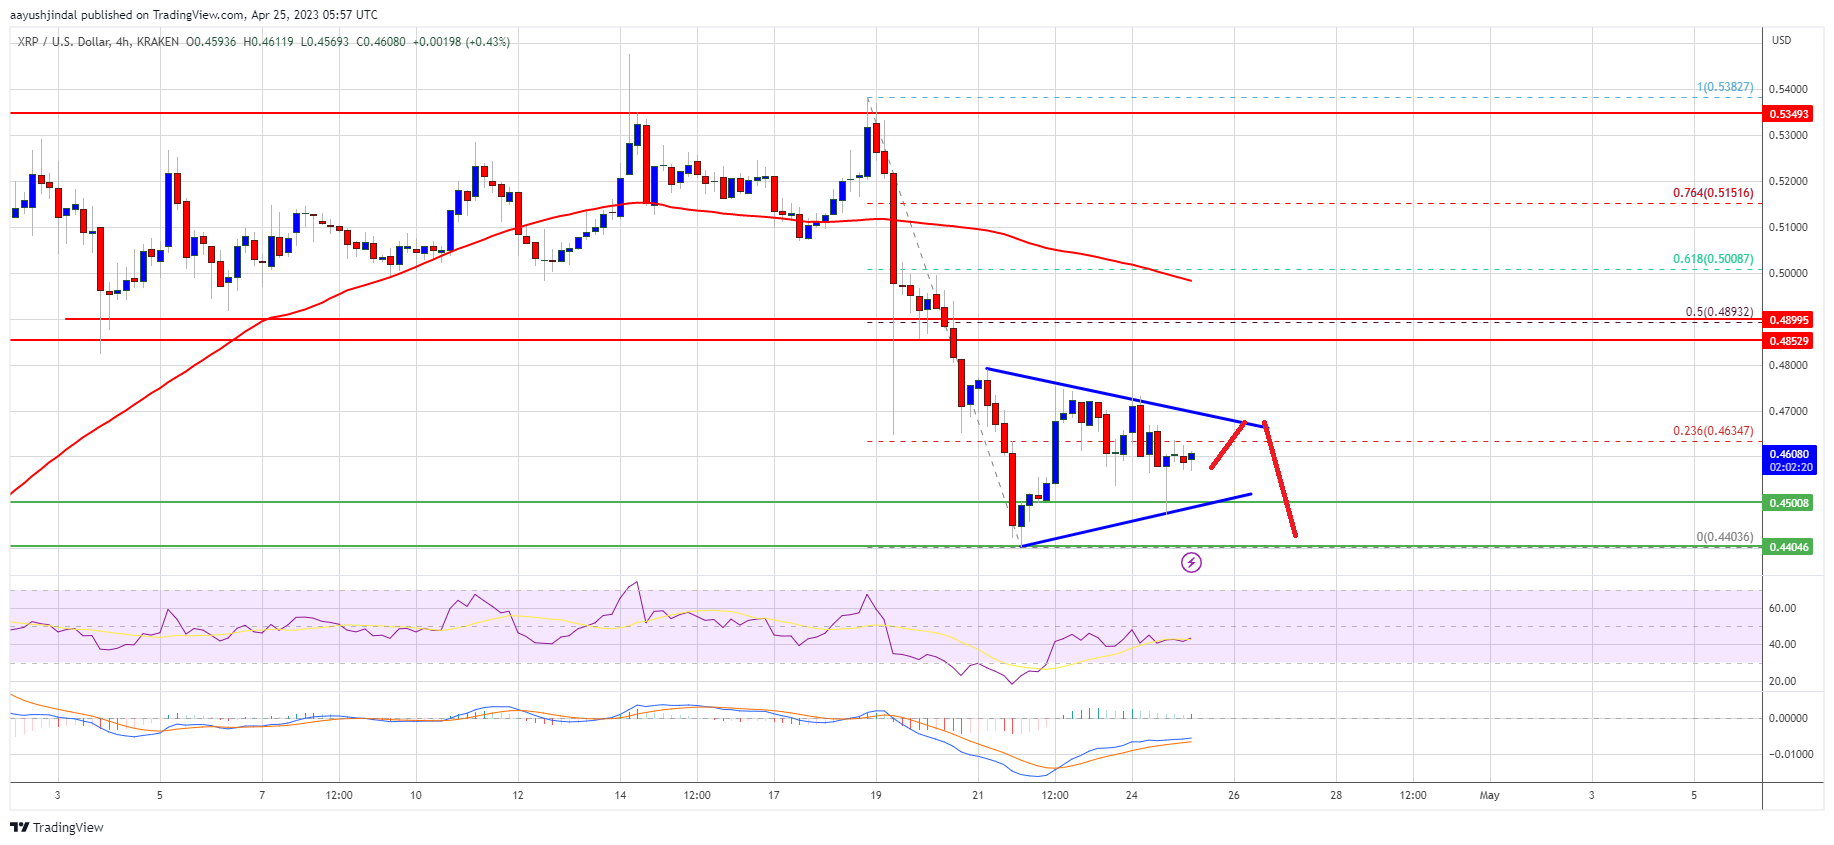
XRP Price Prediction: Ripple Trades Near Make-or-Breaks Levels

Ripple is consolidating above the $0.440 support against the US Dollar. XRP price could recover if it clears the $0.480 resistance zone.

  • Ripple started a fresh decline from the $0.5380 zone against the US dollar.
  • The price is now trading below $0.500 and the 100 simple moving average (4 hours).
  • There is a key contracting triangle forming with support near $0.450 on the 4-hour chart of the XRP/USD pair (data source from Kraken).
  • The pair might decline further if it stays below the $0.480 and $0.500 resistance levels.

Ripple Price Drops To $0.44

After a steady increase, Ripple’s XRP faced sellers near the $0.538 level against the US Dollar. A high was formed near $0.5382 and the price started a fresh decline, similar to Bitcoin and Ethereum.

There was a clear move below the $0.520 and $0.500 support levels. The price even declined below $0.450 and tested $0.440. A low is formed near $0.4403 and the price is now consolidating losses. It is now trading below $0.500 and the 100 simple moving average (4 hours).

There is also a key contracting triangle forming with support near $0.450 on the 4-hour chart of the XRP/USD pair. Initial resistance is near the $0.464 zone or the 23.6% Fib retracement level of the downward move from the $0.5382 swing high to the $0.4403 low.

XRP Price Prediction

Source: XRPUSD on TradingView.com

The first major resistance is near the $0.490 level or the 50% Fib retracement level of the downward move from the $0.5382 swing high to the $0.4403 low. A successful break above the $0.490 and $0.500 resistance levels might send the price toward the $0.5252 resistance. Any more gains might send the price toward the $0.5380 zone.

More Losses in XRP?

If ripple fails to clear the $0.490 resistance zone, it could continue to move down. Initial support on the downside is near the $0.452 zone.

The next major support is near $0.440. The main support is near $0.400. If there is a downside break and a close below the $0.400 level, XRP’s price could extend losses. In the stated case, the price could test the $0.365 support zone.

Technical Indicators

4-Hours MACD – The MACD for XRP/USD is now gaining pace in the bearish zone.

4-Hours RSI (Relative Strength Index) – The RSI for XRP/USD is now below the 50 level.

Major Support Levels – $0.450, $0.440, and $0.400.

Major Resistance Levels – $0.490, $0.500, and $0.538.

XRP Price Prediction: Key Upside Break Could Trigger Rally To $0.5

Ripple is rising steadily above the $0.380 resistance zone against the US Dollar. XRP price could rise further if it clears the $0.4320 resistance zone.

  • Ripple is currently rising above the $0.38 resistance zone against the US dollar.
  • The price is now trading above $0.380 and the 100 simple moving average (4-hours).
  • There is a key bullish trend line forming with support near $0.3960 on the 4-hours chart of the XRP/USD pair (data source from Kraken).
  • The pair could rally further if there is a clear move above the $0.4320 resistance zone.

Ripple Price Starts Steady Increase

After forming a base above $0.32, ripple’s XRP started a steady increase against the US Dollar. The price climbed above the $0.35 resistance zone to move into a positive zone.

The bulls pushed the price above the $0.365 level and the 100 simple moving average (4-hours). The increase was such that xrp price even surged above the $0.40 level. It traded to a new yearly high at $0.4324 and is currently consolidating gains, similar to bitcoin.

The price is now trading above $0.380 and the 100 simple moving average (4-hours). There is also a key bullish trend line forming with support near $0.3960 on the 4-hours chart of the XRP/USD pair. The pair is stable above the 23.6% Fib retracement level of the upward move from the $0.3655 swing low to $0.4324 high.

Ripple Price

Source: XRPUSD on TradingView.com

An immediate resistance is near the $0.432 zone. The next key resistance is near the $0.45 level. A successful break above the $0.450 resistance might send the price towards the $0.480 resistance. Any more gains might send the price towards the $0.50 level in the coming sessions.

Dips Limited in XRP?

If ripple fails to clear the $0.432 resistance zone, it could start a downside correction. An initial support on the downside is near the $0.416 level.

The next major support is near $0.400 and the trend line. It is close to the 50% Fib retracement level of the upward move from the $0.3655 swing low to $0.4324 high. If there is a downside break and close below the $0.40 level, xrp price could extend losses. In the stated case, the price could even decline below the $0.365 support.

Technical Indicators

4-Hours MACD – The MACD for XRP/USD is now gaining pace in the bullish zone.

4-Hours RSI (Relative Strength Index) – The RSI for XRP/USD is now above the 50 level.

Major Support Levels – $0.416, $0.400 and $0.392.

Major Resistance Levels – $0.432, $0.450 and $0.480.

XRP Price Prediction: Bulls Could Aim $0.4 or Higher

Ripple is gaining pace above the $0.350 resistance zone against the US Dollar. XRP price could rise further if it clears the $0.3720 resistance zone.

  • Ripple is currently rising above the $0.35 resistance zone against the US dollar.
  • The price is now trading above $0.350 and the 100 simple moving average (4-hours).
  • There was a break above a crucial bearish trend line with resistance near $0.3495 on the 4-hours chart of the XRP/USD pair (data source from Kraken).
  • The pair could rise further higher if there is a clear move above the $0.3720 resistance zone.

Ripple Price Extends Gains

After a sharp decline, ripple’s XRP found support near the $0.3000 zone against the US Dollar. The price formed a base above the $0.3050 level before it started a recovery wave.

There was a decent increase above the $0.3250 and $0.3300 resistance levels. Besides, there was a break above a crucial bearish trend line with resistance near $0.3495 on the 4-hours chart of the XRP/USD pair. The upward move gained pace above the $0.350 level.

The price is now trading above the 76.4% Fib retracement level of the main drop from the $0.3727 swing high to $0.3009 low. It is also trading above $0.350 and the 100 simple moving average (4-hours), outperforming bitcoin and ethereum.

An immediate resistance is near the $0.372 zone. The next key resistance is near the $0.390 level. It is near the 1.236 Fib extension level of the main drop from the $0.3727 swing high to $0.3009 low.

Ripple Price XRP

Source: XRPUSD on TradingView.com

A successful break above the $0.390 resistance might send the price towards the $0.400 resistance. Any more gains might send the price towards the $0.432 level in the coming days.

Fresh Decline in XRP?

If ripple fails to clear the $0.372 resistance zone, it could start a downside correction. An initial support on the downside is near the $0.355 level.

The next major support is near $0.345 and the 100 simple moving average (4-hours). If there is a downside break and close below the $0.345 level, xrp price could extend losses. In the stated case, the price could even decline below the $0.325 support.

Technical Indicators

4-Hours MACD – The MACD for XRP/USD is now gaining pace in the bullish zone.

4-Hours RSI (Relative Strength Index) – The RSI for XRP/USD is now above the 50 level.

Major Support Levels – $0.355, $0.345 and $0.325.

Major Resistance Levels – $0.372, $0.390 and $0.400.

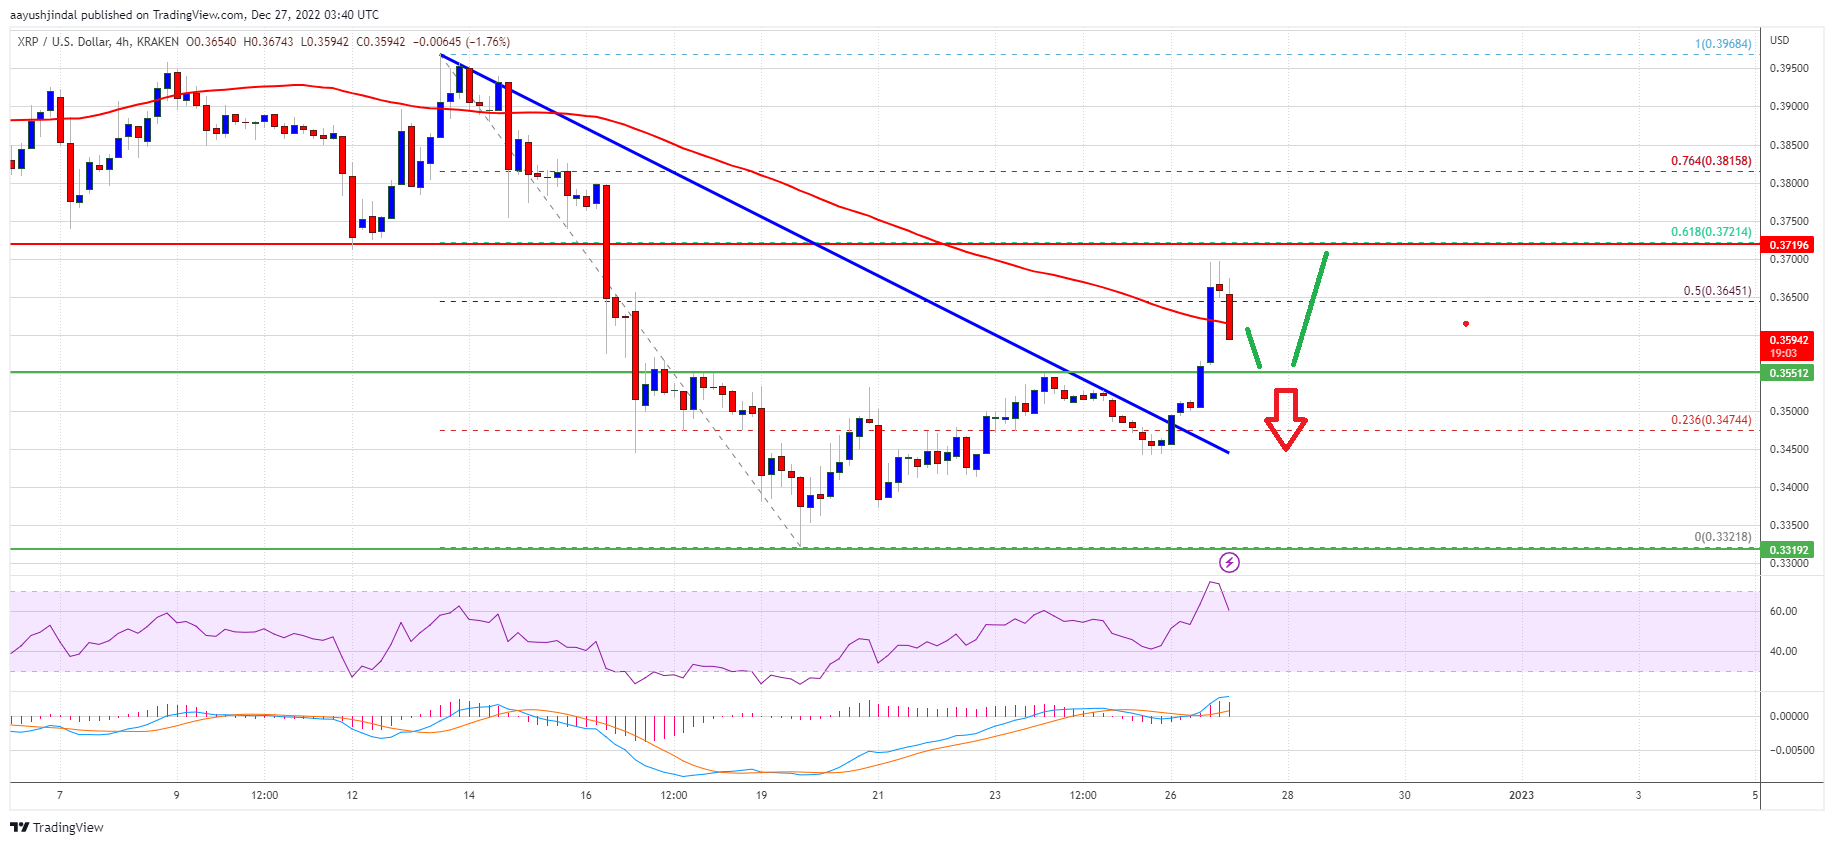
XRP Price Prediction: Recovery Could Derail If This Support Gives Way

Ripple is attempting an upside break above the $0.365 resistance zone against the US Dollar. XRP price could fail to gain pace if it stays below the $0.3720 resistance.

  • Ripple is currently recovering above the $0.355 resistance zone against the US dollar.
  • The price is now trading near $0.360 and the 100 simple moving average (4-hours).
  • There was a break above a major bearish trend line with resistance near $0.3480 on the 4-hours chart of the XRP/USD pair (data source from Kraken).
  • The pair could start a fresh decline if it breaks the $0.3550 support and pivot zone.

Ripple Price Attempts Recovery

After a major decline, ripple’s XRP found support near the $0.3320 zone against the US Dollar. The price formed a base above the $0.3320 level before it started a recovery wave.

There was a decent increase above the $0.3450 and $0.3500 resistance levels. Besides, there was a break above a major bearish trend line with resistance near $0.3480 on the 4-hours chart of the XRP/USD pair. In the past few sessions, xrp price gained pace above the $0.3550 resistance zone, outperforming bitcoin and ethereum.

The price even spiked above the 50% Fib retracement level of the key decline from the $0.3965 swing high to $0.3320 low. The price is now trading near $0.360 and the 100 simple moving average (4-hours).

An immediate resistance is near the $0.370 zone. The next key resistance is near the $0.372 level. It is near the 61.8% Fib retracement level of the key decline from the $0.3965 swing high to $0.3320 low.

Ripple Price XRP

Source: XRPUSD on TradingView.com

A successful break above the $0.372 resistance might send the price towards the $0.400 resistance. Any more gains might send the price towards the $0.425 level in the coming days.

Fresh Decline in XRP?

If ripple fails to clear the $0.372 resistance zone, it could start a fresh decline. An initial support on the downside is near the $0.358 level.

The next major support is near $0.355. If there is a downside break and close below the $0.355 level, xrp price could extend losses. In the stated case, the price could even decline below the $0.332 support.

Technical Indicators

4-Hours MACD – The MACD for XRP/USD is now losing pace in the bullish zone.

4-Hours RSI (Relative Strength Index) – The RSI for XRP/USD is now above the 50 level.

Major Support Levels – $0.355, $0.332 and $0.320.

Major Resistance Levels – $0.370, $0.373 and $0.400.

XRP Price Prediction: Bearish Continuation Below $0.33 Seems Likely

Ripple is consolidating below the $0.35 resistance zone against the US Dollar. XRP price could extend its decline if there is no recovery wave above the $0.35 barrier.

  • Ripple is currently consolidating below the $0.35 and $0.365 levels against the US dollar.
  • The price is now trading below $0.365 and the 100 simple moving average (4-hours).
  • There is a key bearish trend line forming with resistance near $0.3480 on the 4-hours chart of the XRP/USD pair (data source from Kraken).
  • The pair could start a decent recovery if it clears the $0.350 resistance zone.

Ripple Price Faces Resistance

After struggling to clear the $0.40 resistance, ripple’s XRP started a fresh decline against the US Dollar. The price dropped below the $0.380 and $0.365 support levels to move into a bearish zone.

The price gained pace below the $0.35 support and settled below the 100 simple moving average (4-hours). The bulls finally appeared near the $0.332 level. A low is formed near $0.3321 and the price is now consolidating losses, just like bitcoin and ethereum.

Xrp price climbed a few points above the $0.340 level. An immediate resistance is near the $0.350 zone. There is also a key bearish trend line forming with resistance near $0.3480 on the 4-hours chart of the XRP/USD pair. The trend line is close to the 23.6% Fib retracement level of the downward move from the $0.3968 swing high to $0.3321 low.

A successful break above the $0.350 resistance might send the price towards the $0.365 resistance. It is close to the 50% Fib retracement level of the downward move from the $0.3968 swing high to $0.3321 low.

Ripple Price XRP

Source: XRPUSD on TradingView.com

The next key resistance is near the $0.372 level and 100 simple moving average (4-hours). Any more gains might send the price towards the $0.40 level in the coming days.

More Downsides in XRP?

If ripple fails to clear the $0.350 resistance zone, it could continue to move down. An initial support on the downside is near the $0.340 level.

The next major support is near $0.332. If there is a downside break and close below the $0.332 level, xrp price could extend losses. In the stated case, the price could even decline below the $0.320 support.

Technical Indicators

4-Hours MACD – The MACD for XRP/USD is now losing pace in the bearish zone.

4-Hours RSI (Relative Strength Index) – The RSI for XRP/USD is now below the 50 level.

Major Support Levels – $0.340, $0.332 and $0.305.

Major Resistance Levels – $0.350, $0.365 and $0.372.

XRP Price Prediction: Bears Struggle, Time To Buy The Dip?

Ripple is consolidating above the $0.375 support zone against the US Dollar. XRP price could gain pace if it clears the $0.40 and $0.415 resistance levels.

  • Ripple is currently consolidating above the $0.375 and $0.380 levels against the US dollar.
  • The price is now trading near $0.388 and the 100 simple moving average (4-hours).
  • There is a key contracting triangle forming with support near $0.382 on the 4-hours chart of the XRP/USD pair (data source from Kraken).
  • The pair could start a strong increase if it clears the $0.400 resistance zone.

Ripple Price Remains Supported

After forming a base above the $0.345 level, ripple’s XRP started a decent increase against the US Dollar. The price was able to surpass the $0.375 and $0.380 resistance levels.

The price even spiked above the $0.40 level and settled above the 100 simple moving average (4-hours). However, the bears were active near the $0.423 zone. A high was formed near $0.423 before there was a downside correction, just like bitcoin.

Xrp price declined below the $0.40 support and the 100 simple moving average (4-hours). There was a clear move below the 50% Fib retracement level of the upward move from the $0.3458 swing low to $0.423 high.

The bulls are now active near the $0.375 level. There is also a key contracting triangle forming with support near $0.382 on the 4-hours chart of the XRP/USD pair. The price is currently consolidating above the $0.375 and $0.380 levels.

Ripple Price XRP

Source: XRPUSD on TradingView.com

An immediate resistance is near the $0.400 zone. A successful break above the $0.400 resistance might send the price towards the $0.425 resistance. The next key resistance is near the $0.450 level. Any more gains might send the price towards the $0.50 level in the coming days.

Downside Break in XRP?

If ripple fails to clear the $0.400 resistance zone, it could start a downside correction. An initial support on the downside is near the $0.382 level and the contracting trend line.

The next major support is near $0.375. If there is a downside break and close below the $0.375 level, xrp price could extend losses. In the stated case, the price could even decline below the $0.345 support.

Technical Indicators

4-Hours MACD – The MACD for XRP/USD is now losing pace in the bearish zone.

4-Hours RSI (Relative Strength Index) – The RSI for XRP/USD is now near the 50 level.

Major Support Levels – $0.382, $0.375 and $0.345.

Major Resistance Levels – $0.400, $0.425 and $0.450.

XRP Price Prediction: Smashing This Resistance Might Trigger Rally

Ripple is showing positive signs above the $0.365 support against the US Dollar. XRP price seems to be eyeing a fresh rally towards the $0.48 level.

  • Ripple is slowly moving higher and trading above $0.35 against the US dollar.
  • The price is now trading above $0.380 and the 100 simple moving average (4-hours).
  • There is a key bullish trend line forming with support near $0.381 on the 4-hours chart of the XRP/USD pair (data source from Kraken).
  • The pair could start a strong increase if it clears the $0.415 resistance zone.

Ripple Price Eyes Upside Break

After a strong decline, ripple’s XRP found support near the $0.320 zone against the US Dollar. The price started a decent increase above the $0.332 and $0.350 resistance levels.

The bulls were able to lift the price above the 23.6% Fib retracement level of the key drop from the $0.5098 swing high to $0.3200 swing low. xrp price is now trading above $0.380 and the 100 simple moving average (4-hours). There is also a key bullish trend line forming with support near $0.381 on the 4-hours chart of the XRP/USD pair.

It seems to be facing a major resistance near the $0.415 level. It is close to the 50% Fib retracement level of the key drop from the $0.5098 swing high to $0.3200 swing low. The next major resistance is near the $0.438 level.

Ripple Price

Source: XRPUSD on TradingView.com

A successful break above the $0.438 resistance might send the price towards the $0.465 resistance. The next key resistance is near the $0.480 level. Any more gains might send the price towards the $0.50 level in the coming days.

Dips Limited in XRP?

If ripple fails to clear the $0.415 resistance zone, it could start a downside correction. An initial support on the downside is near the $0.381 level, the trend line, and the 100 simple moving average (4-hours).

The next major support is near $0.350. If there is a downside break and close below the $0.350 level, xrp price could extend losses. In the stated case, the price could even decline below the $0.320 support.

Technical Indicators

4-Hours MACD – The MACD for XRP/USD is now gaining pace in the bullish zone.

4-Hours RSI (Relative Strength Index) – The RSI for XRP/USD is now above the 50 level.

Major Support Levels – $0.381, $0.365 and $0.350.

Major Resistance Levels – $0.415, $0.438 and $0.480.

XRP Price Prediction: Why The Bulls Could Aim Fresh Rally To $0.45

Ripple remained well bid above the $0.35 support against the US Dollar. XRP price seems to be eyeing a fresh rally towards the $0.45 level.

  • Ripple started a decent increase from the $0.32 support zone against the US dollar.
  • The price is now trading above $0.350 and the 100 simple moving average (4-hours).
  • There was a break above a major bearish trend line with resistance near $0.374 on the 4-hours chart of the XRP/USD pair (data source from Kraken).
  • The pair could start a strong increase if it clears the $0.400 resistance zone.

Ripple Price Eyes Fresh Increase

After a strong decline, ripple’s XRP formed a base above the $0.320 zone against the US Dollar. The price started a decent increase above the $0.335 and $0.340 resistance levels.

The bulls pushed the price above the 23.6% Fib retracement level of the downward move from the $0.5099 swing high to $0.3200 swing low. Besides, there was a break above a major bearish trend line with resistance near $0.374 on the 4-hours chart of the XRP/USD pair.

XRP is rising steadily above the 100 simple moving average (4-hours) and outperforming both bitcoin and ethereum. The price is now facing hurdles near $0.395 and $0.400. The first major resistance is near the $0.415 level.

The 50% Fib retracement level of the downward move from the $0.5099 swing high to $0.3200 swing low is also near the $0.415 level. A successful break above the $0.415 resistance might send the price towards the $0.450 resistance.

XRP Price Chart Ripple

Source: XRPUSD on TradingView.com

The next key resistance is near the $0.465 level. Any more gains might send the price towards the $0.50 level in the coming days.

Dips Supported in XRP?

If ripple fails to clear the $0.415 resistance zone, it could slowly move down. An initial support on the downside is near the $0.380 level and the 100 simple moving average (4-hours).

The next major support is near $0.345. If there is a downside break and close below the $0.345 level, xrp price could extend losses. In the stated case, the price could even decline below the $0.320 support.

Technical Indicators

4-Hours MACD – The MACD for XRP/USD is now losing pace in the bullish zone.

4-Hours RSI (Relative Strength Index) – The RSI for XRP/USD is now above the 50 level.

Major Support Levels – $0.380, $0.345 and $0.320.

Major Resistance Levels – $0.400, $0.415 and $0.450.

XRP Price Holds Ground While BTC and ETH Slide, Here’s Breakout Zone

Ripple failed to clear $0.40 and corrected lower against the US Dollar. XRP price could start a decent increase if it stays above the $0.345 support zone.

  • Ripple started a fresh decline from the $0.40 resistance zone against the US dollar.
  • The price is now trading below $0.380 and the 100 simple moving average (4-hours).
  • There is a key bearish trend line forming with resistance near $0.371 on the 4-hours chart of the XRP/USD pair (data source from Kraken).
  • The pair could start a strong increase if it clears the $0.388 resistance zone.

Ripple Price Remains Supported

This past week, ripple’s XRP attempted an upside break above the $0.40 resistance against the US Dollar. However, the bears remained active near $0.40 and pushed the price lower.

However, the recent decline was limited when compared to bitcoin and ethereum. The price declined below the $0.372 and $0.365 support levels. It traded as low as $0.3458 and is currently consolidating losses. It is trading below $0.380 and the 100 simple moving average (4-hours).

XRP price is now facing hurdles near $0.370. It is close to the 50% Fib retracement level of the downward move from the $0.3954 swing high to $0.3458 swing low.

There is also a key bearish trend line forming with resistance near $0.371 on the 4-hours chart of the XRP/USD pair. A successful break above the trend line resistance might send the price towards the $0.380 resistance or the 76.4% Fib retracement level of the downward move from the $0.3954 swing high to $0.3458 swing low.

XRP Price

Source: XRPUSD on TradingView.com

The next key resistance is near the $0.388 level. The main barrier is still near the $0.40 level. Any more gains might send the price towards the $0.45 level.

Dips Supported in XRP?

If ripple fails to clear the $0.388 resistance zone, it could slowly move down. An initial support on the downside is near the $0.345 level.

The next major support is near $0.332. If there is a downside break and close below the $0.332 level, xrp price could extend losses. In the stated case, the price could even decline below the $0.320 support.

Technical Indicators

4-Hours MACD – The MACD for XRP/USD is now losing pace in the bearish zone.

4-Hours RSI (Relative Strength Index) – The RSI for XRP/USD is now below the 50 level.

Major Support Levels – $0.345, $0.332 and $0.320.

Major Resistance Levels – $0.371, $0.388 and $0.400.

XRP Price Rallies 15%, Why Ripple Could Outperform Bitcoin and Ethereum

Ripple started a strong increase above the $0.350 resistance against the US Dollar. XRP price is now attempting a key upside break above the $0.380 resistance.

  • Ripple started a fresh increase from the key $0.320 support zone against the US dollar.
  • The price is now trading below $0.400 and the 100 simple moving average (4-hours).
  • There is a major bearish trend line forming with resistance near $0.380 on the 4-hours chart of the XRP/USD pair (data source from Kraken).
  • The pair could start a strong increase if it clears the $0.38 resistance zone.

Ripple Price Starts Fresh Increase

After a sharp decline, ripple’s XRP found support near $0.320 against the US Dollar. The bears made two attempts to push the price below the $0.32 support, but they failed.

The recent low was formed near $0.32 before there was a fresh increase. XRP price climbed over 15% and cleared the $0.35 resistance, outperforming bitcoin and ethereum. The price climbed above the 23.6% Fib retracement level of the downward move from the $0.5099 swing high to $0.3200 swing low.

The price gained pace for a move above the $0.360 resistance. However, it is now trading below $0.400 and the 100 simple moving average (4-hours). It is now facing hurdles near $0.380. There is also a major bearish trend line forming with resistance near $0.380 on the 4-hours chart of the XRP/USD pair.

XRP Price

Source: XRPUSD on TradingView.com

A successful break above the $0.380 and $0.385 resistance levels could spark another rally. The next key resistance is near the $0.415 level. It is near the 50% Fib retracement level of the downward move from the $0.5099 swing high to $0.3200 swing low. Any more gains might send the price towards the $0.44 level.

Dips Limited in XRP?

If ripple fails to clear the $0.380 resistance zone, it could start a downside correction. An initial support on the downside is near the $0.365 level.

The next major support is near $0.342. If there is a downside break and close below the $0.342 level, xrp price could extend losses. In the stated case, the price could even decline below the $0.320 support.

Technical Indicators

4-Hours MACD – The MACD for XRP/USD is now gaining pace in the bullish zone.

4-Hours RSI (Relative Strength Index) – The RSI for XRP/USD is now above the 50 level.

Major Support Levels – $0.365, $0.342 and $0.320.

Major Resistance Levels – $0.380, $0.385 and $0.415.

XRP Price Prediction: Why The Bulls Could Protect This Crucial Support

XRP price started a major decline from the $0.50 resistance against the US Dollar. The recent collapse of FTX and FTT sparked a sharp move towards the $0.32 support.

  • Ripple is down over 15% and there was a drop below the $0.40 support against the US dollar.
  • The price is trading well below $0.4000 and the 100-day simple moving average.
  • There was a break below a major contracting triangle with support at $0.455 on the daily chart of the XRP/USD pair (data source from Kraken).
  • The pair could start a recovery wave if the bulls remain active near the $0.32 support.

Ripple’s XRP Price Tests Key Support

In the past 3-4 days, the crypto market saw a major decline. Bitcoin, ethereum, ftt, bnb, and sol saw a substantial decline. Ripple’s XRP price also faced the heat and declined heavily from the $0.50 resistance zone.

There was a clear move below the $0.450 and $0.40 support levels. Besides, there was a break below a major contracting triangle with support at $0.455 on the daily chart of the XRP/USD pair. The pair dropped below the $0.350 support and tested a crucial support at $0.320.

A low is formed near the $0.320 level and the price is now consolidating losses. XRP is now trading well below $0.4000 and the 100-day simple moving average.

An immediate resistance is near the $0.3650 level. It is close to the 23.6% Fib retracement level of the downward move from the $0.5099 swing high to $0.3200 low. The first major resistance is seen near the $0.380 level, above which the price might recover towards the $0.415 level and the 100-day simple moving average.

Ripple’s XRP Price

Source: XRPUSD on TradingView.com

The 50% Fib retracement level of the downward move from the $0.5099 swing high to $0.3200 low is also near $0.415. A clear break above the $0.415 resistance could open the doors for a sharp increase towards the $0.5000 resistance. The next major resistance above the $0.5000 level could be near the $0.5200 level.

Dips Supported?

If ripple fails to clear the $0.380 resistance, it could start a fresh decline. An initial support on the downside is near the $0.3400 level.

The main support could be near the $0.3200 level or the $0.3000 zone. If the price fails to stay above $0.3000, it could start another major decline.

Technical Indicators

Daily MACD – The MACD for XRP/USD is now losing momentum in the bearish zone.

Daily RSI (Relative Strength Index) – The RSI for XRP/USD is now below the 50 level.

Major Support Levels – $0.3400, $0.3200 and $0.3000.

Major Resistance Levels – $0.3650, $0.3800 and $0.4150.

XRP Price Spikes 10% and Could Extend Rally To $0.55 or Higher

Ripple started a strong increase above the $0.460 resistance against the US Dollar. XRP price broke many hurdles near $0.478 and might rise further towards $0.55.

  • Ripple started a fresh increase from the key $0.442 support zone against the US dollar.
  • The price is now trading nicely above $0.480 and the 100 simple moving average (4-hours).
  • There was a break above a major bearish trend line with resistance near $0.4600 on the 4-hours chart of the XRP/USD pair (data source from Kraken).
  • The pair could continue to rise if there is a close above the $0.5000 resistance.

Ripple Price Rally To $0.50

Yesterday, we discussed how ripple’s XRP is primed for rally and only 1 thing is holding it back against the US Dollar. XRP formed a base above the $0.4220 level and started a steady increase above $0.4400.

The price gained pace for a move above the $0.450 resistance. The bulls were able to clear the key barriers near the $0.478 and $0.480 levels. It opened the doors for more gains above the $0.488 level. The price was able to clear the 50% Fib retracement level of the key decline from the $0.5486 swing high to $0.4220 swing low.

Besides, there was a break above a major bearish trend line with resistance near $0.4600 on the 4-hours chart of the XRP/USD pair. The price is up nearly 10%, outperforming ethereum and bitcoin.

XRP price is now trading nicely above $0.480 and the 100 simple moving average (4-hours). Itis now facing hurdles near $0.500. It is close to the 61.8% Fib retracement level of the key decline from the $0.5486 swing high to $0.4220 swing low.

XRP Price Chart

Source: XRPUSD on TradingView.com

A successful break above the $0.500 and $0.505 resistance levels could spark another rally. The next key resistance is near the $0.52 level, above which the bulls are likely to aim a retest of the $0.55 barrier. Any more gains might send the price towards the $0.60 level.

Dips Limited in XRP?

If ripple fails to clear the $0.500 resistance zone, it could start a downside correction. An initial support on the downside is near the $0.485 level.

The next major support is near $0.465. If there is a downside break and close below the $0.465 level, xrp price could extend losses. In the stated case, the price could even decline below the $0.450 support.

Technical Indicators

4-Hours MACD – The MACD for XRP/USD is now gaining pace in the bearish zone.

4-Hours RSI (Relative Strength Index) – The RSI for XRP/USD is now above the 50 level.

Major Support Levels – $0.485, $0.465 and $0.450.

Major Resistance Levels – $0.500, $0.520 and $0.550.

XRP Price Forecast: Ripple is Primed For Rally And Only 1 Thing is Holding it Back

Ripple is facing resistance near $0.46 against the US Dollar. XRP price could start a fresh rally if it is able to clear the $0.46 and $0.478 resistance levels.

  • Ripple is consolidating above the key $0.442 support zone against the US dollar.
  • The price is facing hurdles near $0.460 and the 100 simple moving average (4-hours).
  • There is a crucial bearish trend line forming with resistance near $0.4605 on the 4-hours chart of the XRP/USD pair (data source from Kraken).
  • The pair could start a strong increase if there is a clear move above $0.462 and $0.482.

Ripple Price Prepares For The Next Move

After a sharp decline, ripple’s XRP found support near the $0.4220 zone against the US Dollar. XRP formed a base above the $0.4220 level and started a fresh increase, similar to ethereum and bitcoin.

There was a clear move above the $0.435 and $0.445 resistance levels. The price climbed above the 50% Fib retracement level of the downward move from the $0.5118 swing high to $0.4220 swing low. However, the price struggled to clear the $0.4800 resistance and the 100 simple moving average (4-hours).

It failed to clear the 61.8% Fib retracement level of the downward move from the $0.5118 swing high to $0.4220 swing low. The price is now facing hurdles near $0.460 and the 100 simple moving average (4-hours).

There is also a crucial bearish trend line forming with resistance near $0.4605 on the 4-hours chart of the XRP/USD pair. The main resistance is near the $0.478 and $0.480 levels. A successful break above the $0.478 and $0.480 resistance levels could spark another rally.

XRP Price Chart

Source: XRPUSD on TradingView.com

The next key resistance is near the $0.500 level, above which the bulls are likely to aim a retest of the $0.55 barrier. Any more gains might send the price towards the $0.60 level.

Downside Break in XRP?

If ripple fails to start a fresh increase above the $0.478 level, it could start a fresh decline. An initial support on the downside is near the $0.442 level.

If there is a downside break and close below the $0.442 level, xrp price could start a major decline. In the stated case, the price could even decline below the $0.422 support.

Technical Indicators

4-Hours MACD – The MACD for XRP/USD is now losing pace in the bearish zone.

4-Hours RSI (Relative Strength Index) – The RSI for XRP/USD is now below the 50 level.

Major Support Levels – $0.442, $0.422 and $0.405.

Major Resistance Levels – $0.462, $0.48 and $0.50.

Ripple Price Prediction: Can XRP Continue To Outperform Bitcoin?

Ripple struggled to clear the $0.550 resistance against the US Dollar. XRP price is now moving lower and might drop further similar to bitcoin.

  • Ripple faced a strong selling interest near the $0.55 zone against the US dollar.
  • The price is now trading below $0.500 and the 100 simple moving average (4-hours).
  • There was a break below a key bullish trend line with support near $0.4940 on the 4-hours chart of the XRP/USD pair (data source from Kraken).
  • The pair could decline heavily if there is a clear move below the $0.4650 support.

Ripple’s XRP Price Starts Decline

This past week, ripple’s XRP started a steady increase from the $0.4500 support zone. There was a clear move above the $0.480 and $0.505 resistance levels.

The price climbed above the $0.520 resistance, outperforming bitcoin and ethereum’s ether. However, the bulls failed once again to clear the key $0.550 resistance zone. A high was formed near $0.5486 and the price started a fresh decline.

XRP price declined below the $0.52 and $0.50 support levels. There was a move below the 50% Fib retracement level of the upward move from the $0.4417 swing low to $0.5486 high.

Besides, there was a break below a key bullish trend line with support near $0.4940 on the 4-hours chart of the XRP/USD pair. The price is now trading below $0.500 and the 100 simple moving average (4-hours).’

Source: XRPUSD on TradingView.com

On the upside, the price is facing resistance near the $0.4825 level. The first major resistance is near the $0.500 zone. A successful break above the $0.50 and $0.505 resistance levels could spark another rally. The next key resistance is near the $0.520 level, above which the bulls are likely to aim a retest of the $0.55 barrier.

Downside Break in XRP?

If ripple fails to start a fresh increase above the $0.50 level, it could continue to move down. An initial support on the downside is near the $0.465 level. It is near the 61.8% Fib retracement level of the upward move from the $0.4417 swing low to $0.5486 high.

If there is a downside break and close below the $0.465 level, xrp price could start a major decline. In the stated case, the price is likely to drop towards the $0.42 support.

Technical Indicators

4-Hours MACD – The MACD for XRP/USD is now gaining pace in the bearish zone.

4-Hours RSI (Relative Strength Index) – The RSI for XRP/USD is now below the 50 level.

Major Support Levels – $0.465, $0.42 and $0.405.

Major Resistance Levels – $0.485, $0.505 and $0.550.