Hammond, chair of custody company Copper, said the U.K. is falling behind neighboring countries and needs to accept “measured risk.”
Ex-UK Chancellor Philip Hammond Urges Accelerated Efforts to Become Crypto Hub: FT

Cryptocurrency Financial News
Hammond, chair of custody company Copper, said the U.K. is falling behind neighboring countries and needs to accept “measured risk.”
The exchange contravened Dutch law by providing crypto services without registering, the central bank said.


Data shows that Bitcoin miners’ BTC reserves are at their lowest since December 2021, despite a dramatic hash rate renaissance.


United States-based crypto exchange Coinbase is fined 3.3 million euros ($3.6 million) by the Dutch central bank for the lack of registration.

The Aptos Mainnet was only launched in full back in October 2022 in the midst of last year’s tumultuous bear market. Since then, the developmbnt team of Aptos has been busy. According to Santiment, development on-chain has been nearly consistent even as it is a far cry from all-time-high levels.
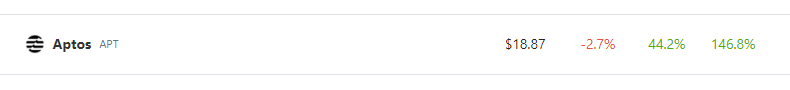
Because of this, CoinGecko noted a strong bullish push as the native token of Aptos, APT, soared 147% in the weekly time frame. Adding on to the bullishness is the current sentiment surrounding cryptocurrencies.
According to recent news, the market might continue its bullish run as the derivatives market of Bitcoin sends buy signals to bulls.
The naming and identity arm of Aptos, Aptos Names, has been on a roll lately as they make their smart contract code open source. According to the thread, this would make the contracts much more secure as individuals can customize their contracts.
This would also make the code more decentralized, allowing the community to have more input and authority on what can be implemented in the future for Aptos Names.

PancakeSwap also continued with its multi-chain deployment on Aptos. Since the proposal, the decentralized exchange has deployed over 14 farms on the blockchain with four APT pairs available.
The ongoing rally for APT is something the bulls relish on, making APT among the top gainers in almost all time frames, according to CoinGecko data.
Since January 1st, Aptos found three price levels in case the token faces a strong rejection in the coming days or weeks.
As it currently stands, the rally is being supported at $12.32. If the token faces rejection, investors and traders can rely on this crucial support if the $16.01 support is broken.
Right now, the token is able to reach these new highs as a result of on-chain developments that give investors confidence.
At the time of writing, January 26th, long buyers outnumber the short sellers by a very small margin.
This may be a sign that investor confidence in the long-term prospect of the token is still optimistic. For now, investors and traders can cash in some gains to hedge against potential downturns in APT’s market.
Watching the overall situation in the crypto market is also a must as market movements by major cryptos can have an effect on APT’s price trajectory.
Featured image by New Scientist


The lawsuit marks the fourth time the Mango Markets exploiter has been hit by charges or lawsuits relating to his attack on the DeFi protocol.


The hacker accumulated as much as $90 million worth of crypto from wallets with weak private keys during a six-year thieving spree.


Senator Elizabeth Warren claims the Trump Administration “gave a green light” to a cryptocurrency market full of junk tokens, rug pulls and Ponzi schemes.


FTX lawyers, joint provisional liquidators of FTX.US and the Bahamas and a committee of creditors have all opposed the appointment of an independent examiner.

Solana is surging above $20 against the US Dollar. SOL price could extend its rally above the $26 and $30 resistance levels in the near term.
This week, solana price formed a base and started a steady increase above the $20 level. There was a strong increase above the $22 resistance zone, similar to bitcoin and ethereum.
The bulls even managed to pump the price above the $25 resistance. It traded to a new yearly high at $26.54 before there was a minor downside correction. There was a decline below the $24 level. The price declined below the 50% Fib retracement level of the upward wave from the $20.20 swing low to $26.54 high.
Sol price is now trading above $22 and the 100 simple moving average (4-hours). There is also a major bullish trend line forming with support near $23.05 on the 4-hours chart of the SOL/USD pair.
The pair is now trading comfortably above the 61.8% Fib retracement level of the upward wave from the $20.20 swing low to $26.54 high. The price is now rising and up over 8%. On the upside, an immediate resistance is near the $25 level.
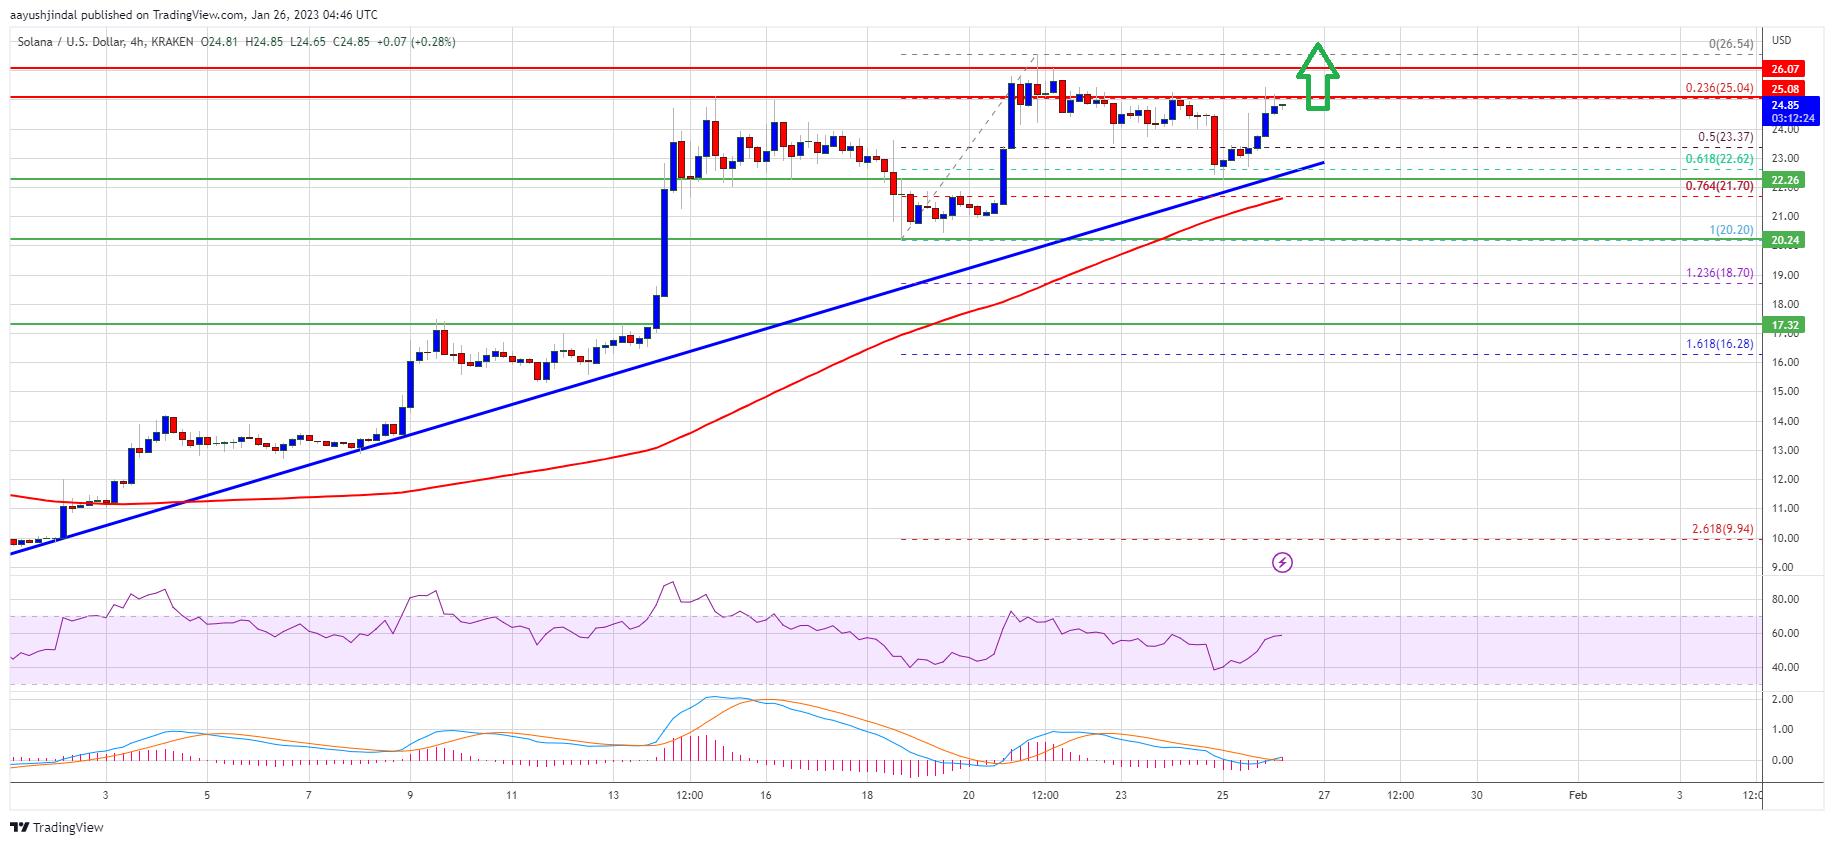
Source: SOLUSD on TradingView.com
The first major resistance is near the $26.50 level. The next major resistance is near the $28 zone, above which the price might rise towards the $30 barrier. Any more gains might send the price towards the $35 level.
If SOL fails to clear the $26.50 resistance, it could start a downside correction. An initial support on the downside is near the $24 level.
The first major support is near the $23.00 level and the trend line. The next major support is near the $21.70 level. If there is a downside break below the $21.70 support, the price might test the next key support at $20.
Technical Indicators
4-Hours MACD – The MACD for SOL/USD is gaining pace in the bullish zone.
4-Hours RSI (Relative Strength Index) – The RSI for SOL/USD is above the 50 level.
Major Support Levels – $24, $23 and $20.
Major Resistance Levels – $25, $26.50 and $30.

Ethereum corrected lower sharply and tested $1,500 against the US Dollar. ETH started a fresh increase and is now trading above the $1,600 pivot level.
Ethereum price started a sharp downside correction below the $1,600 level. ETH even declined below the $1,550 support zone and the 100 hourly simple moving average.
However, the bulls were active near the $1,520 support zone. A low as formed near $1,518 and the price started a sharp increase, similar to bitcoin. There was a steady increase above the $1,550 and $1,580 resistance levels. The bulls even pushed it above the $1,600 level.
Besides, there was a break above a major bearish trend line with resistance near $1,615 on the hourly chart of ETH/USD. Ether price is now trading above $1,600 and the 100 hourly simple moving average.
A high is formed near $1,639 and the price is consolidating gains. It is trading near the 23.6% Fib retracement level of the upward move from the $1,518 swing low to $1,639 high. An immediate resistance is near the $1,640 level. The next major resistance is near the $1,665 level.
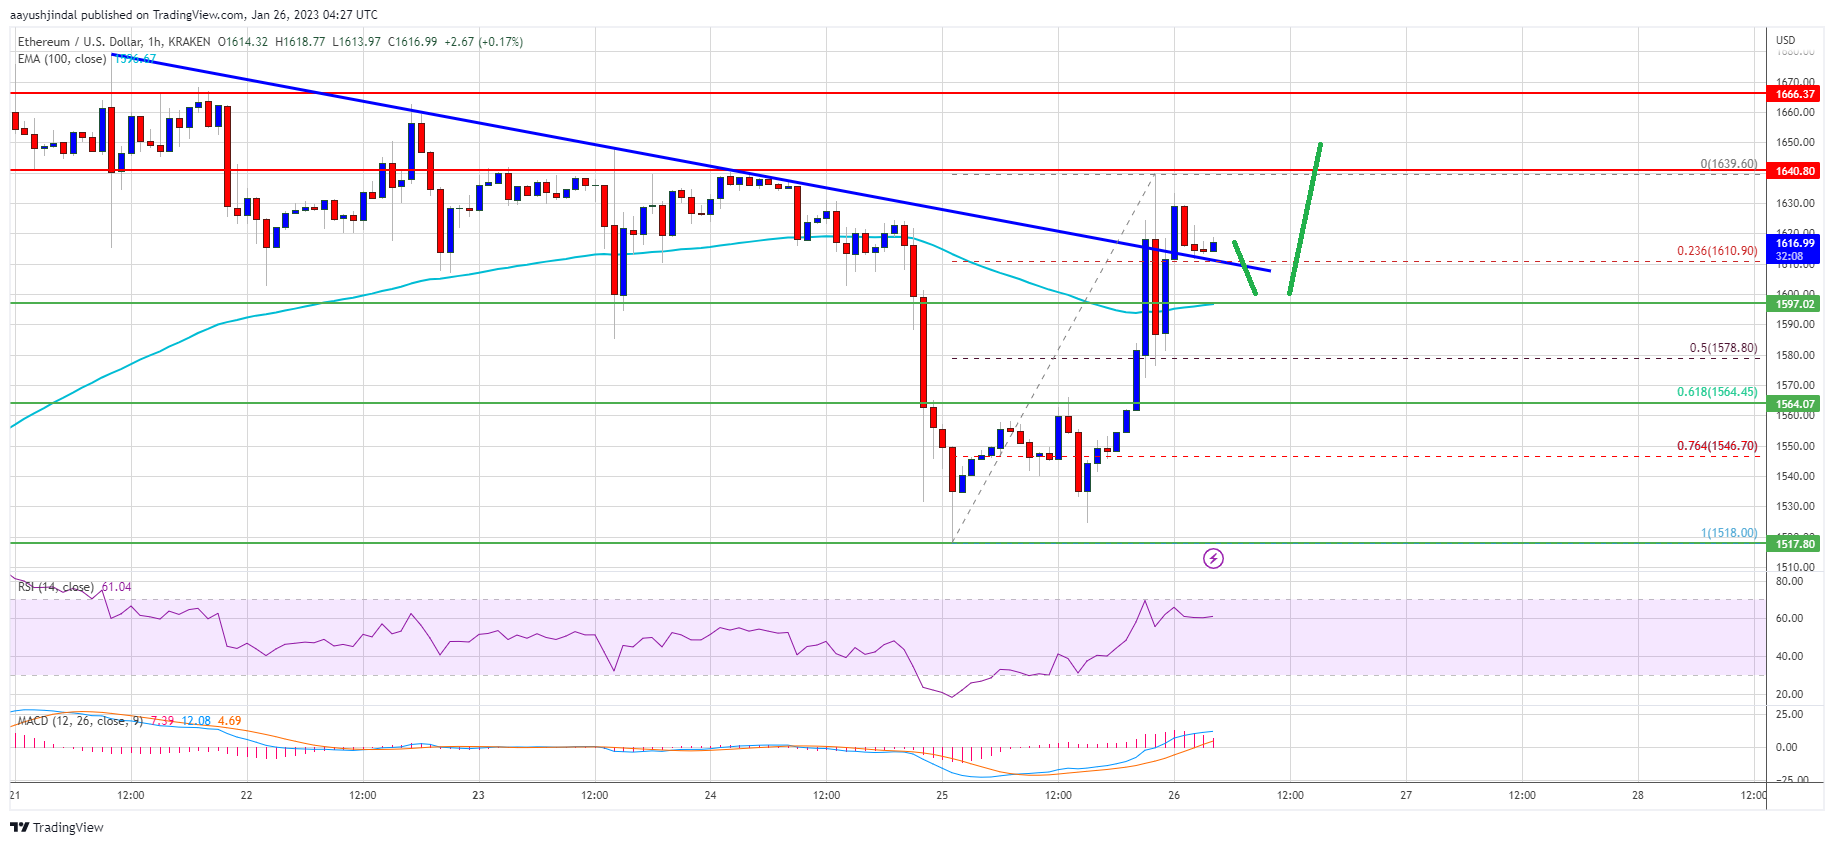
Source: ETHUSD on TradingView.com
An upside break above the $1,665 resistance zone could start a fresh rally. In the stated case, the price may perhaps rise towards the $1,720 resistance.
If ethereum fails to clear the $1,640 resistance, it could start another downside correction. An initial support on the downside is near the $1,610 level or the broken trend line.
The next major support is near the $1,580 level or the 50% Fib retracement level of the upward move from the $1,518 swing low to $1,639 high. If there is a break below $1,580, the price might drop towards the $1,550 support. Any more losses might call for a retest of the $1,520 zone.
Technical Indicators
Hourly MACD – The MACD for ETH/USD is now gaining momentum in the bullish zone.
Hourly RSI – The RSI for ETH/USD is now above the 50 level.
Major Support Level – $1,580
Major Resistance Level – $1,640


The over 100-page long document lists every entity FTX owes money to, inclusive of Big Tech players to local businesses from its Bahamian headquarters.
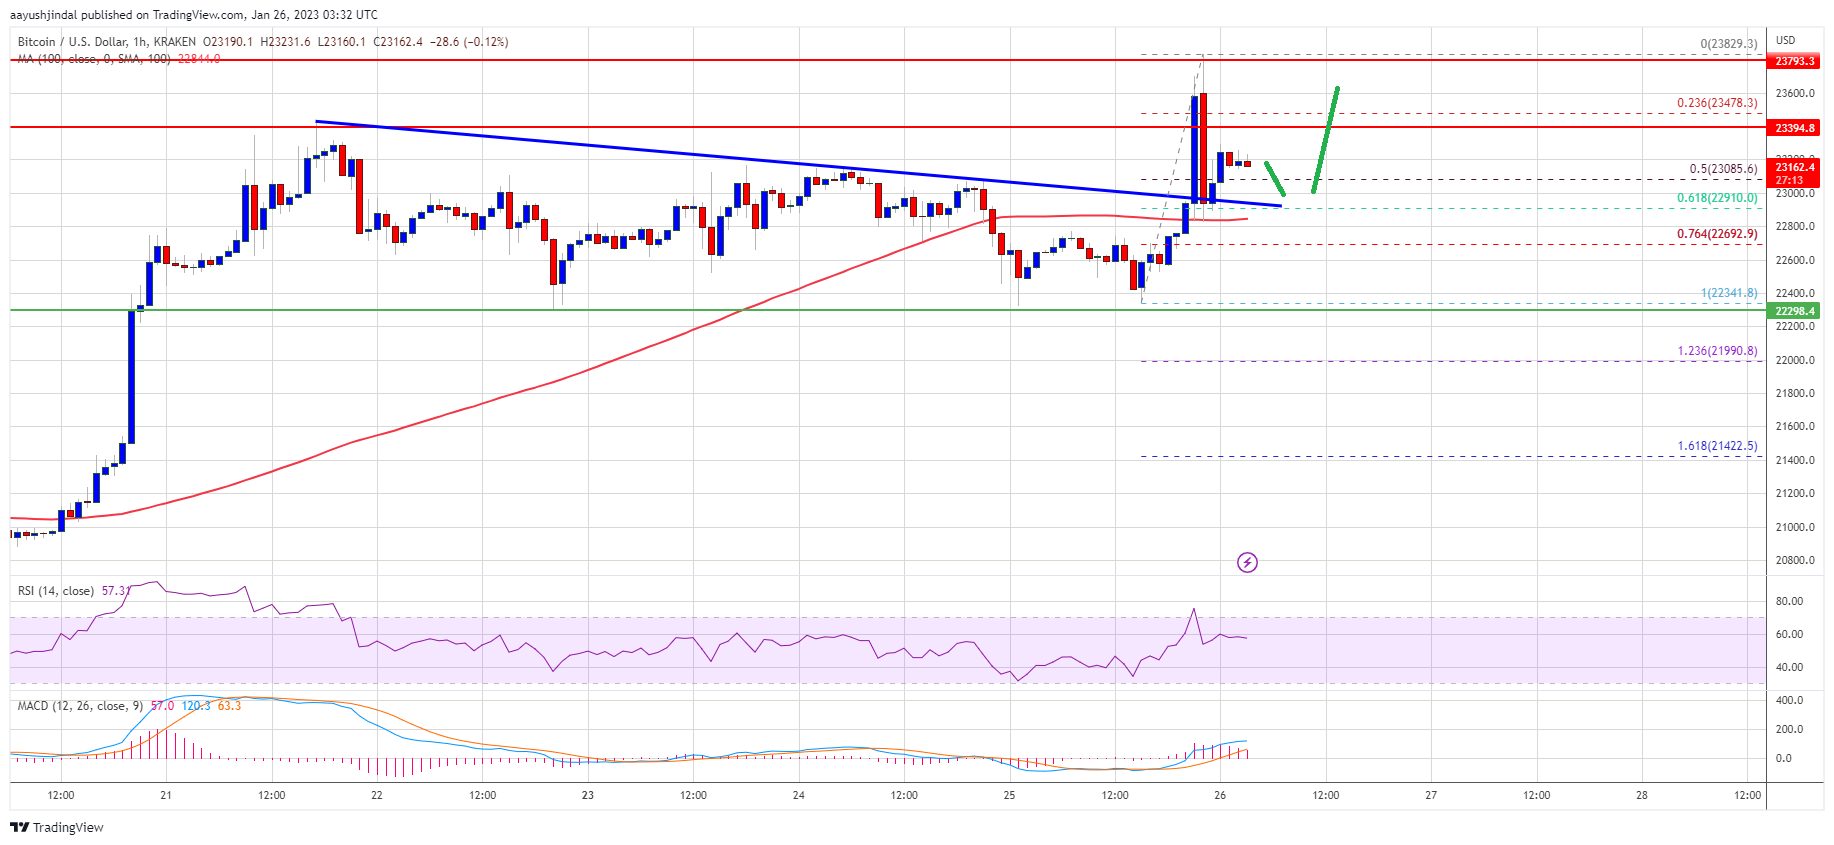
Bitcoin price started a fresh increase from the $22,400 support zone. BTC climbed to a new yearly high and now aims more upsides above $24,000.
Bitcoin price saw a downside correction below the $23,000 level. However, BTC remained well bid near the $22,400 support zone. A low was formed near $22,341 and the price started a fresh increase.
There was a clear move above the $23,000 resistance zone. Besides, there was a break above a major bearish trend line with resistance near $23,000 on the hourly chart of the BTC/USD pair. The pair surged to a new yearly high at $23,829 and is currently correcting gains.
There was a move below the 50% Fib retracement level of the recent increase from the $22,341 swing low to $23,829 high. However, the bulls appeared near the $23,200 support zone.
Bitcoin price is now trading above $23,000 and the 100 hourly simple moving average. It is also above the 61.8% Fib retracement level of the recent increase from the $22,341 swing low to $23,829 high. An immediate resistance is near the $23,400 level.

Source: BTCUSD on TradingView.com
The next major resistance is near the $23,850 zone, above which the price might gain bullish momentum. In the stated case, the price may perhaps rise towards the $24,200 level. The next resistance could be near the $24,500 level. Any more gains might send btc price towards the $25,000 level.
If bitcoin price fails to clear the $23,400 resistance, it could continue to move down. An immediate support on the downside is near the $23,000 zone.
The next major support is near the $22,850 zone. A downside break below the $22,850 level might send the price towards the $22,500 level. Any more losses might send the price to $22,350 in the near term.
Technical indicators:
Hourly MACD – The MACD is now losing pace in the bullish zone.
Hourly RSI (Relative Strength Index) – The RSI for BTC/USD is now above the 50 level.
Major Support Levels – $23,000, followed by $22,850.
Major Resistance Levels – $23,400, $23,850 and $24,200.

The largest cryptocurrency by market capitalization regained ground lost in a late Tuesday swoon. ALSO: Laguna Labs CEO Stefan Rust discusses Genesis and bitcoin’s short-term prospects in a CoinDesk Q&A.

Among the nonfungible tokens (NFTs) stolen from the PROOF co-founder were 25 Chromie Squiggles and one Autoglyph NFT.


A Jan. 25 report from the Financial Times which was widely shared characterized Circle as having “blamed” the SEC for its “jettisoned” public listing plan.

Commercial lawyers with a solid knowledge of blockchain and crypto tech will be in particularly high demand.


The EV maker continued to hold its estimated 9,720 Bitcoin, only losing $34 million on its investment due to price declines towards the end of 2022.

BUSD’s circulating supply fell to $15.4 billion on Wednesday, paring down $1 billion over the past week and $2 billion in a month, according to cryptocurrency price tracker CoinGecko.
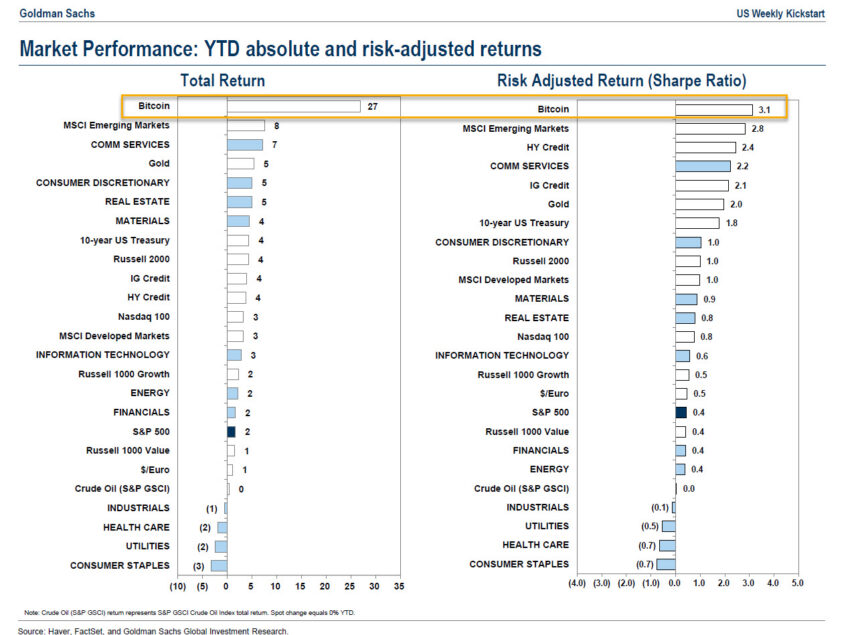
Ahead of Gold, US Treasury, the S&P 500, and others, banking giant Goldman Sachs ranks Bitcoin (BTC) in the top 1 best-performing asset year-to-date, per a Twitter user.
According to Goldman Sachs, Bitcoin has outperformed its cryptocurrency pairs and those major financial institutions of the traditional market with a risk-adjusted return (Sharpe ratio) of 3.1. The Sharpe Ratio is used to measure market volatility-adjusted performance; the higher the ratio, the better the investment, currency, or stock in terms of risk-adjusted returns.

On smaller timeframes, Bitcoin continues its quest to regain lost territory. Slowly but steadily, Bitcoin is attempting to break above the resistance level of $23,800. Bitcoin appears to have a healthy pullback below the resistance line in search of bullish momentum.
Despite the recent crisis of not only the cryptocurrency market with the collapse of FTX and the world economy in free fall, bringing consequences for investors and institutions, the market has also noted the comeback of market makers on cryptocurrency exchanges.
In contrast with Goldman Sachs’ report, according to an annual report by CoinGecko, Bitcoin is the worst-performing asset among the major currencies, with a significant decline of 64%. CoinGecko also noted that since January 2022, the trading volume in the spot market has decreased by 67%.
The new year for Bitcoin and the market started positively, with $200 billion bulking the volume and volatility sheets, according to CoinMarketCap data.
Bitcoin’s year-to-date solid rally has shifted market sentiment. Analysts seem bullish in the short term, expecting the cryptocurrency to increase to as much as $30,000. However, in the long term, economist Lyn Alden said that Bitcoin could be in “considerable danger” in the second quarter of 2023 as liquidity risks increase.
As the price of Bitcoin consolidates below the resistance zone, the cryptocurrency is looking for a trendline break to position itself above the $24,500 level, representing its next obstacle.
The rising 20-day moving average at $20,700 and the Relative Strength Index (RSI) in the overbought zone near 80 suggest that BTC’s bullish trend line can continue and conquer new regions.
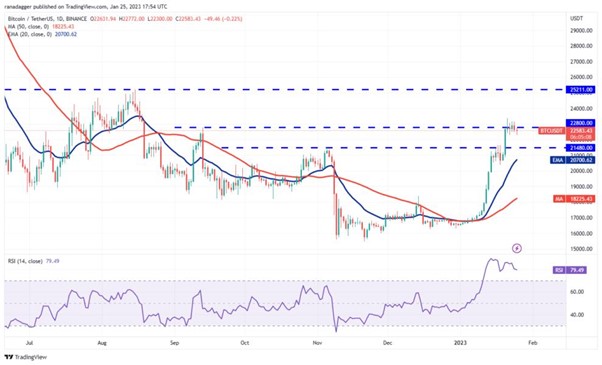
Conversely, bears are ready to stall the Bitcoin price action to the upside and turn the momentum and direction of the market, but bulls seem unwilling to surrender. Speculation is on the rise with no certainties in the market and the upcoming Federal Open Market Committee (FOMC) meetings.
As of this writing, Bitcoin has gained nearly 8% in the last seven days. It has traded at $22,889 with sideways movement in the last 24 hours. The currency’s current capitalization stands at $440 billion, outperforming all its market pairs.


