
SBF made the “highest ROI trade of all time” by donating $40 million to the right people for getting away with stealing over $10 billion, said Will Manidis, the CEO of ScienceIO.
Cryptocurrency Financial News

SBF made the “highest ROI trade of all time” by donating $40 million to the right people for getting away with stealing over $10 billion, said Will Manidis, the CEO of ScienceIO.
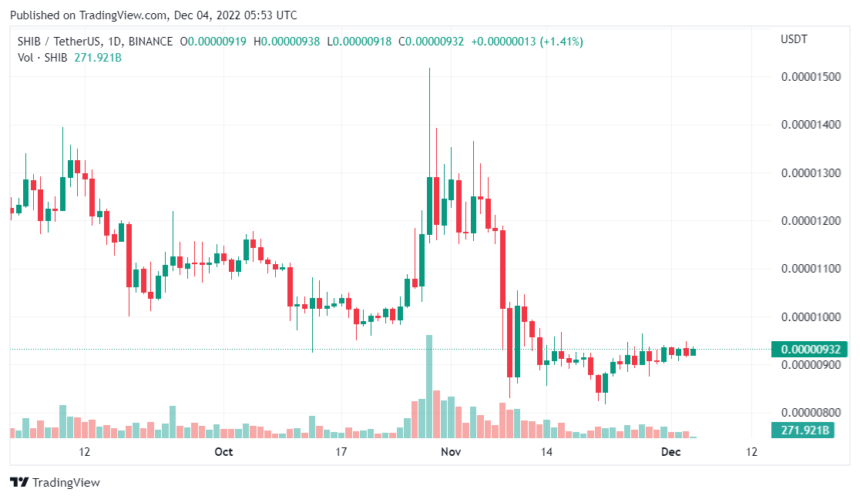
The crypto market’s overall performance has not been impressive, including memecoins like SHIB. The prices of almost all crypto assets declined over the past few weeks. But then, the story changed just when it seemed like the market was to witness high volatility.
With the strong influence of the bears, the value of digital assets took to the south. In addition, the recent collapse of one of the world’s prominent crypto exchanges, FTX, spiked an unfavorable shift in the space.
Following the trend in the market, the leading memecoins have shown strength in their movement. Though the entire market suffered, memecoins fared more positively than most crypto tokens.
Over the last week, Dogecoin (DOGE) rose by almost 14%. On its part, Shiba Inu (SHIB) has given a tremendous upward movement. This new strength in SHIB is raising eyes if the token could make more positive progress in the coming weeks.
Despite the prevailing bearish market trend and other negative factors, SHIB displayed an impressive record. Several top whales have had massive SHIB holdings through the thin period.
As per data from Whalestats, Shiba Inu recorded up to 500 Ethereum whales that hold more than $76 billion worth of SHIB. Furthermore, it reported that the past two weeks had not significantly changed the SHIB holdings of the top 100 whales on the Ethereum chain.
Shiba Inu gathered more value as Elon Musk took over Twitter. This created a spike in the value of SHIB, causing the coin to hit a new ATH in October 2022. After Musk’s acquisition, Shiba Inu was competing favorably against Dogecoin. As a result, arguments erupted online over which memecoin between SHIB and DOGE will hit $1 first.
Even though the collapse of the FTX crypto exchange drained what the memecoin accrued during the period, there’s still hope for it.
The crypto space has been facing growing fear and doubts with the collapse of FTX and the twists of events that followed it. As a result, investors now desire safe investment options in the crypto market to secure their funds.
A report from Santiment Insights highlighted Shiba Inu as one of the safest coins for investment in the current crypto market.
On-chain, data revealed the transfer of about 1.8 trillion SHIB coins in several exchanges early this week. Also, there were similar transfers of Shiba Inu from giant whales following the collapse of the FTX crypto exchange.

According to Santiment, Shiba and Uniswap are historically within the assets group with the lowest purchasing risk. However, they are at the bottom among the top 10 tokens based on Market Cap versus Realised Cap (MVRV) calculations.
Featured image from Pixabay, chart from TradingView.com
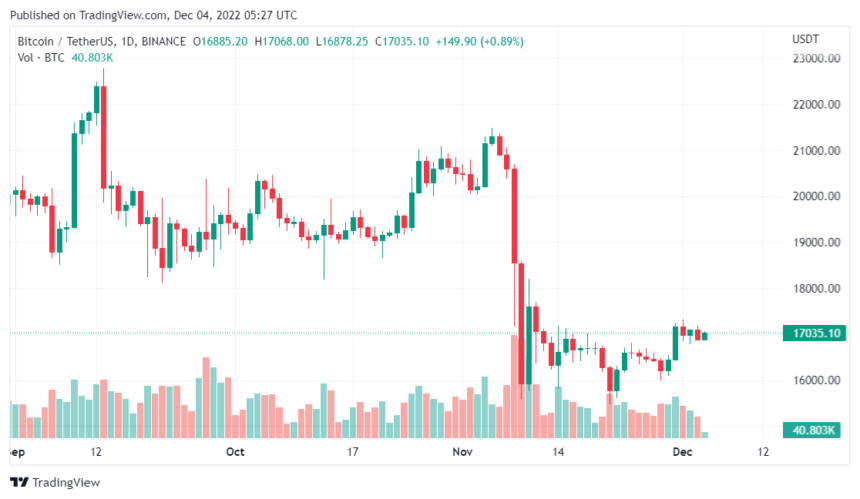
Bitcoin and the entire crypto market bleed due to many challenges that have befallen the industry. From the Terra crash and continuous interest rate hikes to FTX implosion, the market hasn’t enjoyed a whole month of positive price trend.
As the investors cry about the loss of investment funds, the miners of Bitcoin struggle to remain afloat. As a result, BTC price has continued to plummet even with the increasing electricity costs for miners’ operations. But, surprisingly, many miners in Russia will buy mining rigs now.
According to Kommersant’s recent report, many miners in Russia are grabbing more Bitcoin rigs in Q4 of 2022. In addition, the researchers discovered that the sale of ASIC rigs skyrocketed at the end of the year. This is surprising given the continuous fall of crypto assets in the market.
On a closer look, it became clear that Russian miners enjoy cheaper electricity costs. In addition, the country provided more affordable electricity for many regions, making it easier for households and businesses in those places to flourish. So, while other miners in countries with high power cost struggle, their Russian counterparts have it more accessible.
Another reason for gathering more ASIC crypto mining rigs is because of the cheap offer for the equipment. As a result, ASIC prices fell in the country, spurring many miners into action to acquire more.
More reason that led to this surge in mining rig purchases was the rising interest in crypto mining as a viable investment opportunity. According to Xive co-founder Didar Bekbauov, bitcoin mining became attractive because of lesser investment opportunities, sanctions, and the high-tech qualifications of many people in the country.
The buying spree started after the Ministry of Finance of the Russian Federation (MiFin) and the Bank of Russia (BoR) agreed to support crypto mining. But they allowed it in regions with more energy allocations, not those with scarce energy supply.
Secondly, Russian regulators introduced a bill to legalize mining and the sale of mined assets in the country. This bill came up in the Russian State Duma, the lower parliament.
Also, financial analyst Vladislav Antony stated that the lower ASIC mining rigs price, which is now close to the production costs, is a good encouragement for new investors. Mining revenues in Russia have increased recently, even with the BTC price recording a near two-year low.

One of the distributors of mining rigs in Russia, Chikot, recorded more sales in October and November. This was different from their Q3 records.
Data shows that Chikot sales in Q1 to 3 were higher than 2021 sales by 65%. By August and October 2022, the hardware price fell by nearly 20% and remained the same for the following months.
As a result, Chikot even recorded a 30% increase in mining rig purchases in one transaction, different from early 2022 records.
Featured image from Pixabay, chart from TradingView.com


Answering the question ‘Who has/had the oldest mined Bitcoin?’ an anonymous member shared a signature dating back to January 2009, just a week after Bitcoin came into existence.


Grayscale is fighting the good fight on behalf of everyone in cryptocurrency.


Sam Bankman-Fried was consulted on the capital injection, which was made before crypto prices plummeted.


Users can pay bills with cryptocurrency directly from their crypto wallet or using a payment processor acting as an online crypto payment gateway.

TRON (TRX) remains in a stagnant phase, refusing to make any kind of momentum for an upward run despite a number of positive developments that, in many cases if not all, should have helped trigger a significant price movement.
Let’s consider this summary:
Instead, the asset continues to consolidate within a narrow range and is not showing any signs of immediate recovery.
According to the latest information provided by Coingecko, at the time of this writing, TRX is trading at $0.053957.
It only managed to climb by 1.6% during the last week although it is nursing an increase of 6.3% over the last 14 days.
TRON, currently the 17th largest crypto asset in terms of overall valuation with a market cap of $4.97 billion, has already gone down by more than 12% on its month-to-date (MTD) performance.
Not even the news of its mother platform registering a massive stablecoin inflow was enough to make the asset push its price to higher levels.
Tron has seen significant USDT inflows over the past 2 weeks. In total, over $1 Billion of USDT have entered the chain pic.twitter.com/bbB6XRruvi
— DefiLlama.com (@DefiLlama) December 1, 2022
Using Twitter, pseudonymous DeFi Llama shared that the Tron decentralized platform observed an inflow of $1 billion USDT for the past two weeks.
The most notable date during the said time frame was November 18 when the blockchain registered its highest stablecoin inflow. Meanwhile, November 24 and 28 were the other dates when the network experienced spikes in the particular department.
At a quick glance, this development meant that investors are taking action and are showing tremendous trust for the project.
Skeptics, however, were quick to assume that might not have been the case and that Tron founder Justin Sun was behind all of it in his attempt to pump liquidity for TRX.
Nonetheless, this didn’t help Tron’s crypto asset as it continues to struggle in finding its groove to break out of its slump to surge in value.
Basing on the crypto’s four-hour chart, it could be noticed that its Awesome Oscillator (AO) was pegged to be at 0.00045.
Such value is not indicative of a bullish or a bearish movement, therefore it would make sense to say that TRON is currently caught in a neutral momentum.
 Source: TradingView
Meanwhile, the Directional Movement Index (DMI) suggests there is a strong directional push that is going in the way of buyers.
However, buyers may not hold their advantage for a long time as indicated by the cryptocurrency’s Average Directional Index (ADI).
As for forecasts for TRX, Coincodex says the asset will experience a slight price decline within the next five days and will change hands at $0.053338 by December 9.
Come January 3, the digital coin will possess a lower trading price of $0.039659.
TRX total market cap at $4.8 billion on the weekend chart | Featured image from Zipmex, Chart: TradingView.com


The issue is tied to the Gemini Earn program, which offers 8% earn interest on crypto lending and is operated by Gemini in partnership with Genesis.


Smart contacts capable of handling complex computations, while ensuring a level of privacy are the future for enterprise adoption.

MANA, the cryptocurrency used as payment for goods and services in the metaverse project Decentraland, has already lost 33% of its value over the last 30 days.
After going all the way up to $0.7339 on November 5, the asset was on a consistent decline that pulled it down to a monthly low of $0.3611 on November 22.
Below, a summary of how MANA has been performing in the last few days:
Since then, the digital token has engaged in multiple attempts to trim its losses, starting with recapturing the crucial $0.4 marker. So far, the crypto has been successful in this endeavor.
At the time of this writing, according to tracking from Coingecko, the altcoin has managed to increase its value by 3% during the last 24 hours to trade at $0.4174.
Over the previous seven days, MANA has tallied an impressive gain of 6.2% and its price action indicates traders are poised to make profit with the asset.
When the bulls successfully found a resting zone at $0.2572 after the FTX implosion last month that made the cryptocurrency lose all its gains prior to the unfortunate event, MANA price movement ended up being caught in an ascending triangle pattern.
 Source: TradingView
In crypto space, this kind of price trajectory denotes a bullish rally and, in the case of the crypto, some of its technical indicators are suggesting it is not yet done recovering its losses and is headed for another upward breakout.
Its Relative Strength Index (RSI) is steadily rising and has moved out of the oversold territory, indicative of diminishing seller influence and increasing buying opportunities.
Moreover, after being flat for about two weeks, the altcoin’s On-Balance Volume (OBV) moved up, indicating a rise in trading volume brought about by healthy buying momentum.
Finally, MANA has established a bullish MACD which is considered to be a buy signal for an early uptrend.
Given all of these considerations, experts predict that if Bitcoin, being the leader of the pack, is able to recapture and hold the $17K turf, the Decentraland digital token will have $0.4740 and $0.5054 as its next destination.
Holders, prospective buyers and traders must not be complacent due to the idea that they could make sizable profit from MANA right now as there’s still a chance that the bullish thesis could be negated.
Analysts believe that if the crypto fails to close today’s sessions with a price that is higher than the $0.3572 support zone, it will abandon any chance it has of hitting its next targets.
Moreover, Bitcoin is also integral to MANA’s progress as its failure to sustain the $17K region could doom the 57th largest cryptocurrency in terms of market capitalization.
At the time of this writing, BTC is changing hands at $17,025 and is dangerously close of falling back to the $16,000 region once again.
MANA total market cap at $772 million on the weekend chart | Featured image from CoinCentral, Chart: TradingView.com

Solana (SOL), post-FTX life, has been very rough. On a monthly and biweekly time frame, CoinGecko data shows bearishness, while daily and weekly time frames show modest appreciation.
What this proves is that the wounds left by the demise of FTX have not been healed by Solana’s native token.
Ever since FTX collapsed, SOL has been losing a huge amount energy.
As bearish signals continue to emerge from technical analysis, the price decrease is likely to continue.
It’s possible that prices will fall down below the 61.80 Fibonacci level, which is now at $12.58.
This may be because Alameda Research, FTX’s sibling in the business, had a significant role in the Solana ICO.
Investor trust plummeted as concerns about Solana’s close ties to SBF and his company developed in the wake of the failing exchange’s holding of almost a billion in SOL.
SOL was the poster child of DeFi in that side of the crypto industry. As of writing, the token is trading at a red candle at $13.55, a staggering 62.2% decrease in value from its $36.83 price pre-FTX.
However, Solana’s prospects are bleak even before the crash. Messari’s Q3 report on Solana reveals that only certain ecosystem components, such as NFTs, have truly stabilized and even flourished.

Chart: TradingView
However, the token’s technical aspects show potential. The RSI readings are oversold, while the metric is slowly gaining pace. This is backed by a favorable increase in the CMF index.
However, this occurs on a daily basis. In the 4-hour time frame, it created a triangle that is, to say the least, bearish.
With a Pearson’s R score of 0.7, the regression channel confirms a further downward push, indicating that a downtrend is more likely than an uptrend.
The narrow BB channel is likewise extremely bearish. Not to mention the resistance posed by the center band.
FUD (fear, uncertainty and doubt) is prevalent in this case.
The market is dominated by fear and a negative market mood as a result of Solana’s tight relations to FTX.
The 4-hour timeline provides insight about SOL’s future course. The $13.07 is a vital support zone for SOL to stay out of extinction.
If the indicated support is breached by the bears, a plunge below the 61.80 Fibonacci level is not out of the question.
SOL total market cap at $4.9 billion on the weekend chart | Featured image from Business 2 Community, Chart: TradingView.com


Avalanche’s partnership with Alibaba Cloud will see the development of tools that enable users to launch validator nodes on Avalanche’s public blockchain platform in Asia.
Sam Bankman-Fried’s fraud of misappropriating users’ funds have led investors to explore options that can help safeguard their investments.
The entire crypto market bled with multiple losses and asset devaluation after the collapse of Sam Bankman-Fried’s crypto exchange FTX. In addition, crypto firms exposed to FTX got a fair share of the bitter pill.
Investigations have been ongoing to determine the location of the $8 billion hole in FTX’s balance sheet, which caused the liquidity crunch.
The deficit in FTX’s balance sheet kept growing. The firm initially declared only $2 billion and later said it was $5 billion. The hole has now grown to over $8 billion.
In a recent Bloomberg interview, Sam Bankman-Fried (SBF), FTX former CEO, revealed the whereabouts of the funds. SBF said he showed investors a separate balance sheet at an emergency bailout.
According to the report, SBF listed $8.9 billion in debt, $9 billion in liquid assets, and $15.4 billion in less liquid assets. The report also mentioned $3.2 billion in illiquid assets.
He revealed another balance sheet showing the actual situation at the time of the bailout meeting. The balance sheet bears similar numbers but $8 billion less liquid assets. SBF said he misquoted the numbers.
He added that customers were transferring money to Alameda Research instead of sending it directly to FTX. According to his statement, FTX’s internal audit system double-counted the amount and credited it to both firms.
Following SBF’s statement, FTX and Alameda Research had the highest cash flow, but Binance, a rival, became the highest expense. He paid a net amount of $2.5 billion to buy out Binance’s investments. SBF also revealed that he spent $250 million on real estate and about $1.5 billion on other expenses.
Some $4 billion and $1.5 billion went into venture capital investments to acquire other firms, while they counted $1 billion by mistake.
The report also stated that SBF and the remaining employees spent the previous weekend attempting to raise funds. The funds are to fill the $8 billion hole in FTX’s balance sheet and repay customers.
Meanwhile, most people in the crypto space say the FTX crisis is a fraud and not an accident. On Wednesday, during his first public appearance after the collapse of FTX, Bankman-Fried insisted that he did not commit fraud. He claimed that he was unaware of the extent of damage and what was going on with FTX.
In an interview with The New York Times, SBF blamed the collapse of the $32 billion FTX exchange on poor accounting and management failures. This comment triggered civil and criminal investigations. The investigation aims to determine whether FTX committed a crime by lending customers’ funds to Alameda Research.

However, FTX’s new CEO, John Ray III, in charge of the firm’s bankruptcy proceeding, expressed disgust at the situation. In his words, Ray said he had never seen such a complete failure of corporate control, condemning SBF for unacceptable management practices.
Featured image from Texas Tribune, chart from TradingView.com

This week saw a positive recovery in some crypto assets, Ethereum included. It is gaining momentum and preparing for a bullish rally in the days to come. Although Ethereum is still below $1,300, some factors suggest a possible increase to $1,350 and $1,550.
The crypto market has been filled with FUD (fear, uncertainty, and doubt) in the past weeks following the FTX crisis. Crypto investors are left speculating whether to buy or sell holdings as assets plunged deeper. For example, reports show that Ethereum lost nearly 39% in a couple of weeks.
The crypto market has been anticipating news of the U.S. Federal Reserve dropping its bullish stance on interest rate hikes from December. As signals point towards this expectation becoming a reality, some assets started showing signs of recovery. However, despite the bullish trend, Bitcoin remains down due to miners’ capitulation, while Ethereum is rising.
Coinglass’ crypto derivatives data shows that Ether futures open interest on Binance has reached an all-time high of 2.01 million. It amounts to a 9% increase in Open Interest in the last 24 hours, indicating a high probability that Ethereum will increase in the coming weeks.
On-chain data from Glassnode also revealed that the total value of the Ethereum 2.0 deposit contract hit an all-time high of 15,492,407 ETH. Ethereum validators’ revenue has also reached a 1-month high of 11.310%.

These records have got players and analysts reacting. For example, Michael van de Poppe believes ETH is exhibiting strength as it rose from the $1,150 level to the current price. The analyst predicts that a break above the $1,225 level would trigger a rally toward $1,350 and maybe $1,550.
Traders look forward to holding their Ether if it remains above the support level of $1,200. Analysts also believe the ETH price increase will rub off on other altcoins.
Many traders were bullish about Ethereum’s price increase after the completion of the merger. However, Ethereum neither surpassed nor bounced back to the $1,700 level after the merge. With the macroeconomic situation, the asset continued falling and went below the $1,500 physiological.
Whale accumulations saw ETH price drop from $1,661 to $1081 in one month. Whales saw the price declines as an opportunity to accumulate ETH holdings. Whale accumulations are often indicators of an asset’s bullish recovery. However, it didn’t seem so initially for Ethereum, whose price dipped to $1,081.
Now the tables are turning, and Ethereum seems to gain bullish momentum, rising towards $1,350. Ethereum is trading at $1,283 with a 24-hour trading volume of $6,205,108,773.

With the ETH price above the critical support level of $1,225, there may be hope for more increase. The price surged nearly 2% in 24 hours and 8% in the past week.
Featured image from Pexels, chart from CoinGlass and TradingView.com


The ex-president of FTX US, Brett Harrison, is reportedly planning to launch a start-up that would build crypto trading software for big investors.

On-chain data shows the historical 20-Day MA Bitcoin aSOPR support level has continued to hold so far.
As pointed out by an analyst in a CryptoQuant post, the BTC aSOPR recently retested its 8-year old support.
The “Spent Output Profit Ratio” (or SOPR in short) is an indicator that tells us whether the average Bitcoin investor is selling at a profit or at a loss right now.
When the value of this metric is greater than 1, it means the overall market is moving coins at some profit currently.
On the other hand, values of the indicator less than the threshold suggest holders as a whole are realizing some loss with their selling at the moment.
Naturally, SOPR values exactly equal to 1 imply the investors are just breaking even on their investment right now.
“Adjusted SOPR” (aSOPR) is a modified version of this metric that excludes from the data any selling of coins that was done within 1 hour of first acquiring said coins.
Here is a chart that shows the trend in the 20-day moving average Bitcoin aSOPR over the last several years:

Looks like the 20-day MA value of the metric has sharply declined in recent days | Source: CryptoQuant
As you can see in the above graph, the 20-day MA aSOPR rapidly went down following the FTX crash, and touched a low of 0.93 just a week or so ago.
This level was the same as the one seen during the lows of the previous bear markets, and each of the touches in those bears launched the metric back up.
The support line has now been active since 2014, and in the 8 years so far the indicator has never seen any actual dip below it.
Since the retest of this support level a week ago, the metric has already bounced back up, suggesting that this important support line is still holding right now.
However, it’s uncertain whether this successful retest means the bottom is now in. Back In the 2018/19 bear, it was indeed the case, but in 2014/15 it took two touches of the line before the real bottom formed.
At the time of writing, Bitcoin’s price floats around $16.8k, up 3% in the last week. Over the past month, the crypto has lost 18% in value.
The below chart shows the trend in the BTC price over the last five days.

The value of the crypto seems to have been moving sideways since the surge | Source: BTCUSD on TradingView
Featured image from André François McKenzie on Unsplash.com, charts from TradingView.com, CryptoQuant.com

The cryptocurrency-focused financial services firm won an auction to buy the company from crypto lender Celsius, which filed for Chapter 11 bankruptcy protection. Crypto Markets Today is CoinDesk’s daily newsletter diving into what happened in today’s crypto markets.


